Bard
BardParticipant
Master
Hunting the Lesser Spotted Standard Deviation Bell Curve Indicator!
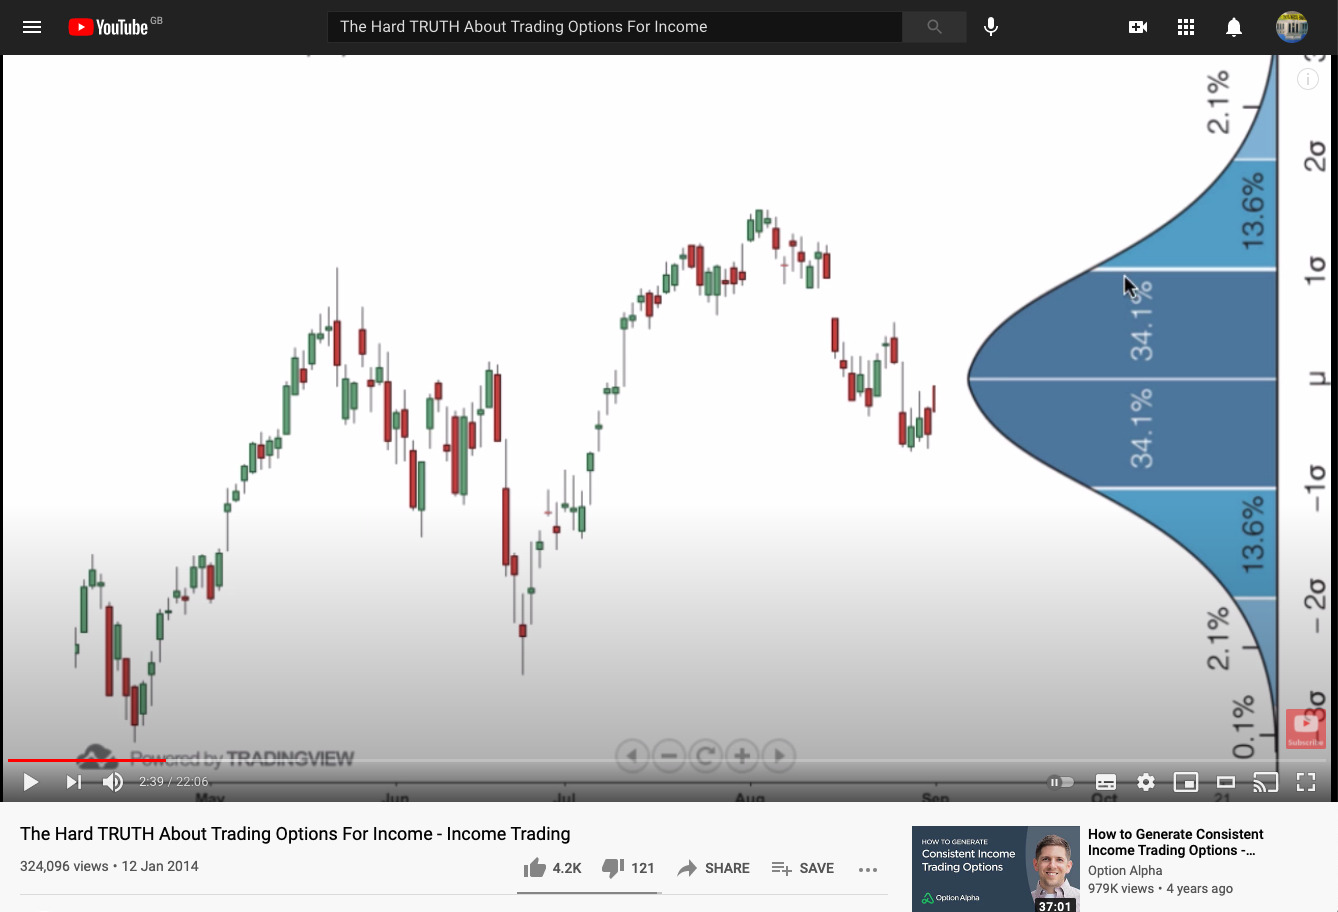
Hi, I’m sure I’ve seen something like this in PRC but can’t find it? Pls see image.
It may not have been a Std Dev indicator but it would be good to have something based on my image or this PRC indicator but as a bell curve:
https://www.prorealcode.com/prorealtime-indicators/automatic-drawing-standard-deviation-channel/
Has anyone else seen what I mean on their travels around this forum or know if such an indicator can be made?
Cheers
Bard
Vonasi made a lot of statistical indicators: https://www.prorealcode.com/user/vonasi/
BTW, your picture only show what is a normal distribution (gaussian bell: https://en.wikipedia.org/wiki/Normal_distribution) , so what do you expect exactly?
BardParticipant
Master
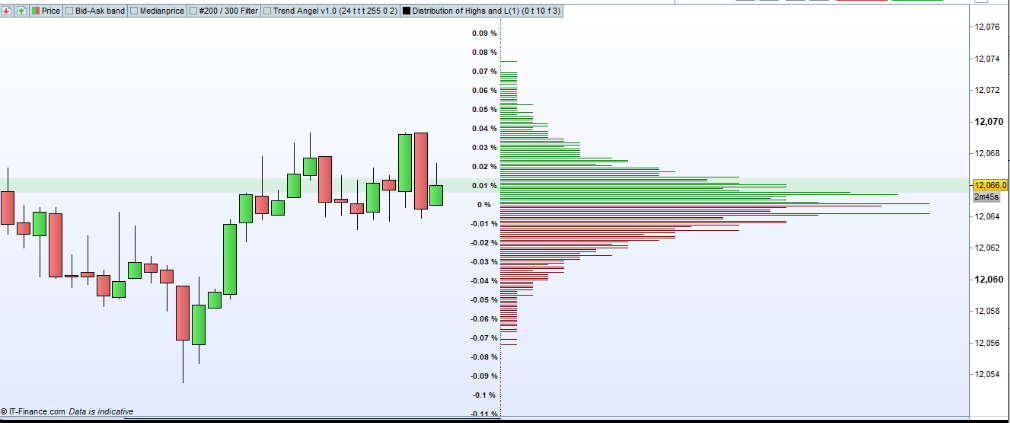
Cheers for the link @Nicolas, Vonasi does some very interesting work and the nearest I can see (despite bell being the opposite way round) is this one, using Williams%R, RSI, Stochastic and ADX: https://www.prorealcode.com/prorealtime-indicators/distribution-of-index/
I meant the same thing, a probability distribution curve that shows 1, and 2 and 3 std (and more) deviations in price, in a visually compelling way that highlights those most statistically probable price zones (using the side bell curve). I think this bell curve to the side is better visually than using a standard deviation indicator overlay (using bands) over a price chart because isn’t always immediately obvious where the price probabilities consistently reside.
Options Alpha created the image, the indicator doesn’t exist in Trading View although there is this: (second image) https://www.prorealcode.com/topic/vwap-bands-standard-deviation/#post-136152
Can an indicator like the original image I uploaded be created?
Thanks,
I was working on some bell curve indicators a few weeks back with the hope of creating something that could be sold in the MarketPlace when it opens. Unfortunately I am having some IG account issues at the moment that are preventing me from accessing my PRT platform! This means that all development is currently on hold so all I can do at the moment is give a screen shot of how things were progressing and not actually provide any further assistance!
BardParticipant
Master
Great, thanks @Vonasi, this looks promising. I had trouble logging in to IG last week, I hope your issue resolves soon.
I think it would be a great addition to see a std deviation bell curve indicator added to the PRC library.
BardParticipant
Master
Hi @Vonasi, I took another look and downloaded your Distribution of Index indicator: https://www.prorealcode.com/prorealtime-indicators/distribution-of-index/
I hope you don’t mind, I modified it to a STD distribution and had a couple of questions? The code is attached below as an itf file.
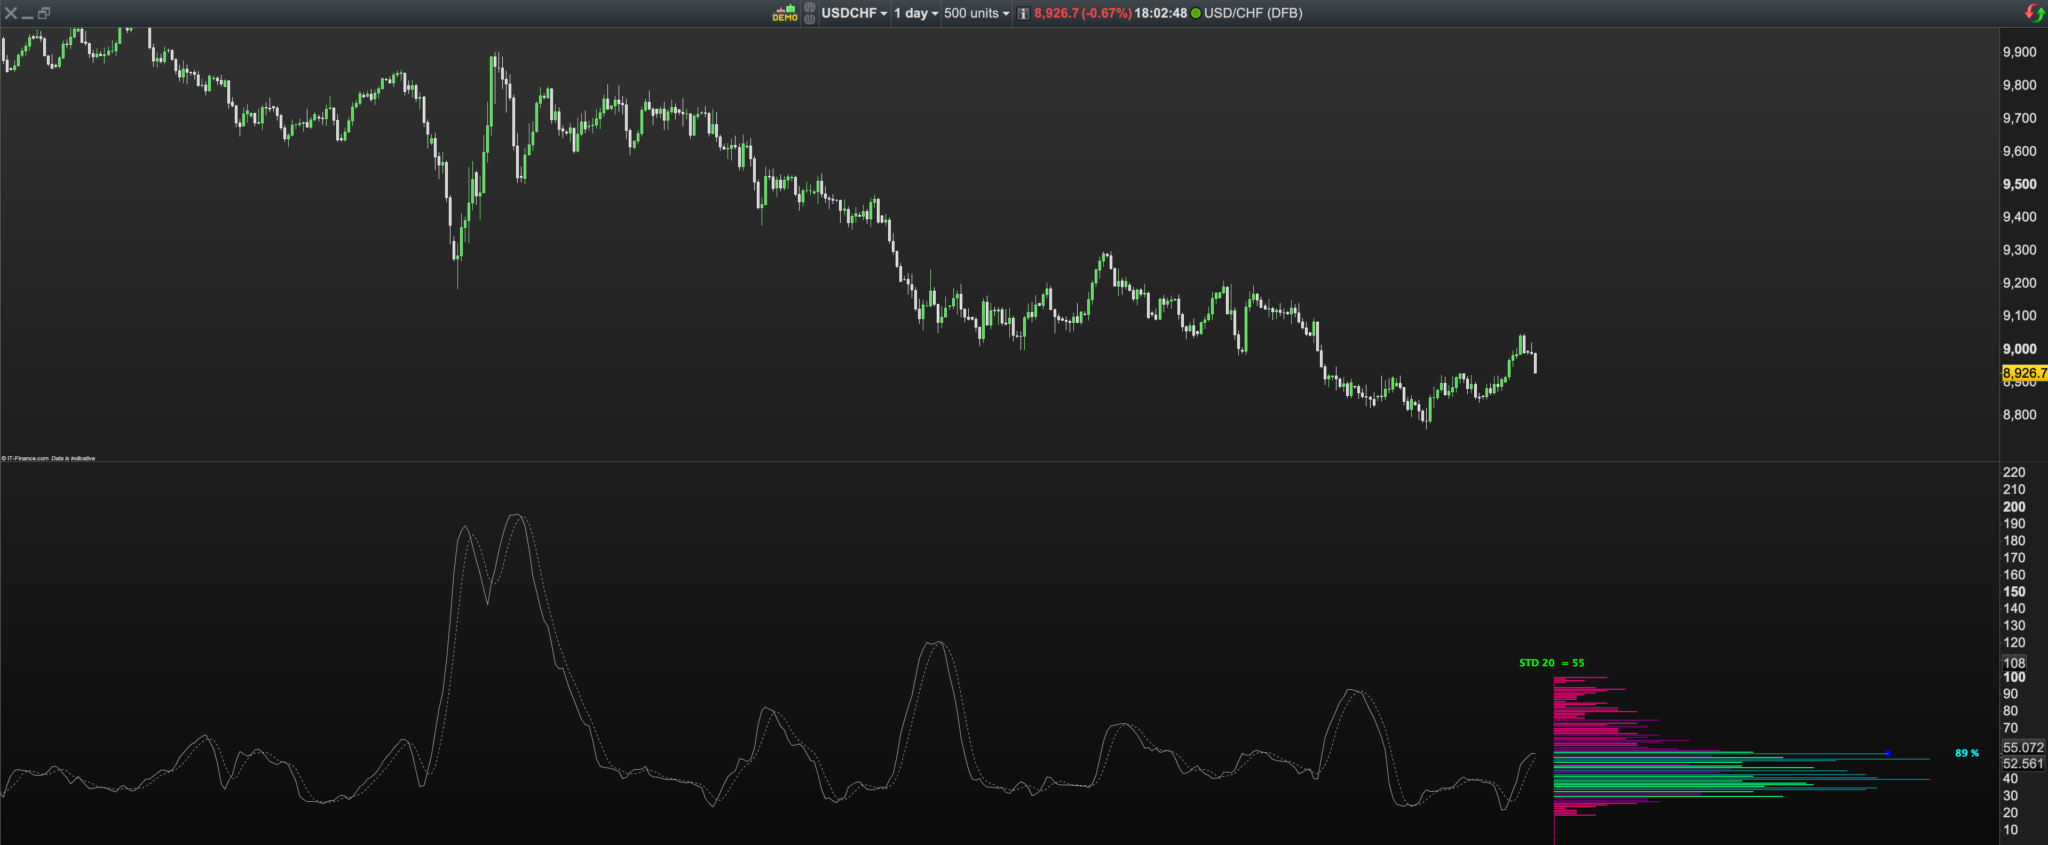
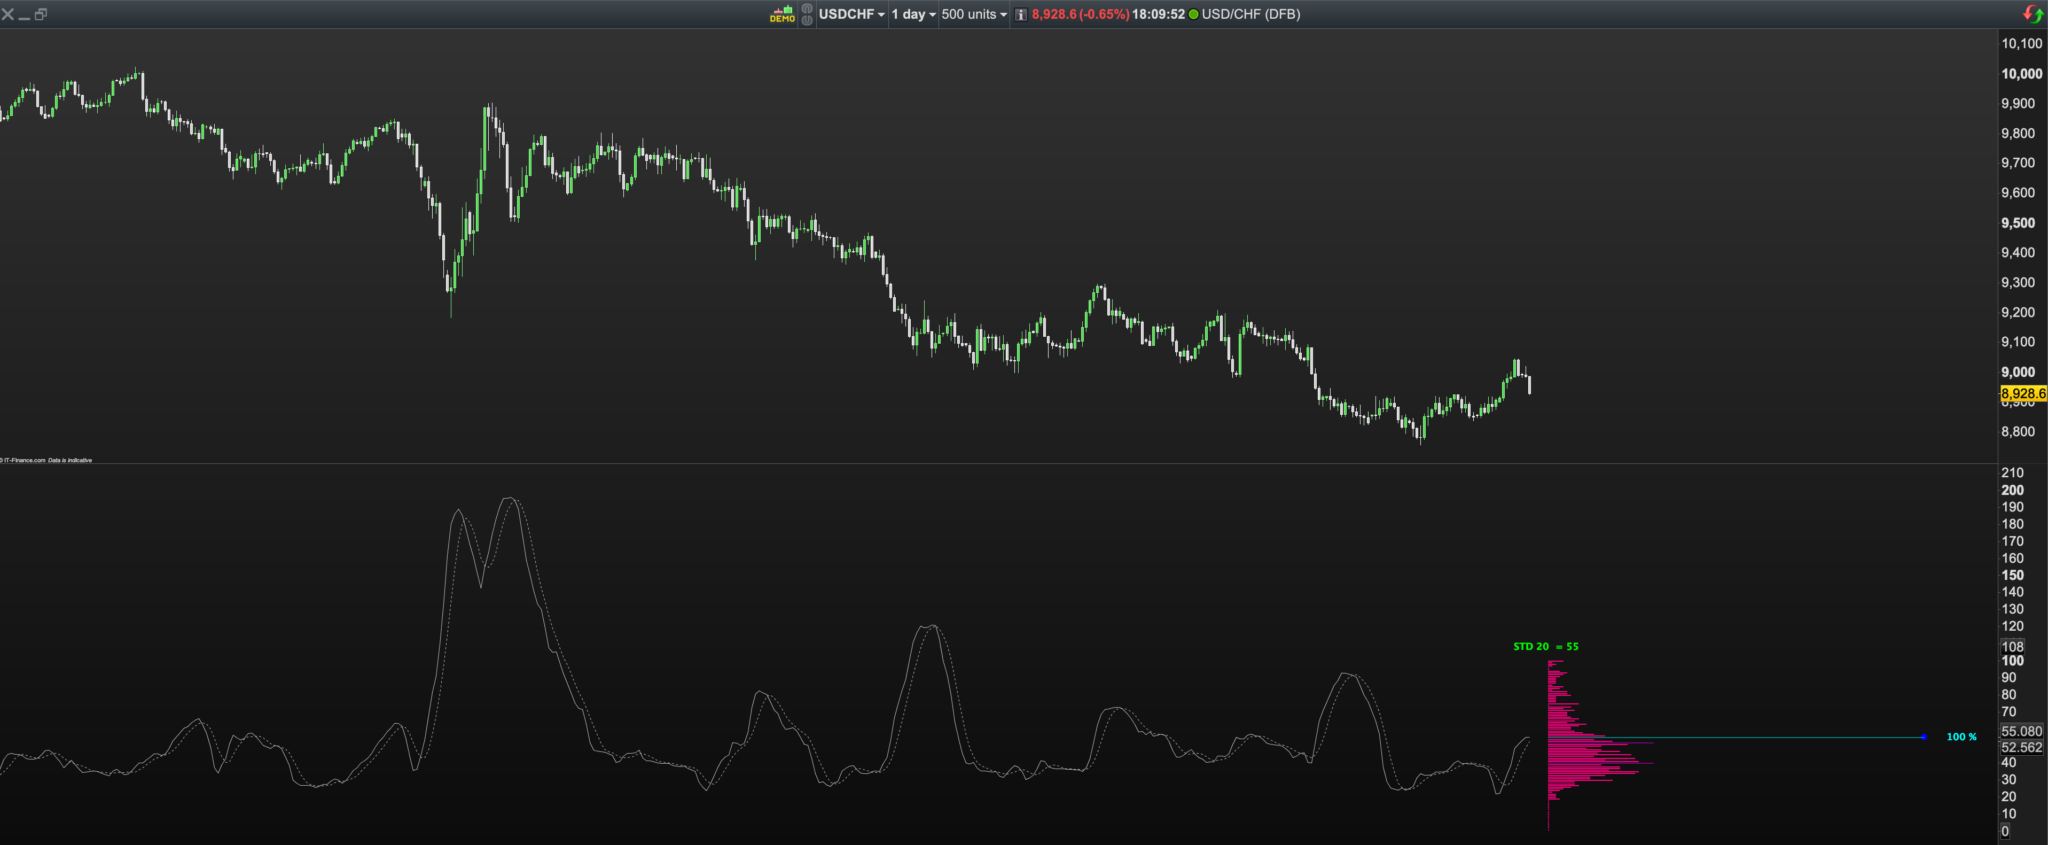
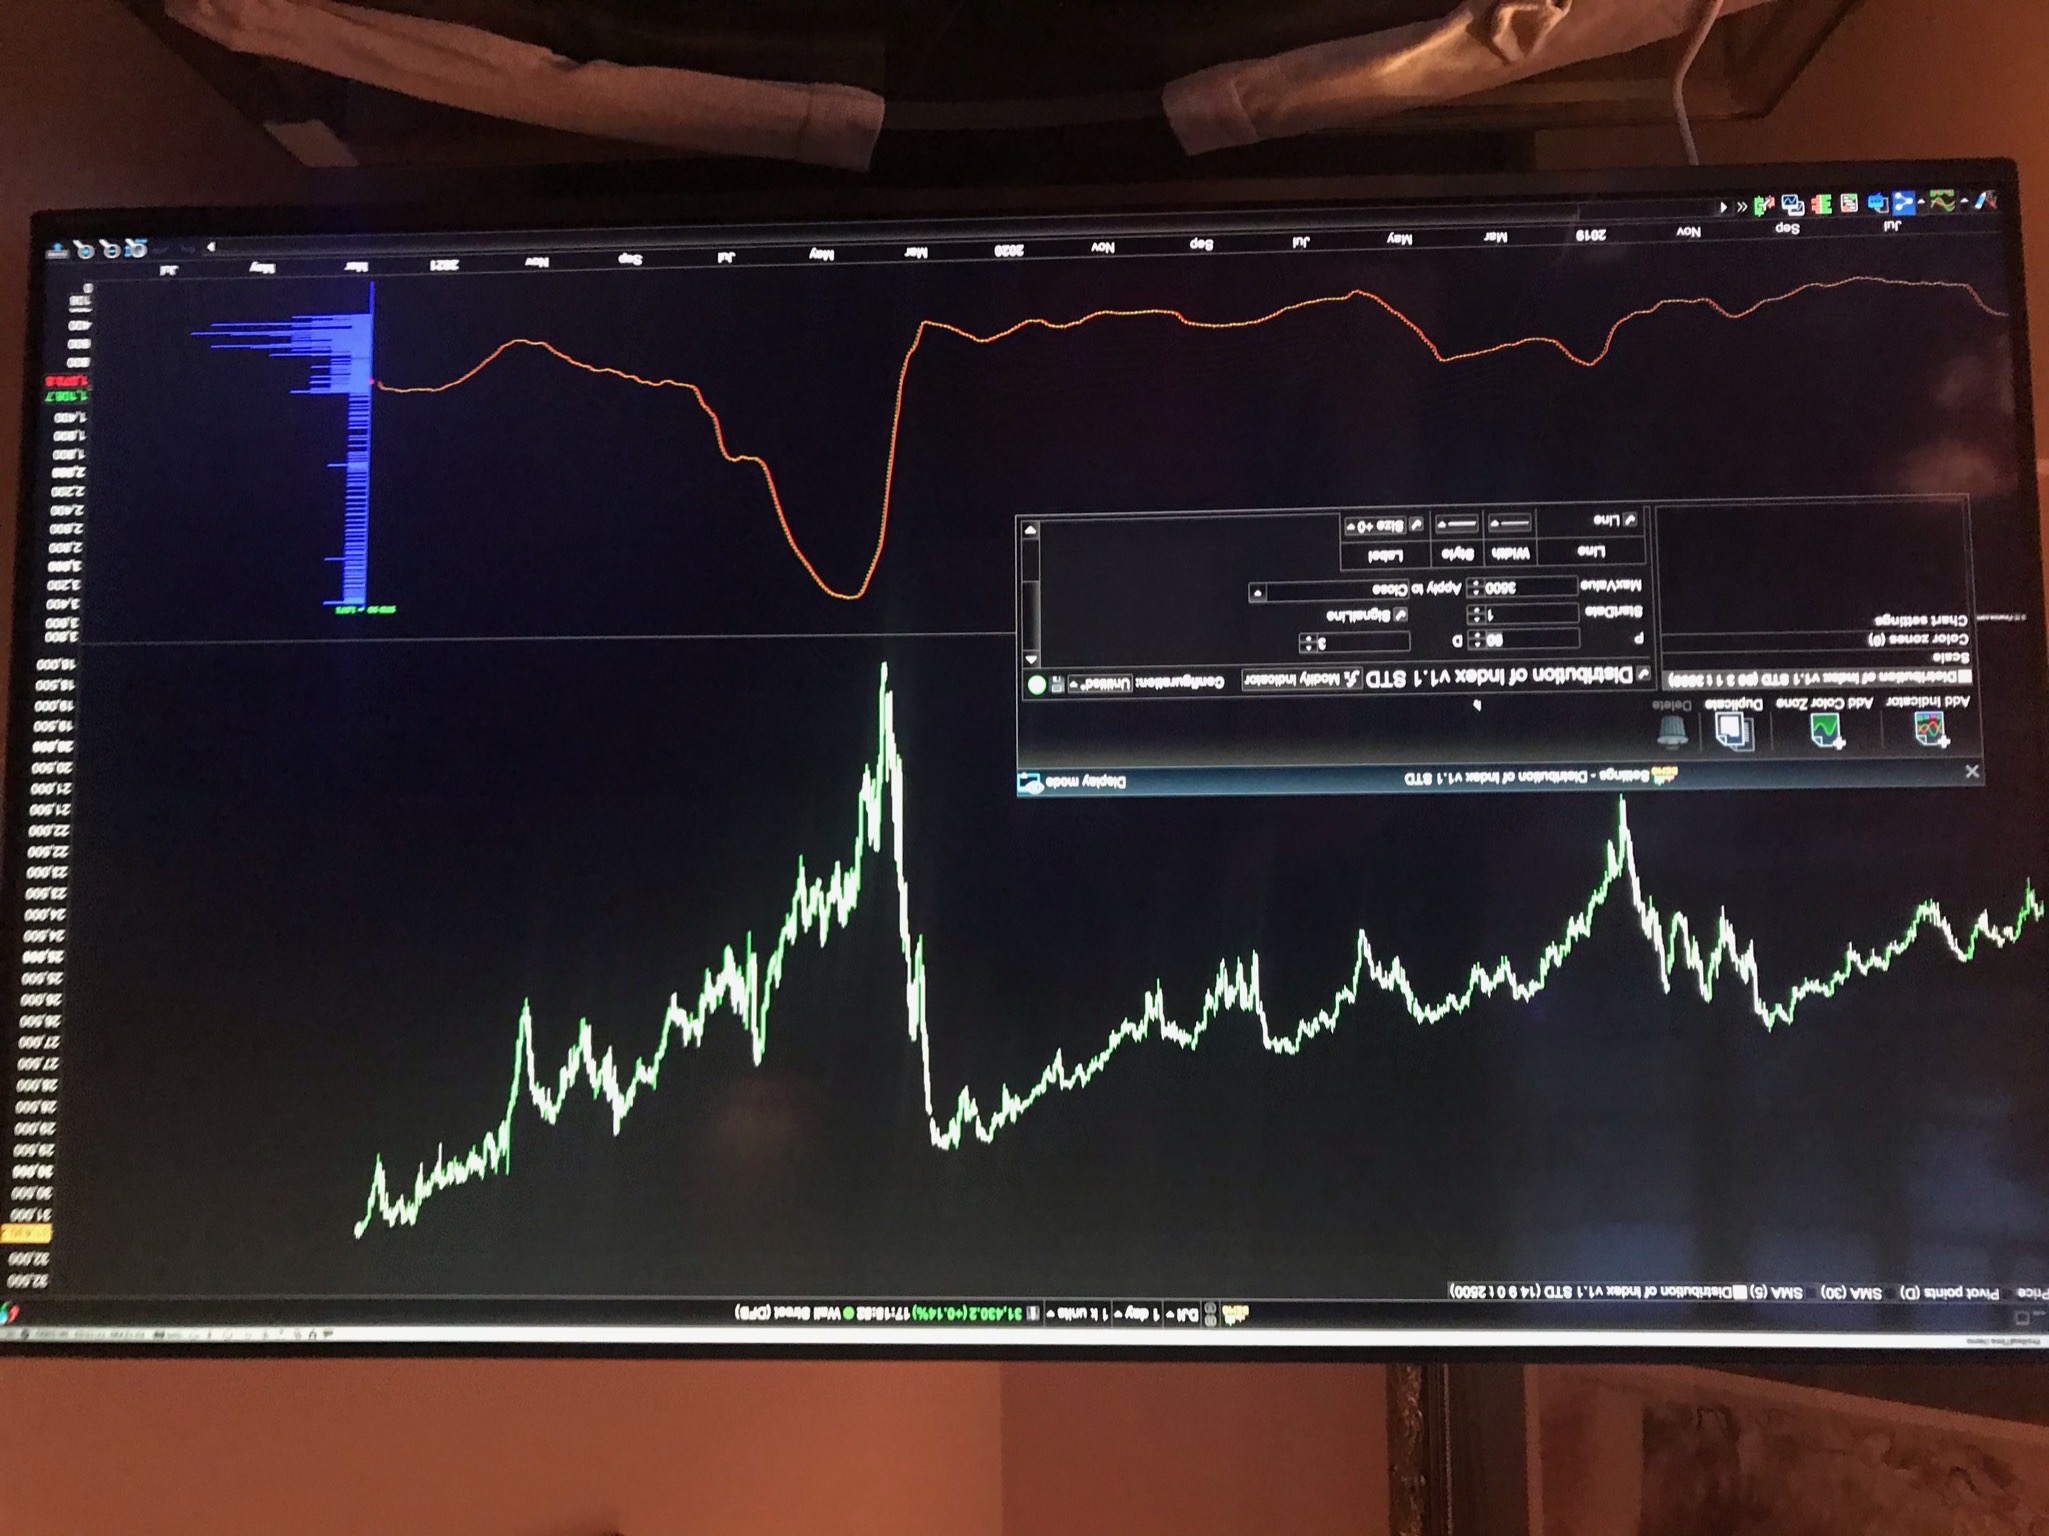
Is it normal for the Bell Curve to shrink? I had it set to a weekly Dow chart 1000 units and so wasn’t expecting current live market prices to have any/much impact on the bell curve and yet it does. With the USD/CHF it also ends up in the >25% and all purple after a short time? Pls see images of the daily USD/CHF set to a 20 day STD taken 7 mins apart.
I also wondered how would I get it to over lay on to the Price chart (instead of being a separate panel indicator) and how would it need to be coded to show the 1, 2 and 3 std deviations instead of percentiles?
Cheers,
Best
Bard
Sorry Bard but I still have no access to my PRT platform so downloading ITF files is not possible.
I have recently discovered that the bell curve updates tick by tick on the last bar which is not something that I had noticed before as I was using end of day data and not live data. Off forum Nicolas came up with a fix for this which worked on my new indicator. Unfortunately as I said I have no platform access at the moment so cannot tell you what that fix was or how to apply it to that older indicator.
OK – I have access to a PRT platform again now and I have fixed the bug in my Distribution of Index indicator.
I’ve also had a chance to look at your modifications and they don’t work because my indicator was developed to only work on indicators that return values between 0 and 100 whereas STD can return values greater than 100.
I have modified the code and added a MaxValue variable which you can adjust to match whatever maximum STD returns you are getting. I have also removed all the colouring code as this only worked on values between 0 and 100 too.
I have also added the bug fix that stops it updating tick by tick.
//Distribution of Index STD
//PRT v11 onwards
//By Vonasi
//Date: 20210509

//p = 14                // Period used for STD
//d = 9                 // Period used for signal line
//MaxValue = 2500       // Maximum value to draw to.

//SignalLine = 1        // Turn on/off display of signal line
//StartDate = 19950101  // Date to start analysis from. Zero = all data

if date >= startdate then
if islastbarupdate then
$lastopen[0]=open
endif

d = max(1,d)
once signal = undefined
indicator = STD[p]
endif

if signalline then
signal = average[d](indicator)
endif

rindicator = round(indicator)

if open<>$lastopen[0] then
for a = 1 to maxvalue
if rindicator = a then
$perc[a] = $perc[a]+1
maxval = max(maxval,$perc[a])
break
endif
next
endif

if islastbarupdate then
for a = 1 to maxvalue
thisperc = round(($perc[a]/maxval)*100)
if rindicator = a then
drawpoint(barindex+thisperc+5,a,3) coloured(128,0,0)
endif
r = 0
g = 0
drawrectangle(barindex+5,a,barindex+thisperc+5,a) coloured(r,g,128)
next

drawtext("STD #p# = #rindicator#",barindex+5,maxvalue+8,sansserif,bold,14) coloured(0,255,0)
endif

return 0 coloured(0,0,0,0) as "Line",108 coloured(0,0,0,0) as "Line",indicator as "Std Indicator",signal style(dottedline) as "Ave Signal"
BardParticipant
Master
Excellent, thanks for posting the code so quickly @Vonasi.
I was thinking, can it be made to overlay on the right of the price chart and can the bell be inverted along it’s y axis?
Also is it possible to add the zero mean and the +/- 1, 2 and 3 Std Deviation lines within the bell?
Thanks once again!
The simple answer is that it probably could but not voluntarily by me! The difficulty is one of scaling – there would need to be some very complicated calculations to move it onto a price based chart.
BardParticipant
Master
Right, thanks. Can the curve be flipped left to right so the peak of the bell faces the candlesticks and can std dev lines be added?
Cheers for your help, it’s much appreciated.
For anyone seeing this, here’s a good article on the Normal Distribution and actual Market Returns for the S&P 500, — 1950 to 2014:
“The normal distribution holds that ~68% of returns should occur within one standard deviation of the mean, yet the actual number is an astonishing 95.6%. Another important factor is that researchers have noted that financial markets have become more volatile over time. In normal distribution events that deviate from the mean by five or more standard deviations (“5-sigma events”) have lower probability, thus meaning that in the normal distribution rare events can happen but are likely to be milder in comparison to fat-tailed distributions. What we see in the table below is that these Fat Tailed Events happen quite often. A look at the number of sigma events by decade makes that clear.”
https://www.thenatureofmarkets.com/lessons/5987/
Can the curve be flipped left to right so the peak of the bell faces the candlesticks and can std dev lines be added?
Also once again not as easy as it sounds. To flip it we have to know which is the highest value in the plot and then base all the drawing calculations off of that in reverse so as to make sure that we are not drawing over the STD line. It’s a lot of coding work for very little return. I would suggest turning your computer screen upside down if you want it the other way round.
As for STD lines – you can draw a line at any value just by adding that value to the RETURN line.
BardParticipant
Master
As for STD lines – you can draw a line at any value just by adding that value to the RETURN line.
I’m having a little trouble getting these mean and +/-1, 2 and 3 standard deviation values lines onto the indicator. Like for example, first I thought it’d be possible to have those std dev lines embed and display
within the bell curve, as per my original blue bell curve image at the top of this post. Adding “Mean = average(indicator)” though will only draw the average across the signal line part of the indicator and not place a mean line at the centre (mean) of those blue rectangle index values, so I’m wondering how to get these values into the bell curve?
Cheers,
BardParticipant
Master
so I’m wondering how to get these values into the bell curve?
Is it possible to provide the code that would put those +/-1, 2 and 3 standard deviation values lines within the bell curve or is that not possible
@Vonasi,
@Nicolas?
As expected most of those more significant crossovers of the Standard Deviation line (10 period) and Signal Line (3 period) give great long/short entry points.
Any help much appreciated,
Cheers,