So true 😆
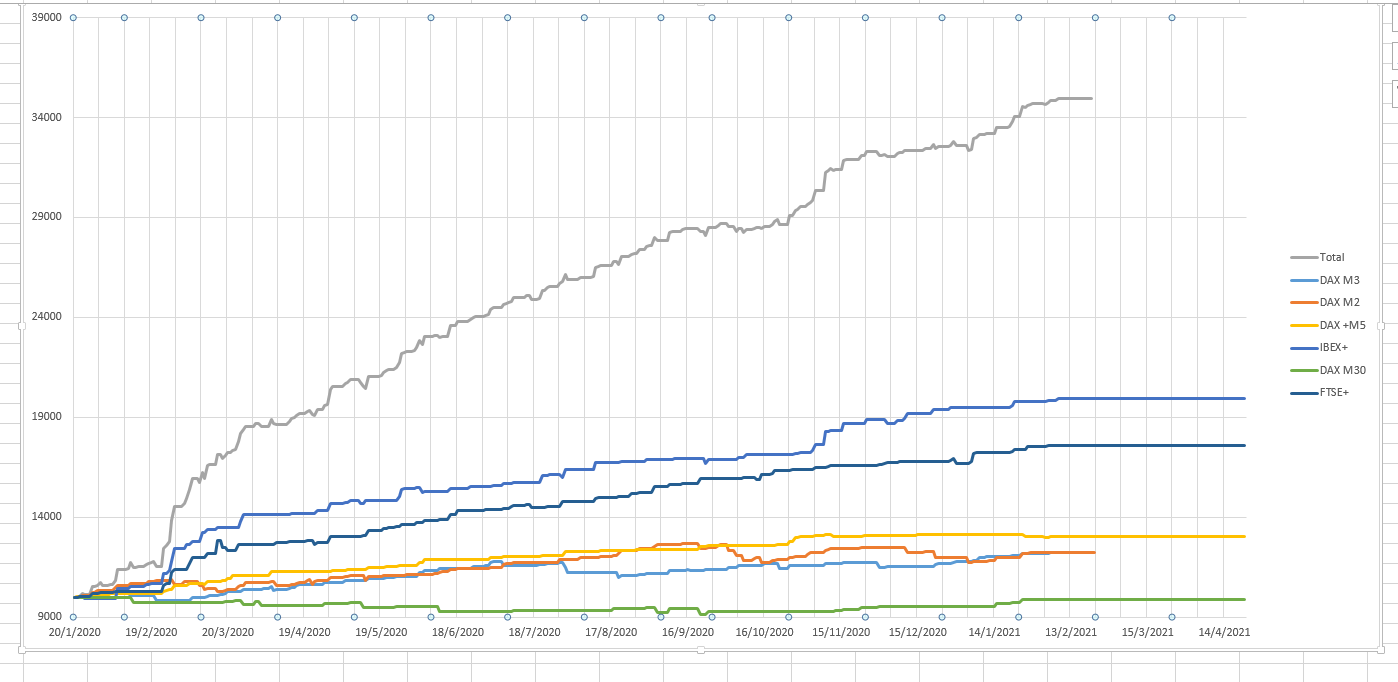
If of interest to anyone, I combined what is considered some of the best algos from PRA and looked at the combined equity curve based on the recommended position sizing.
One surprising point is how well the algos performed during the Feb/Mar 2020 timeframe, curve fitting 😆
Contrary to what was said before some of the new algos have a reasonable loss/win ratio (lie IBEX+ and FTSE+)
…and as has previously been explained the win size/loss size ratio is completely irrelevant. What is relevant is that in a large sample of trades a strategy wins at least one penny more than it loses because then it can be classified as a winning strategy. It matters not one bit if it does this by winning 10% of all trades or by winning 90% of all trades.
The win size/loss size ratio is not completely irrelevant in my eyes. With large stop loss values, it is very easy to optimize away bad positions that run into stop loss, because they occur rather seldom. The result is a curve fit that looks good but performs badly in reality. With smaller sl values and higher win / loss ratio, good looking backtests often run better under real conditions out of sample. Just my experience.
With smaller sl values and higher win / loss ratio, good looking backtests often run better under real conditions out of sample.
Well that’s just plain obvious. Any strategy with a high win rate and small stop loss is going to be a better strategy than a strategy with a (low win rate and and small stop loss) or (high win rate and large stop loss) or (low win rate and large stop loss). The simple relationship between risk and reward tells us this. The difficulty when deciding upon the difference between a good strategy and a bad strategy comes from deciding what the exact definition of high win rate and exact definition of small stop loss is.
What is “exact” in trading, please. The difficulty is to distinguish curve fit A with better chances to perform well in reality from curve fit B that looks equally good but has lesser chances. As far as I can see, the performance curves discussed in this thread have large stop loss values, high win rates and “not-so-good” win/loss ratios.
Let’s agree on the following : smaller stop loss values and higher win rates may have better chances to perform well out of sample. But not always and necessarily.
We were never in disagreement. But just saying that a strategy has big stop losses, high win rates and a “not-so-good” win/loss ratio tells us nothing.
What is a “not-so-good” win/loss ratio? If a strategy wins more than it loses then that is a good win/loss ratio. If it loses more than it wins then that is a bad win/loss ratio. So what is a not so good win loss ratio? Where do we draw the line? That is what I mean by exact. It is a personal choice of what is good, bad and not so good.
A strategy could have a stop loss that adjusts with volatility and price change and in 2008 it made a loss of 5% and in 2016 it made a loss of 10% in major market turns but as long as it made more in between these losing trades than it lost then who is to say it is a bad strategy. The person who starts it today and then gets a 15% loser tomorrow might doubt it but if instead he had a lot of winning trades in a row and then they were all wiped out by one trade then that person can only complain that perhaps he could have made more at 0.1% interest at the bank.
I wonder how many great strategies have been stopped on day one because they lost money only to go on and perform well after they were stopped and how many have never been put live because the trader doesn’t like the idea of a big loss occasionally?
Back during the time of the Brexit vote I was manually trading using a system on various instruments and on the night of the vote several of my strategies hit their very big stop losses. Then on the night Trump got in they did it again. I almost cried until I added up how much I had won before they had those big losses. I was still nicely up and so I could not hate that manual trading strategy at all and never having traded it just because the stop loss was big would have been a mistake to my pocket.
On a separate note – please use the ‘quote’ facility only when it is truly necessary. You were quoting me immediately after I had posted and it was obvious you were responding to my post. I have deleted the quote in your post to make the topic more easily readable.
I think these guys at PRA are doing a great job in being transparent.
Unfortunately when you test the algos versus 1 M units, these of course do not look as attractive as they were clearly built based on 100-200 K data sample.
The new OOS data that the 1 M units gives us, might be a reality of the future, the curve fit is not so nice and these algos perform just ok.
All being said, their weekly progress continue to be good and worthwhile following and trialing.
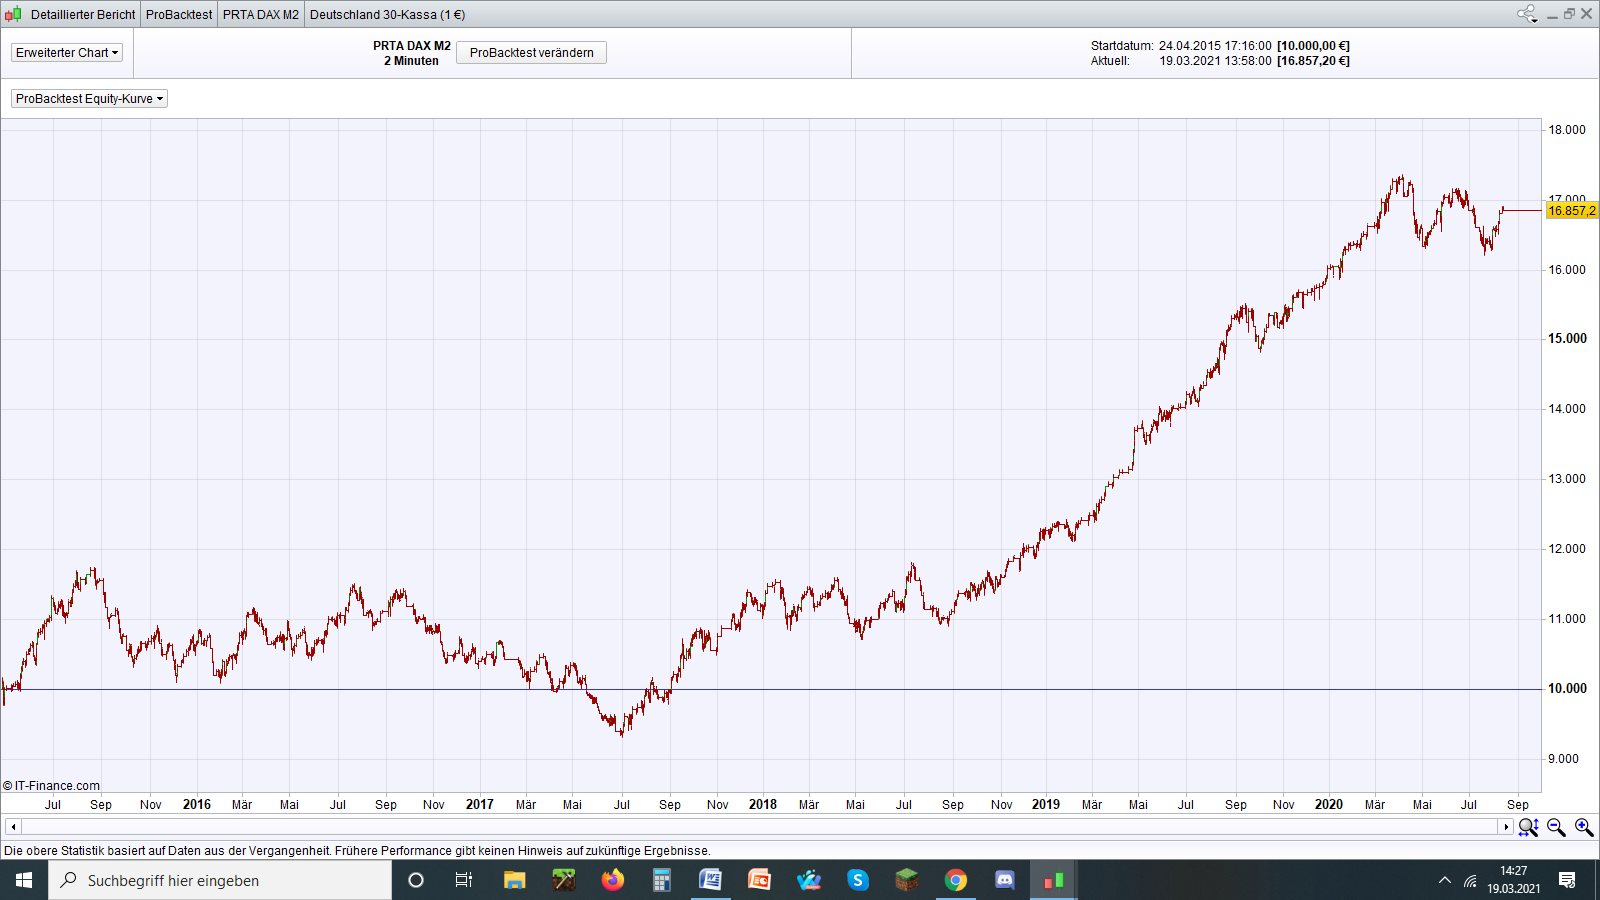
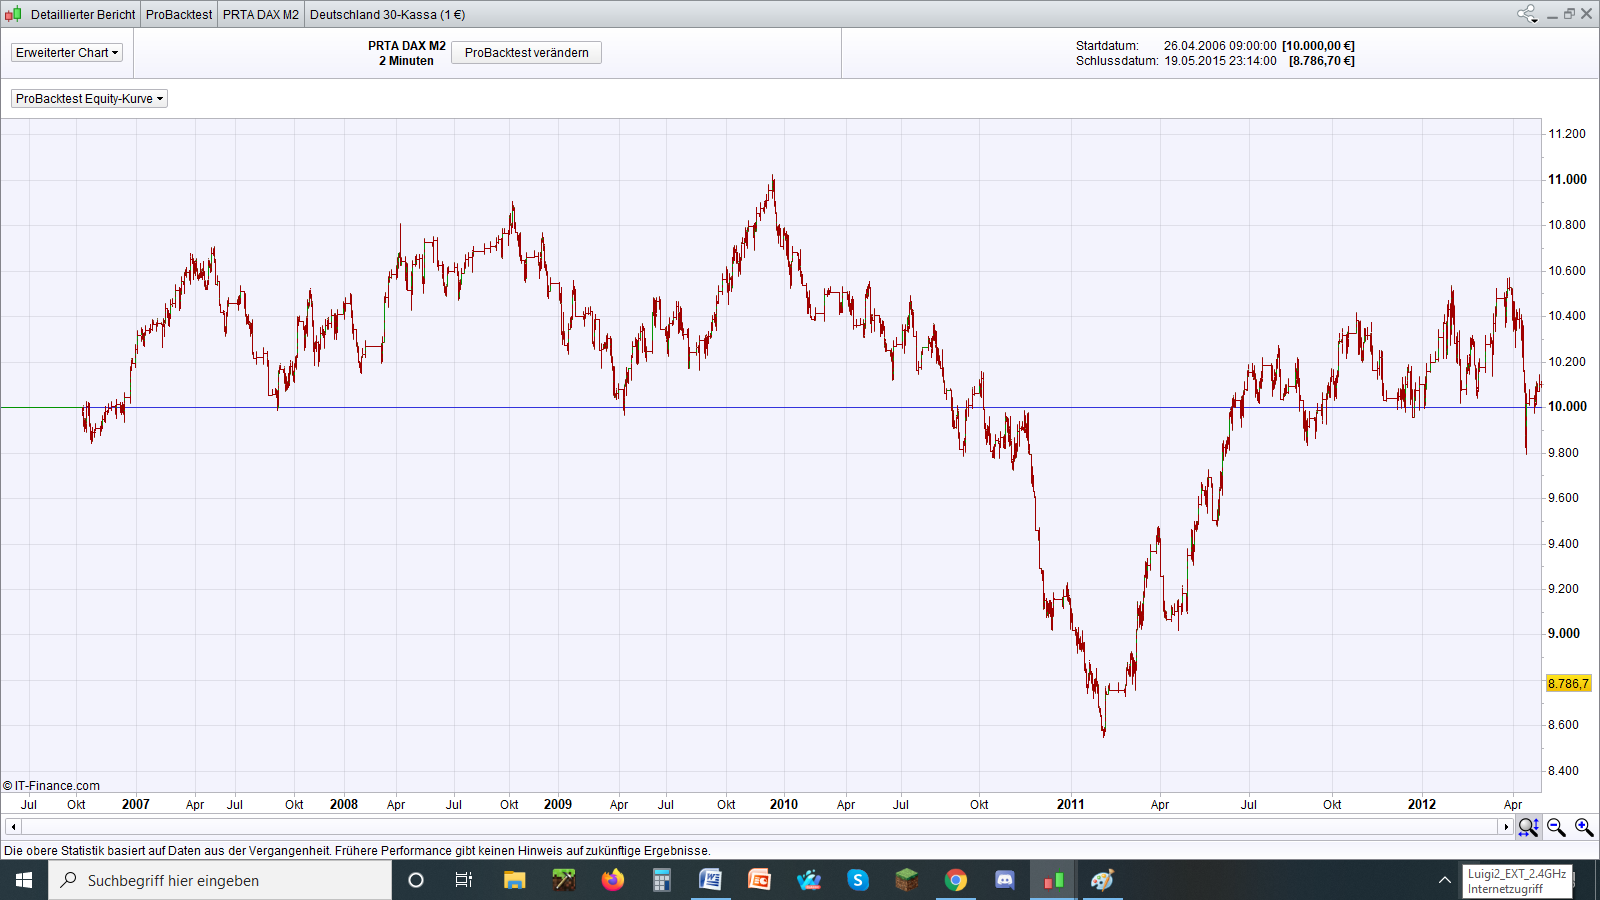
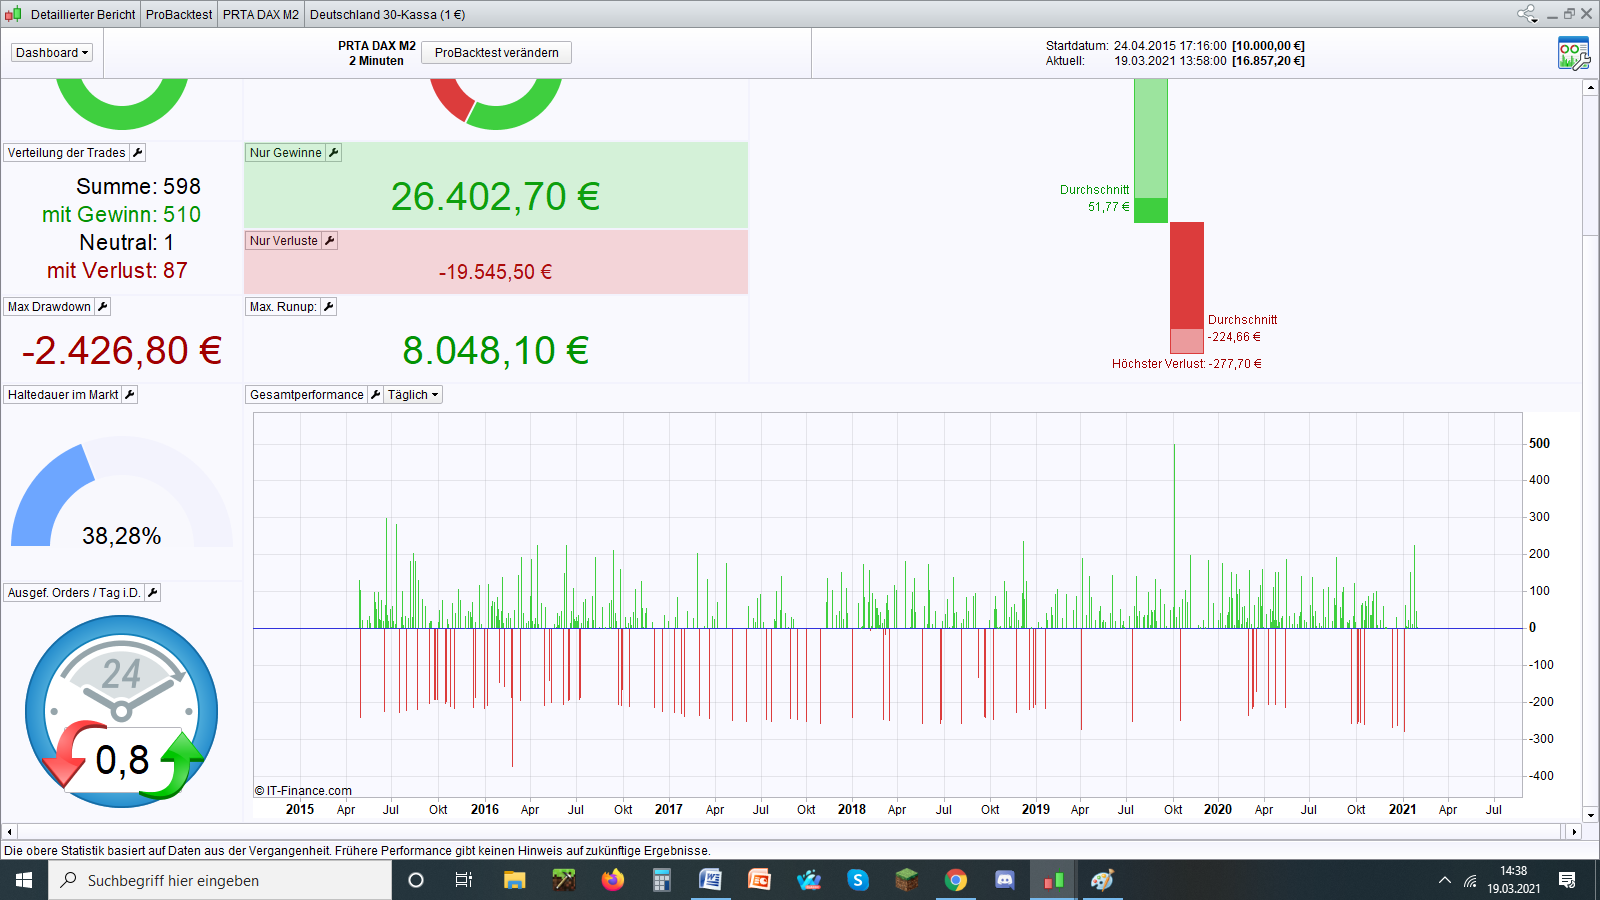
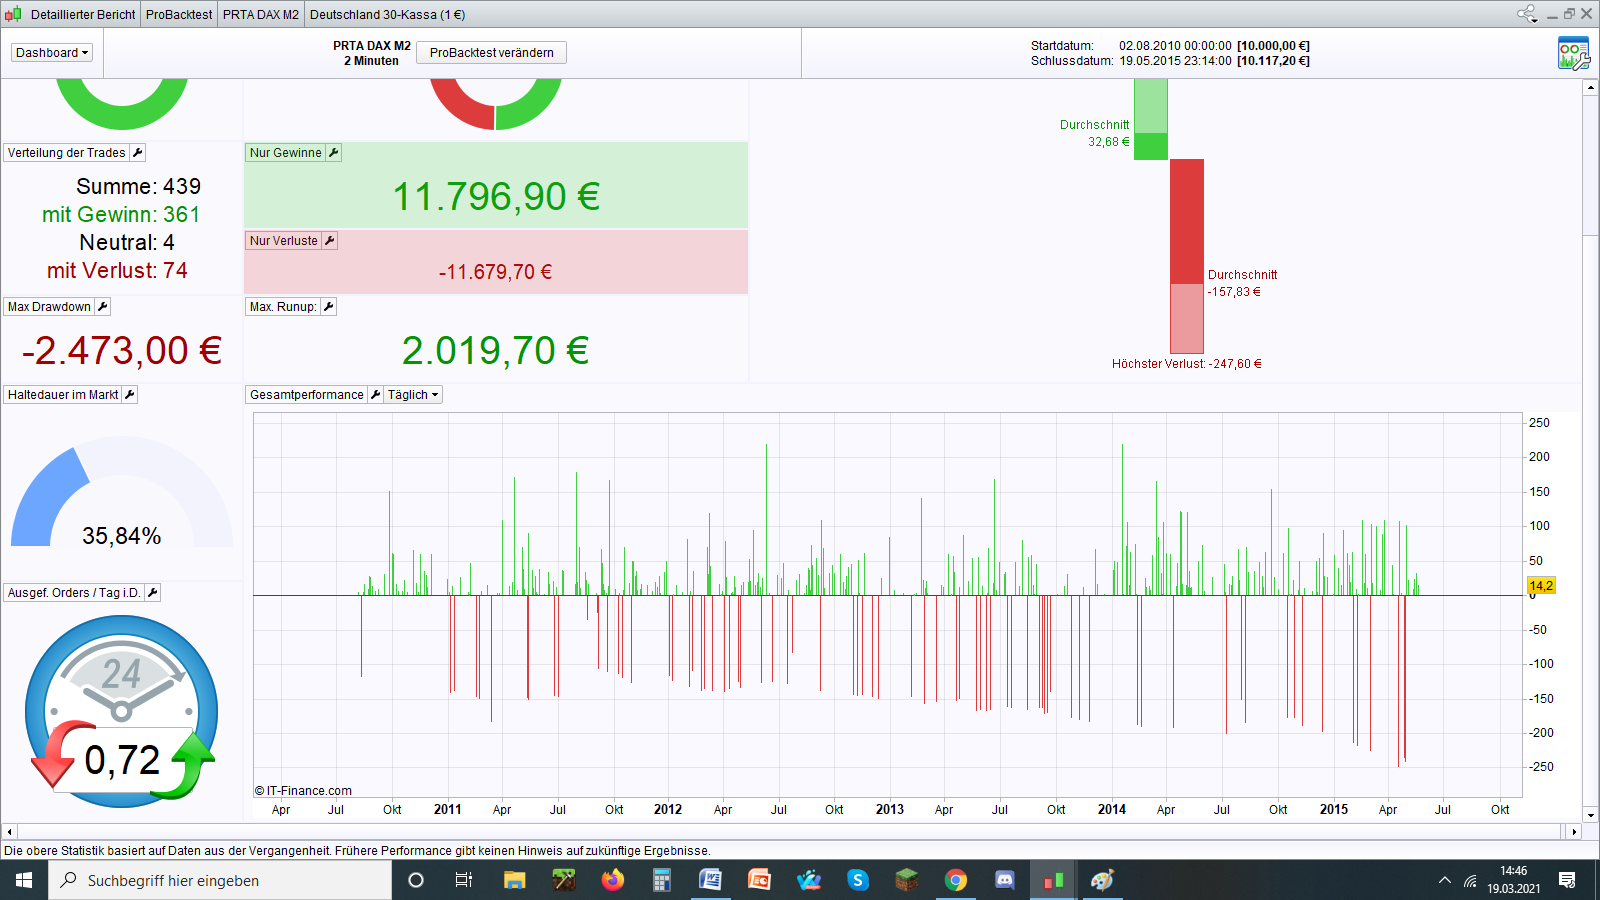
I just tested the DAX 2 minute system (PRTA DAX M2) posted for general viewing on drive.google.com over almost 2 million bars backwards. Unfortunately, the time scales on both advanced charts are wrong; this is a well-known and still unresolved bug in v11. The real period displayed in the first chart is May, 2015 to January, 29, 2021 (last traded day) and in the second chart, it is August, 2010 to May, 2015. The third and fourth attachment show the detailed reports for both periods. Everyone’s own judgment what to think of it.
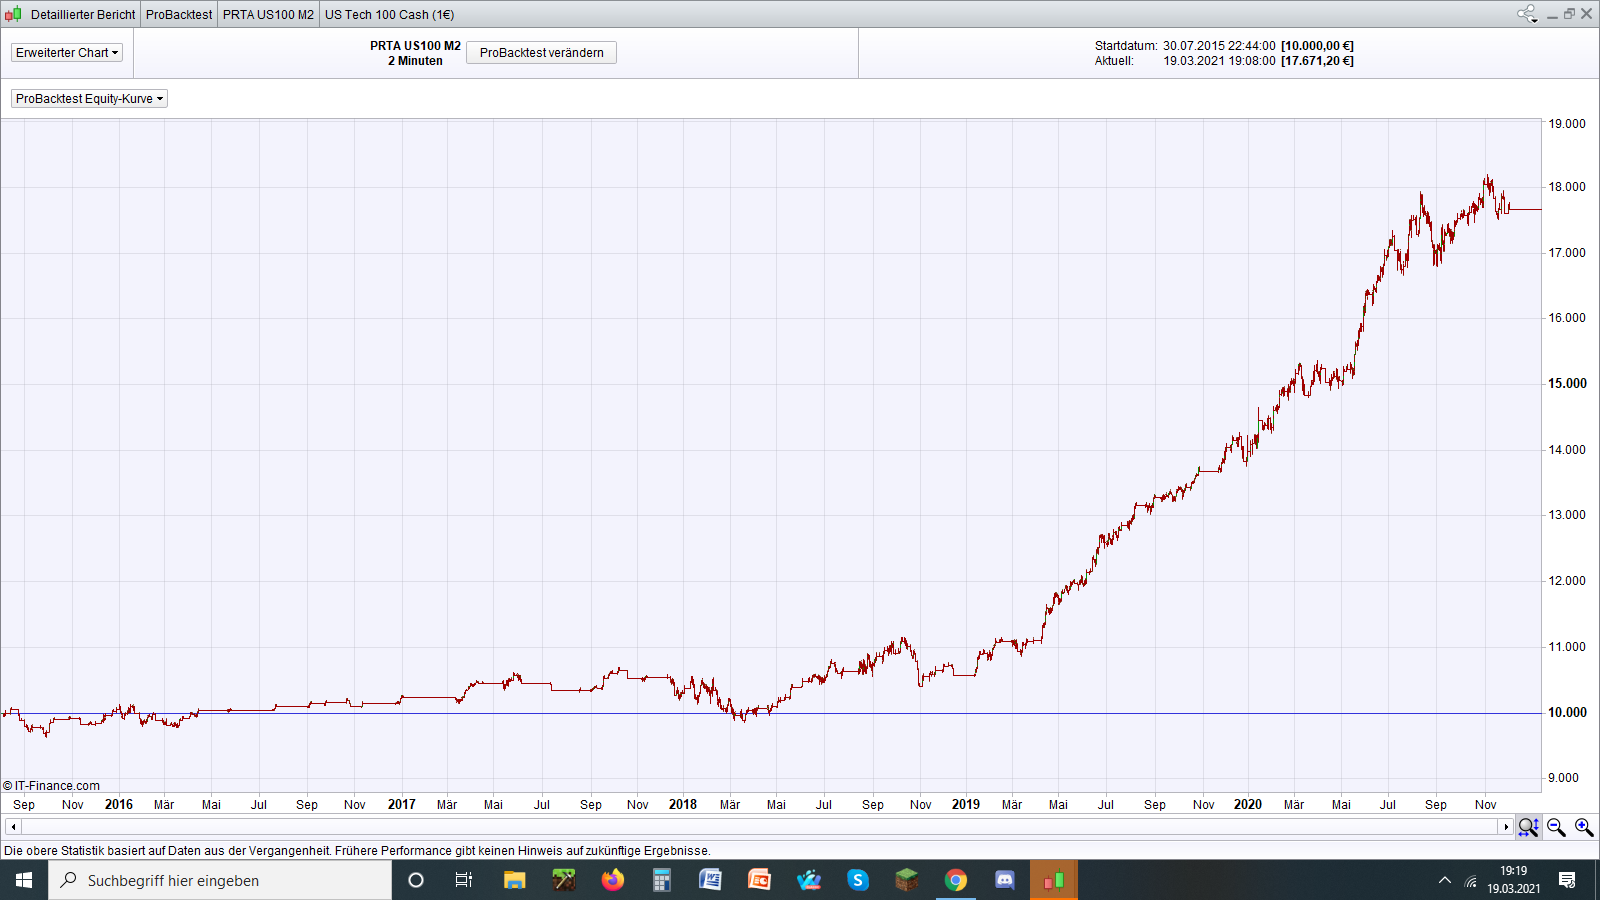
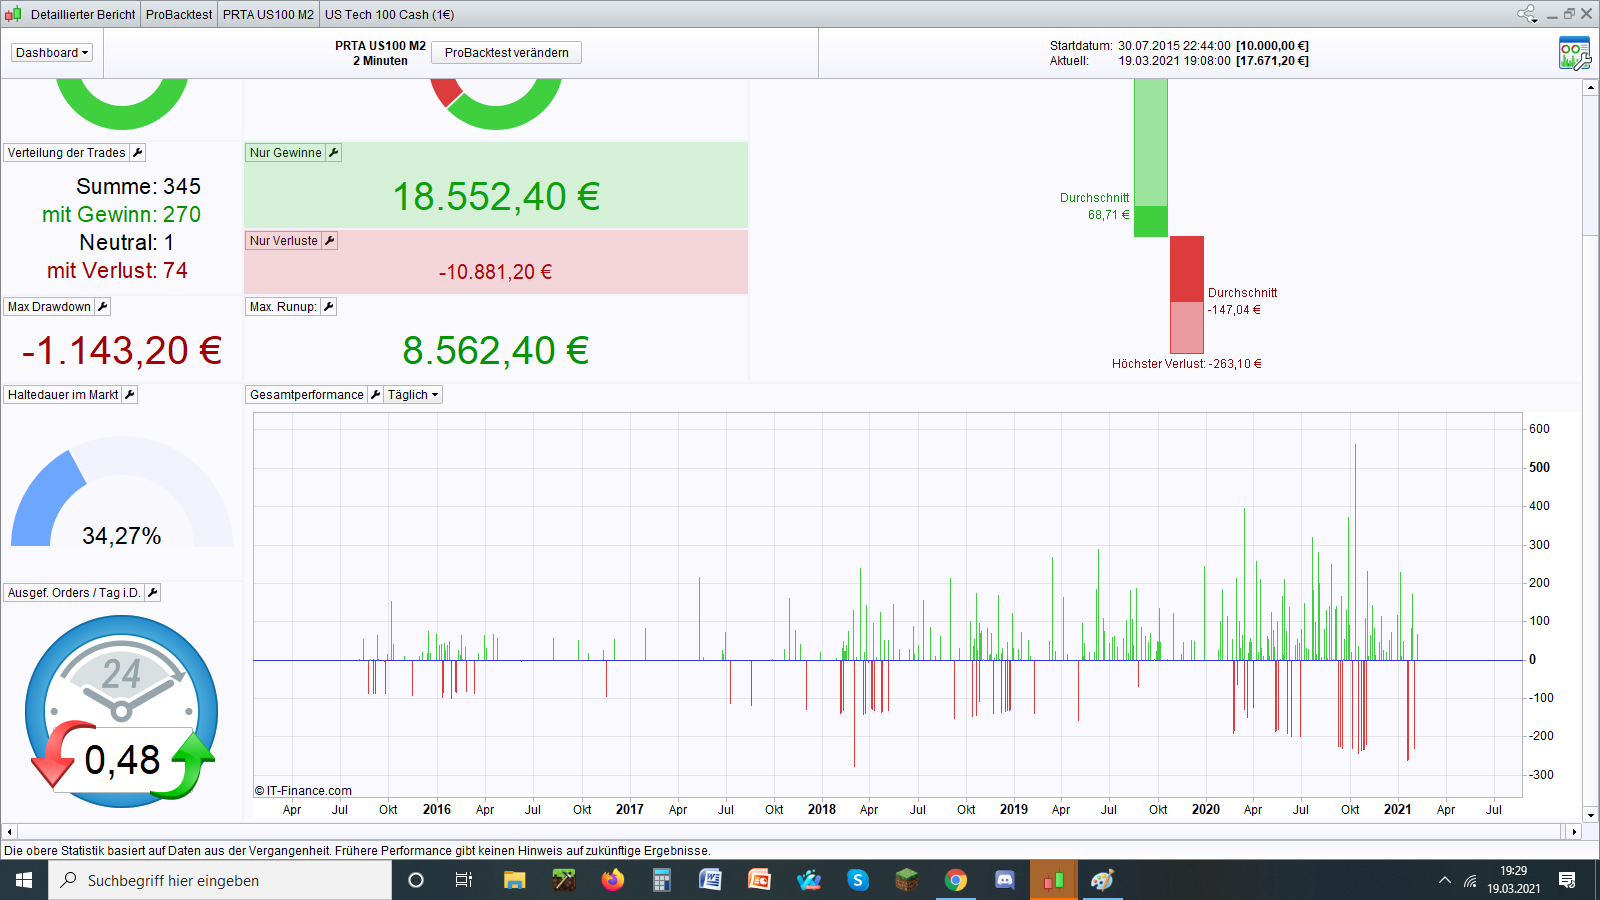
Same test for another “popular” algo, PRTA US100 M2 (US Tech 2 minutes) over 1 million bars. What a surprise. Who would have thought that the good period starts in May 2019, just like for the DAX 2 minute system ? The time axis is almost (although not entirely) correct in this advanced chart.
Hi XORANDNOT
Not sure how you do testing over 2 M bars. I thought we were limited to 1 M. Anyway, I tested most of the 20 algos versus 1 M bars, and virtually all of them show a nice curve fitting against the period they were developped against (IS).
As soon as you test with 1 M bars (or the IS data) , it goes pear shape. Happy to share the results (but I haven’t kept all the screenshots just the results).
Having said that, I must admit they are having nice results so far with all the algos combined. Luck or ???
Sorry meant as soon as , in the OOS data , then it is not so nice
Hi XORANDNOT
Not sure how you do testing over 2 M bars. I thought we were limited to 1 M.
To test over 2 million bars (or over all data you get from IG), you do 1 million bars first, note the starting date and then do another backtest, not by number of bars, but by custom date. For example, if 1 million bars go back to May, 2015, you do a second backtest with custom dates (not bars) starting in August, 2010 (when all tick-by-tick data start) until May 2015. Then you have two backtests over all price data available, which are almost 2 million bars for 2 minutes.
Still, for both 2 minute systems I tested, it appears to me that they have optimized away bad positions running into the large stop loss (2 %, very big for a 2 minute system) starting from about May, 2019. In the OOS regions, the results are about 0 (spread included). Maybe the other time frames are different, I have not tested them.
What are the real results for the 2 minute systems since January, 2021 ? Do they perform positively ? Or do systems with larger time frames perform better since then ?
If you get positive results for all systems combined by the middle or end of the year, it is probably not luck, but good diversification. Time will tell.
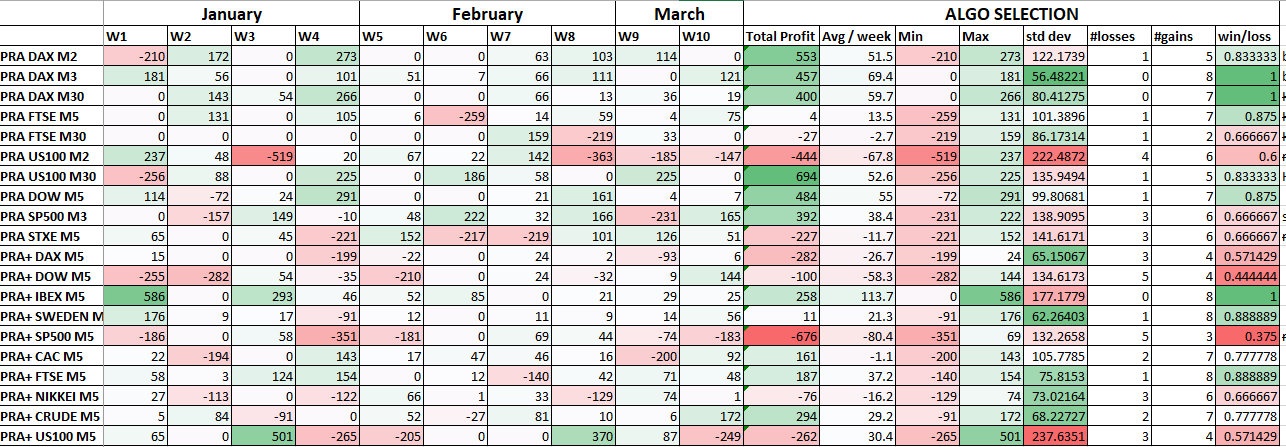
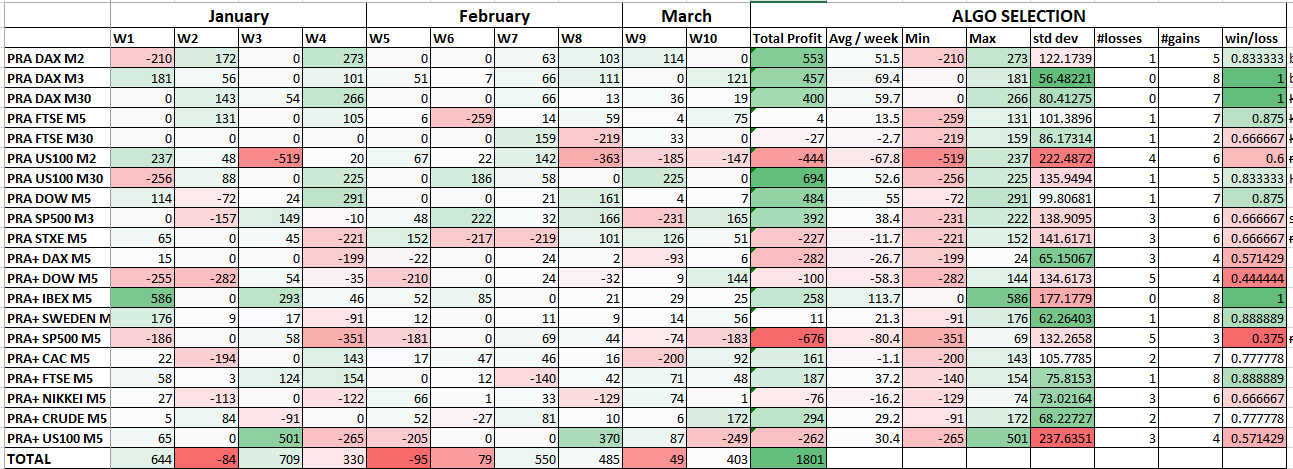
Here are the results since January 2021.
Wow that is an impressive format to present the results, excel I guess?
Thank you for sharing your analysis with us!
EDIT:
I found myself asking … were there good weeks and bad weeks overall .. so be good to add a vertical total per week, good / bad weeks may then show up?
Hi XORANDNOT
Not sure how you do testing over 2 M bars. I thought we were limited to 1 M.
To test over 2 million bars (or over all data you get from IG), you do 1 million bars first, note the starting date and then do another backtest, not by number of bars, but by custom date. For example, if 1 million bars go back to May, 2015, you do a second backtest with custom dates (not bars) starting in August, 2010 (when all tick-by-tick data start) until May 2015. Then you have two backtests over all price data available, which are almost 2 million bars for 2 minutes.
Still, for both 2 minute systems I tested, it appears to me that they have optimized away bad positions running into the large stop loss (2 %, very big for a 2 minute system) starting from about May, 2019. In the OOS regions, the results are about 0 (spread included). Maybe the other time frames are different, I have not tested them.
What are the real results for the 2 minute systems since January, 2021 ? Do they perform positively ? Or do systems with larger time frames perform better since then ?
If you get positive results for all systems combined by the middle or end of the year, it is probably not luck, but good diversification. Time will tell.
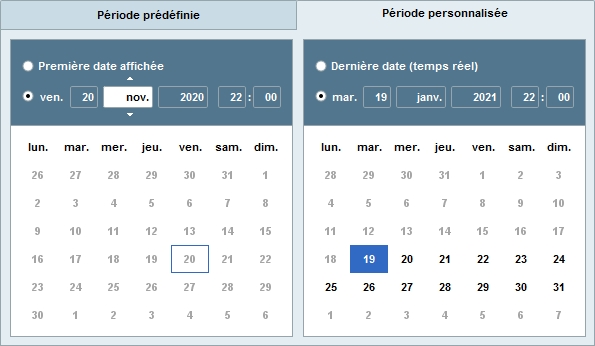
Thanks @XORANDNOT but it seems we can’t select previous period as you can see on the picture (PRT 11.1)
And how can have backtest results with 2 periods, on the same picture ?
Thanks and hae a nice day
Yes excel. Now with totals