I’m going around in circles and I’m convinced that the problem comes from the platform engine for calculating values in a loop.
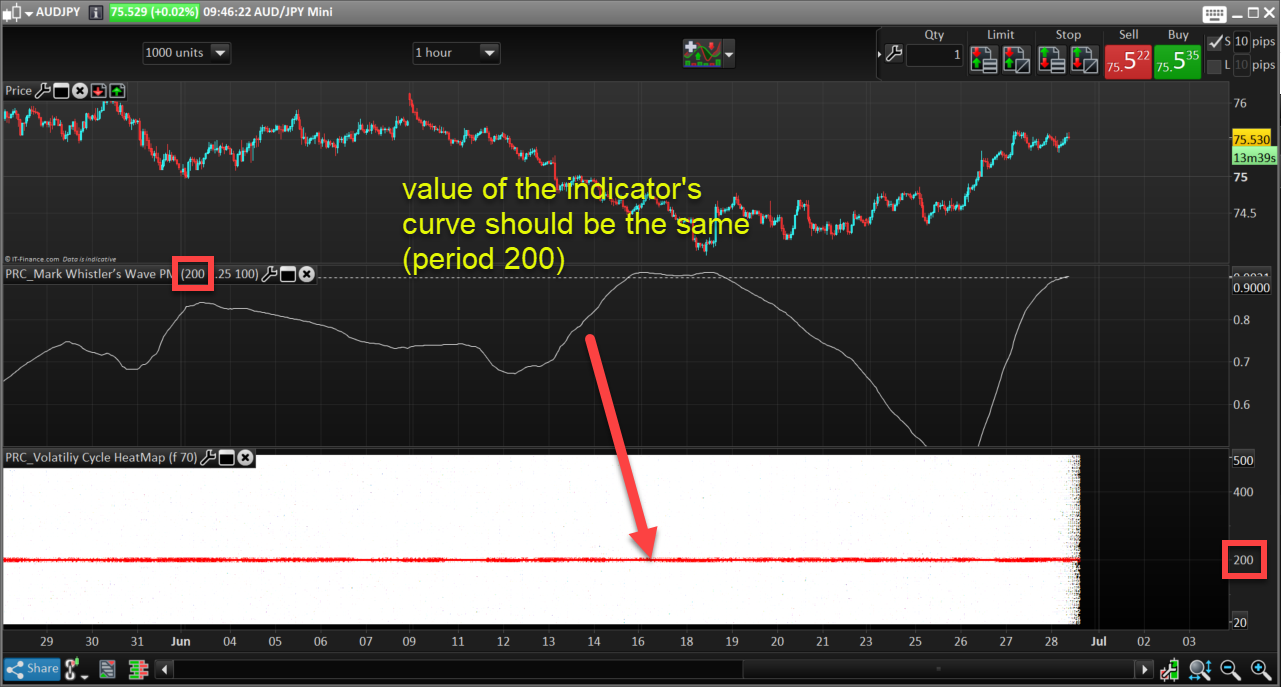
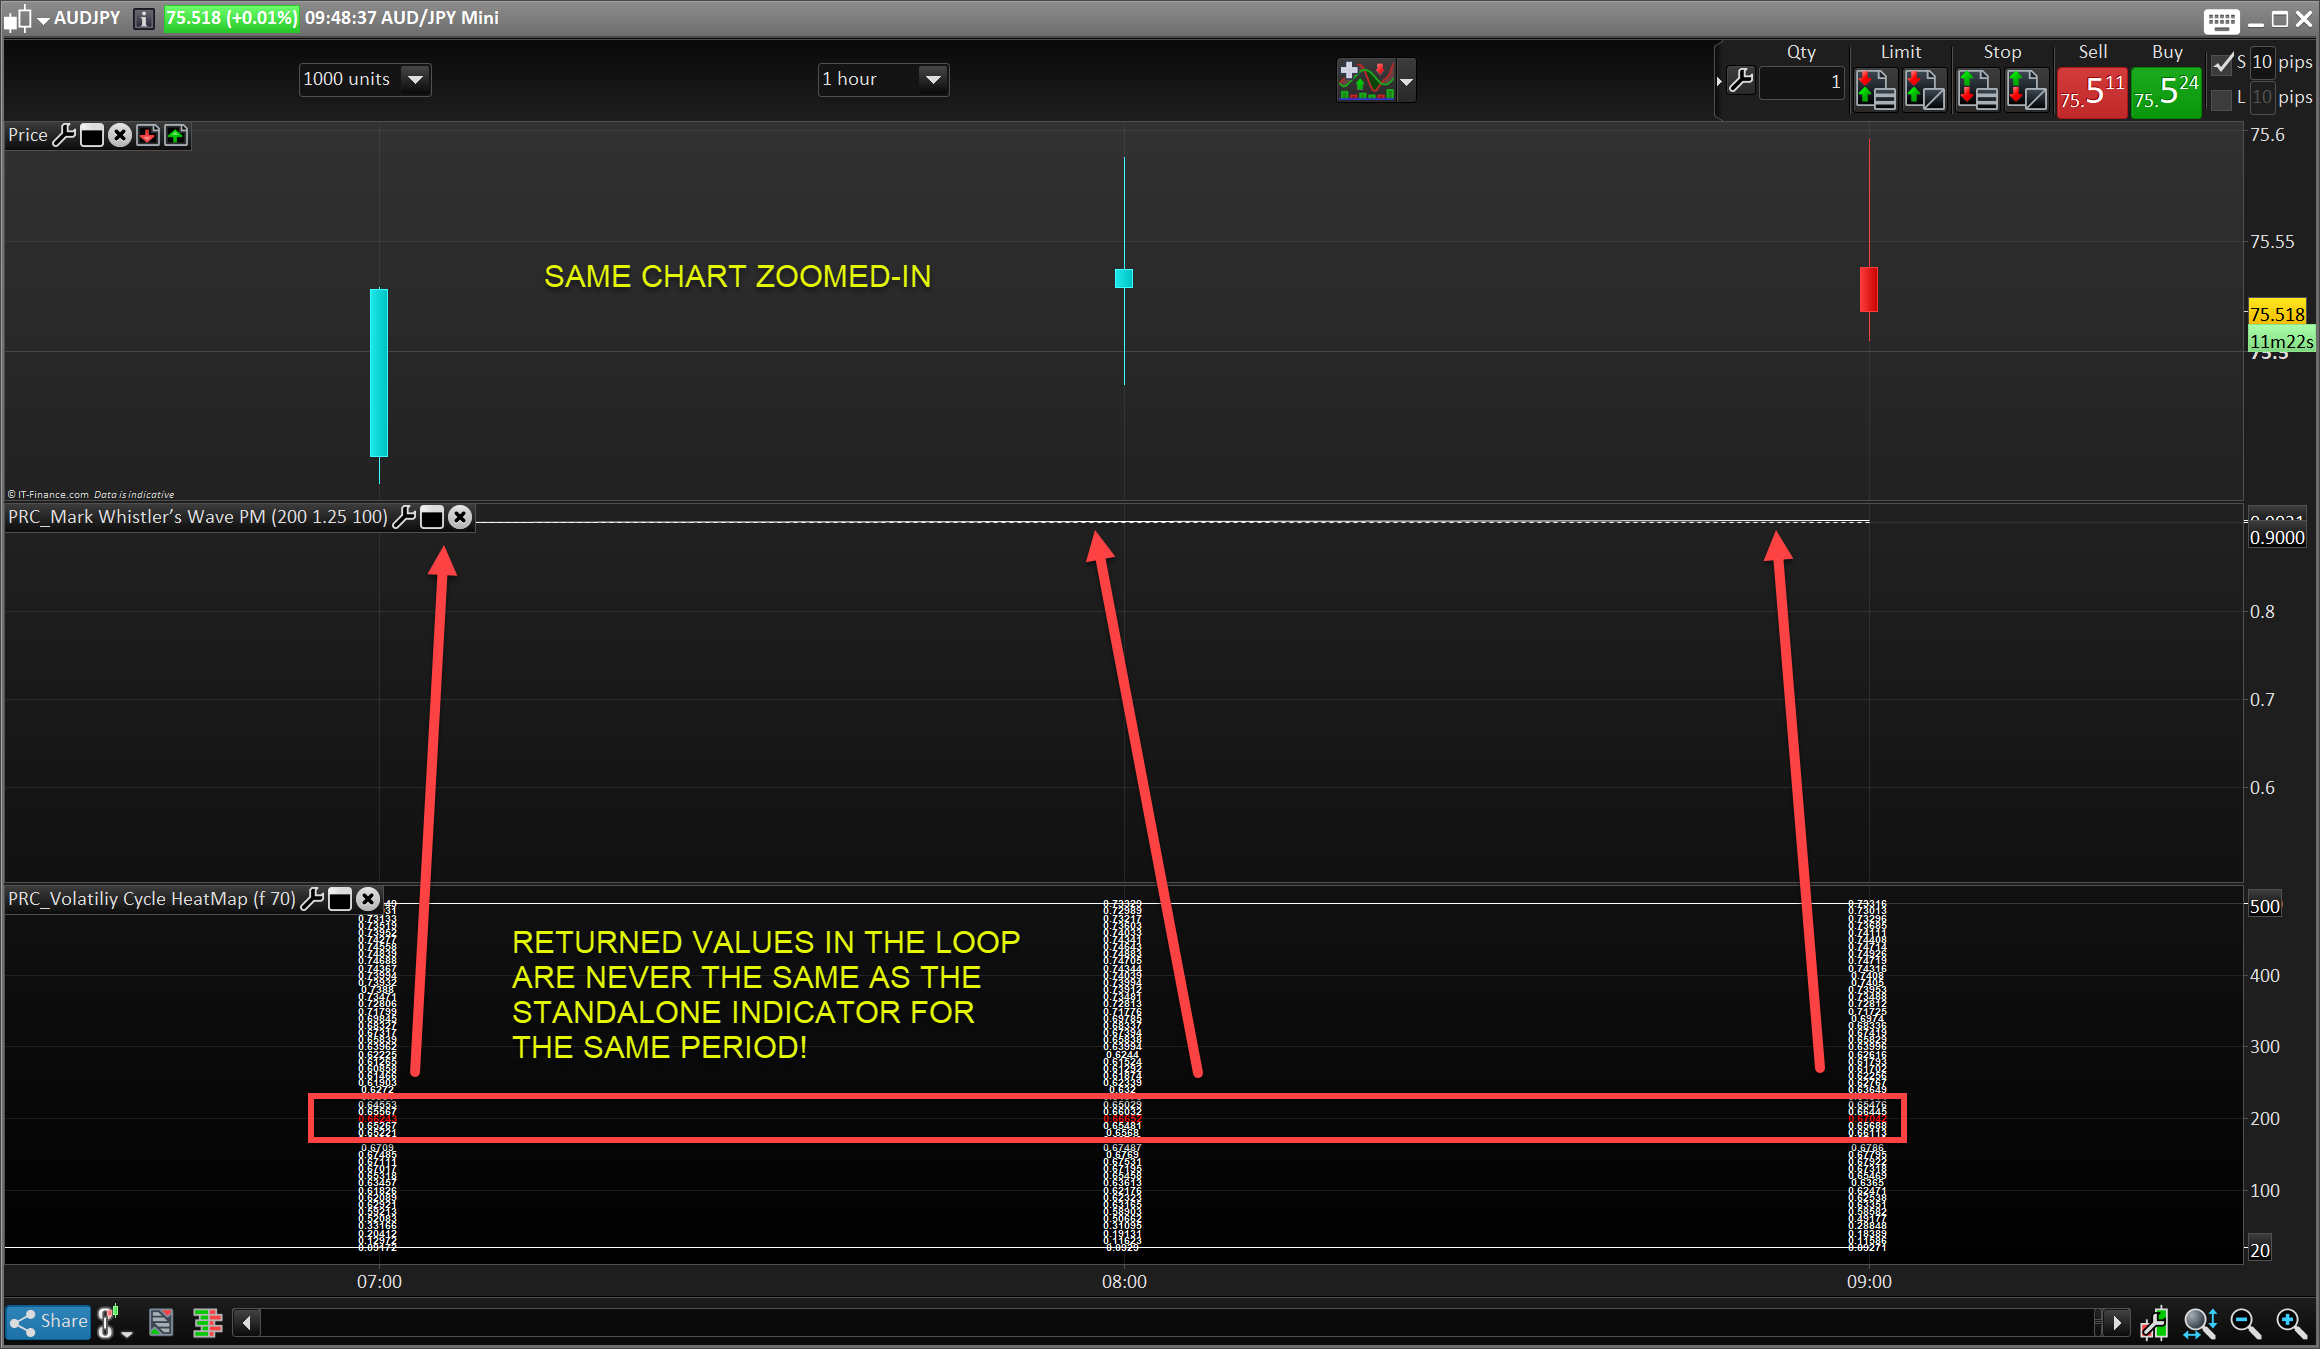
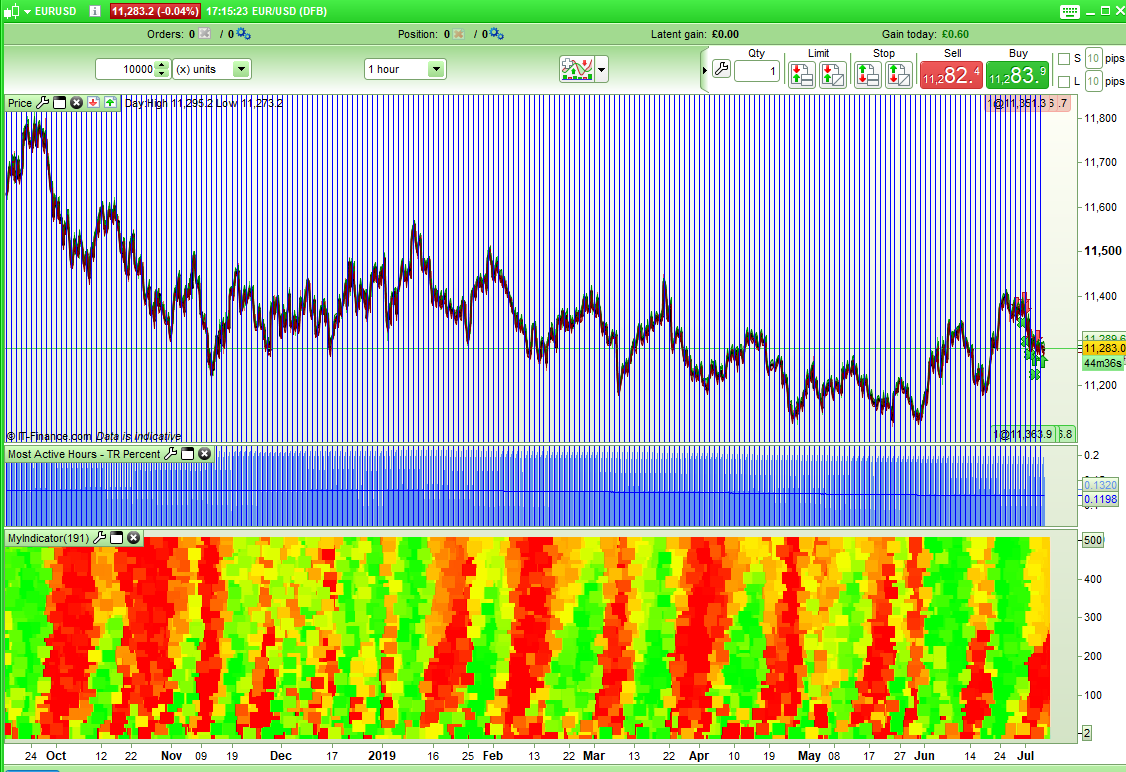
attached 2 screenshots explaining the phenomenon. The code below is the heatmap indicator that records the value of each indicator for each calculated period. I have voluntarily painted in red a period value to check (the period 200), applying the indicator “wave PM” on the graph with the same period can thus control the values returned by the loop.
We see that nothing matches. The “wave PM” indicator marks extremes beyond the value 0.90, while none of them return this type of extreme value when they are calculated inside the WHILE WEND loop. They are all well below, in orders of magnitude that have nothing to do …
In short, if someone has time to check what I wrote, I’m ready to answer questions 🙂 Thank you!
// ---
startperiod=20 //start period of the loop
maxscale=500 //end period of the loop
Step=10 //period step of the loop
BandsDeviations=1.25 //bands deviation (WAVE PM)
Chars= 100 //period of observation (WAVE PM)
// ---

psize=pointsize
BandsPeriod=startperiod //first period to test is..startperiod

while BandsPeriod<=maxscale do

 // --- wave PM indicator calculation
 Dev = std[BandsPeriod]*BandsDeviations
 Dev1 = square(Dev / psize)

 //temp=sqrt(average[chars](dev1))*pointsize
 temp=sqrt(summation[chars](dev1)/chars)*psize
 if temp<>0 then
  temp=dev/temp
 endif

 if(temp>0) then
  iexp=Exp(-2*temp)
  returnNum= (1-iexp)/(1+iexp)
  osc= (returnNum)
 else
  iexp=Exp(2*temp)
  returnNum=(iexp-1)/(1+iexp)
  osc= (returnNum)
 endif

 // -----

 result=osc

 r=0
 if bandsperiod=200 then
  r=255
 endif

 drawtext("#result#",barindex,BandsPeriod,dialog,bold,10)coloured(r,0,0)

 BandsPeriod=max(startperiod,BandsPeriod+Step) //increase indicator period for next loop iteration
wend

return startperiod,maxscale
Just made a quick test with a RSI instead of the wave PM code and the results match perfectly.. There must be something wrong in the wave PM code when it is parsed in the loop..
// ---
startperiod=20 //start period of the loop
maxscale=500 //end period of the loop
Step=10 //period step of the loop
// ---

BandsPeriod=startperiod //first period to test is..startperiod

while BandsPeriod<=maxscale do

// --- wave PM indicator calculation
osc = rsi[bandsperiod]
// -----

result=osc

r=0
if bandsperiod=50 then
r=255
endif

drawtext("#result#",barindex,BandsPeriod,dialog,bold,10)coloured(r,0,0)

BandsPeriod=max(startperiod,BandsPeriod+Step) //increase indicator period for next loop iteration
wend

return startperiod,maxscale
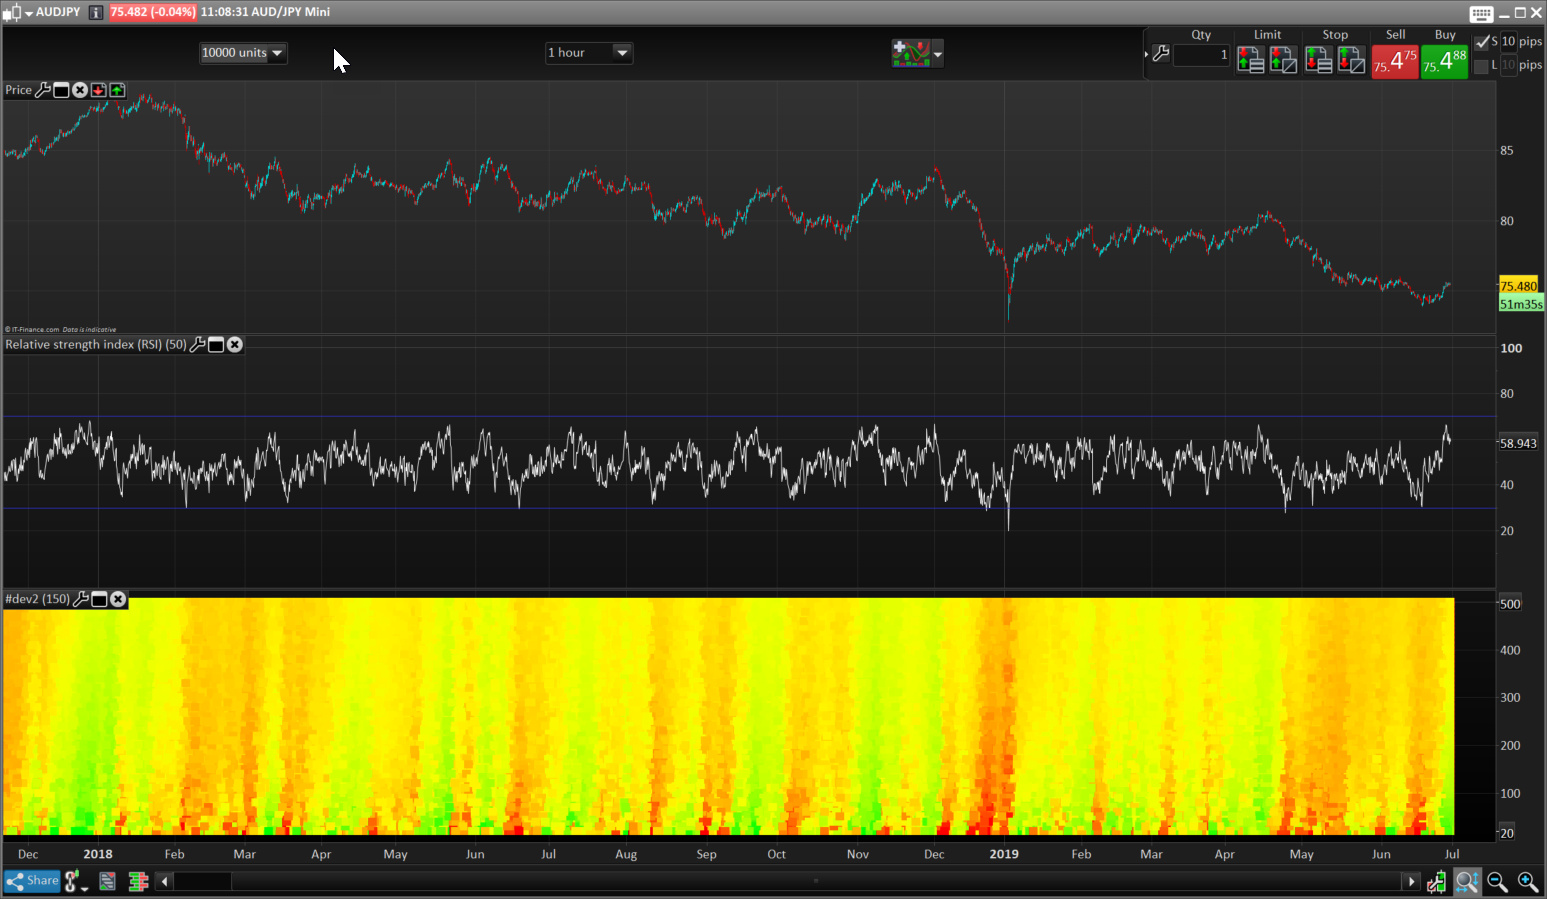
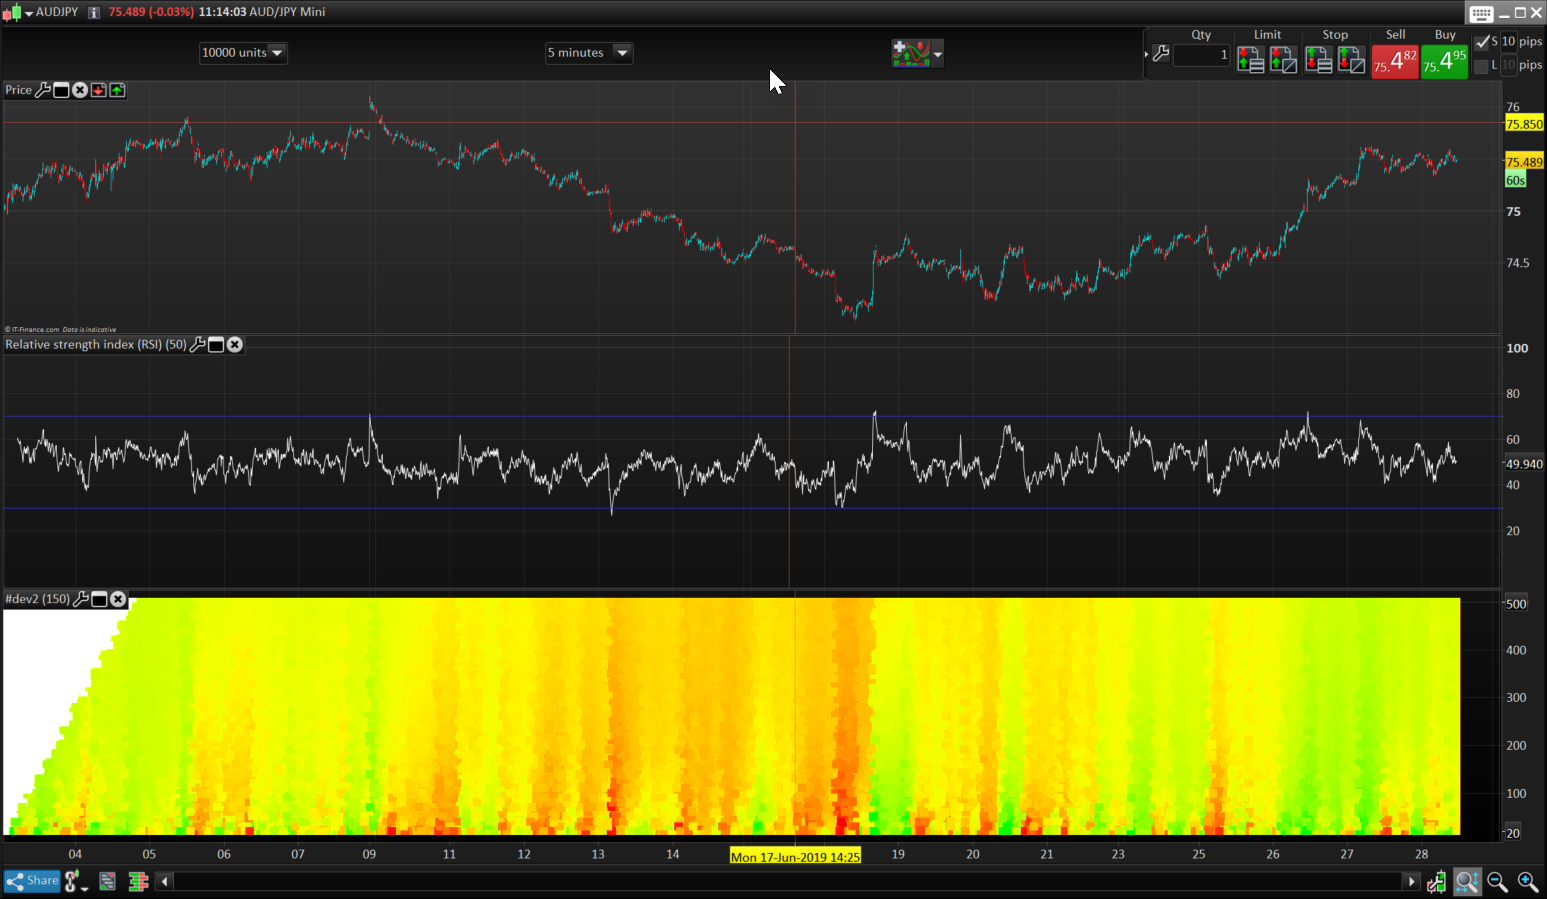
For people enjoying color on their charts.. RSI heatmap is working fine.
Colors shade from red (oversold) to green (overbought) from period 20 to 500 on a 1-hour and 5-minutes charts. Not the subject of that topic, but information are valuable IMO. Trend following or mean reversion valuable infos in that heatmap.
I posted the RSI heatmap in the library, here: RSI MultiPeriods HeatMap
Now, let’s come back to the original subject.. 😳
To continue my monologue and for the records. The problem is located in the average of the standard deviation realized in the loop. With the AVERAGE statement or a sum of the STD divided by the period amount, the result is the same = wrong values.
I made a report to PRT.
Insane work Nicolas, thanks alot. Lets hope PRT replies within this year then hehe
You can make very pretty pictures if you take an average or RSI and Stochastic combined.
//PRC_RSI and Stochastic multiperiods HeatMap | indicator
//Plot an heatmap of the RSI range of periods
//04.07.2019

// --- settings
startperiod=2 //start period of the loop
maxscale=500 //end period of the loop
Step=10 //period step of the loop
// --- end of settings

iPeriod=startperiod //first period to test is..startperiod

while iPeriod<=maxscale do

// --- indicator calculation
osc = (stochastic[iperiod,5] + rsi[iperiod])/2
// -----

result=osc

R = max(0,50+(200-(result-50)*12))
G = max(0,50+(200+(result-50)*12))

drawtext("■",barindex,iperiod,dialog,bold,18) coloured(min(r,255),min(g,255),0)

iPeriod=max(startperiod,iPeriod+Step) //increase indicator period for next loop iteration
wend

return startperiod,maxscale
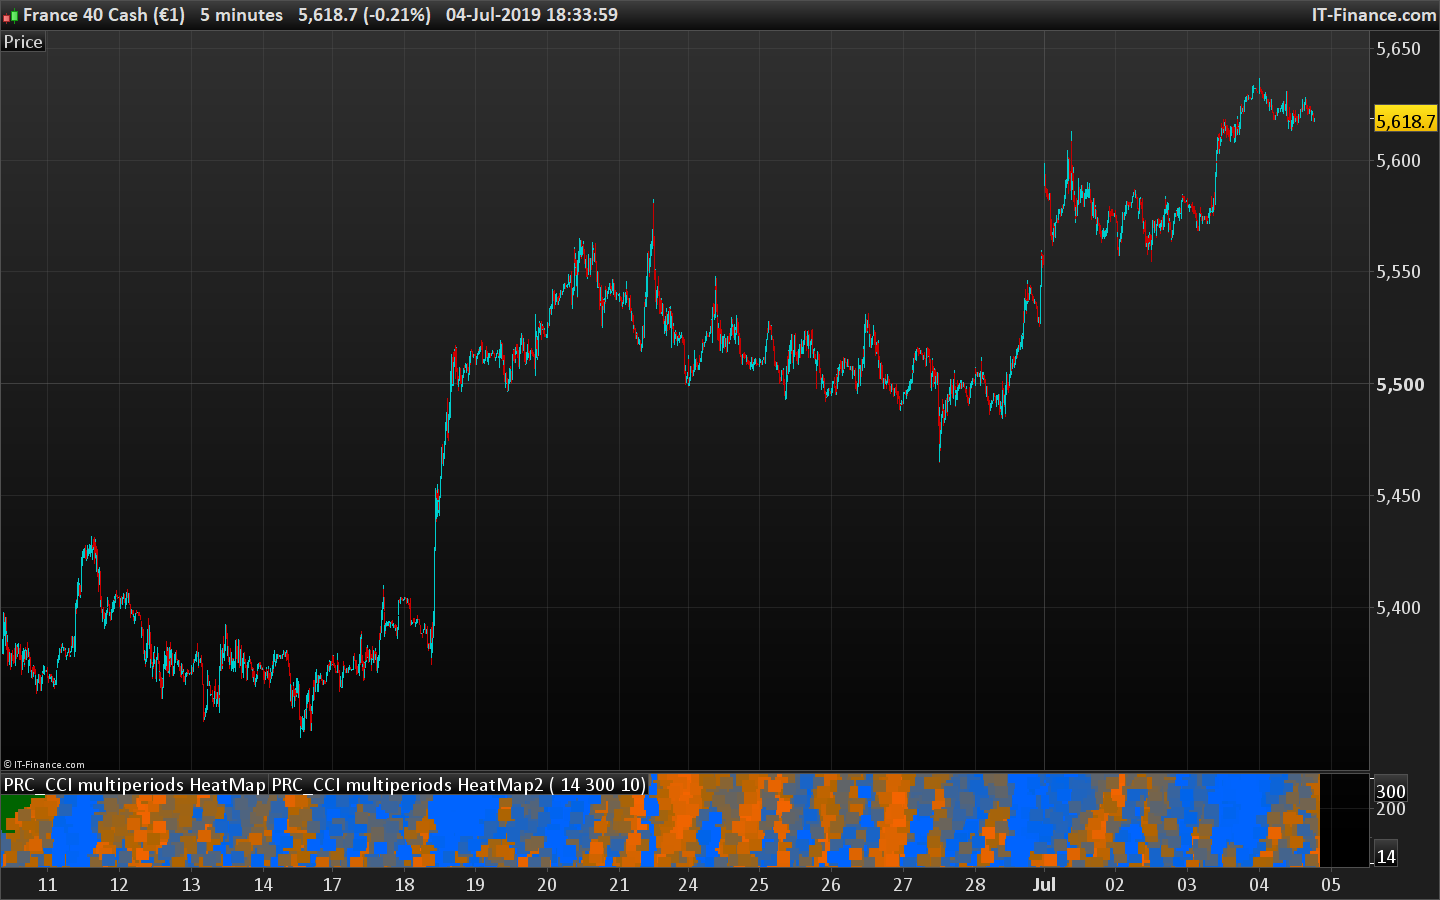
As requested, here is another pretty picture but with only a stochastic.
//PRC_CCI multiperiods HeatMap | indicator
//Plot an heatmap of the CCI range of periods
//04.07.2019
//Nicolas @ www.prorealcode.com
//Sharing ProRealTime knowledge

// --- settings
startperiod=14 //start period of the loop
maxscale=500 //end period of the loop
Step=10 //period step of the loop
// --- end of settings

iPeriod=startperiod //first period to test is..startperiod

while iPeriod<=maxscale do

// --- indicator calculation
osc = stochastic[iperiod,3](close)//cci[iperiod]
// -----

//R = max(0,50-osc)
//G = max(0,50+osc)
R =max(0,50+(50-(osc-50)*3))
G = 100//max(0,50+(50+(osc-50)*3))
B = max(0,50+(50+(osc-50)*4))

drawtext("■",barindex,iperiod,dialog,bold,18) coloured(min(r,255),min(g,255),min(b,255))

iPeriod=max(startperiod,iPeriod+Step) //increase indicator period for next loop iteration
wend

return startperiod,maxscale
We are now far from the original topic. 😳
Anyway, I had confirmation today that the average of the ATR is the problem (the average take the last calculated data and not the one of the period calculated dynamically in the loop..). Waiting for a fix.
Glad to hear that there is a fix in the pipeline so that you can finish this indicator and add it to the library.
Even if it turns out not to be a useful trading tool at least it will be very colourful which is what we all want in an indicator!
I studied the theory behind the colors and found it useful 😆
(private joke if anyone wonder).
Hi,
Has this problem been resolved yet. Sure would like to see the 3D version of this indicator.
Thank you.
I do not think so, but I’m currently investigating in version 11..
Has somebody eventually checked how to signal when ever period is full green or full red?
I played around this idea but the only event I want to take out I’m unable to code it…
@denmar
Still not unable to do it in v11, but the variables array support to come should be very helpful to make it possible.
@AlexF
Which indicator please? There are several in this topic!
Thanks for update Nicholas…unfortunately I am still restricted to v 10 here in South Africa.