Alco
AlcoParticipant
Senior
Hi Kasper,
It did open a trade at 11188.3 on my demo account.
Hi guys,
great system Reiner, thank you.
Going live today, fingers crossed..
Hello Kasper,
I can confirm a short position @ 11189…
Chao, William
Short since 17 pm at 11190.3.
Regards, David
 Mark
MarkParticipant
Senior
Reiner,
Just want to check two points with you regarding the seasonal multiplier,
ONCE January1 = 3
ONCE January2 = 0
ONCE February1 = 3
ONCE February2 = 3
ONCE March1 = 3
ONCE March2 = 2
ONCE April1 = 1
ONCE April2 = 3
ONCE May1 = 1
ONCE May2 = 1
ONCE June1 = 2
ONCE June2 = 2
ONCE July1 = 3
ONCE July2 = 1
ONCE August1 = 1
ONCE August2 = 1
ONCE September1 = 3
ONCE September2 = 0
ONCE October1 = 3
ONCE October2 = 2
ONCE November1 = 1
ONCE November2 = 3
ONCE December1 = 3
ONCE December2 = 2
if the parameter is 0 does this mean no trade will ever be made during that period?
Also im live with V6 and a short trade opened last night at 11189.8, however it only opened 1 position, why was it not 3 as per the multiplier?
Mark
 arke
arkeParticipant
Average
Hi Mark,
I think thats because your capital in the code is too low, so that max Position size is lower than 3
Armin
Hi Mark,
Yes, parameter 0 does mean: no trade will ever be made during that period. During yesterdays consolidation signalline crossed under daily low and generate a short signal. Pathfinder traded only 1 contract because shorts won’t boost in December due historical there isn’t a short saisonality in that month. The V6 multiplier setup will boost only long signals.
I guess that will be probably a looser trade – we will see.
best, Reiner
arkeParticipant
Average
Strange… DAX Pathfinder 4H V6 opened up a short Position yesterday at 11190 and DAX Pathfinder 1H V1 opened up a Long Position today at 11287.4…
Maybe not, TSI is going down + price touching higher billinger band….
 Pere
PereParticipant
Veteran
Hi Reiner.
I am following in demo the last short trade on 12/12 of Pathfinder V6 in any extension, and I see (like you) that perhaps it will close with losses (or not, but this is not so important).
What I can see is that the input signal was done because signalline crossed down the daily low, but I think that this is not the real daily low of the previous trading day, as you explained somewhere months ago. As everybody knows, DAX (CFD on IG Markets) closes on Friday night and opens again on Monday morning, but this Monday morning starts on 00:00 hours, which also means 12:00 PM of Sunday.
The way you calculate the Daily highs and lows gives them on Monday from Sunday, instead of the last Friday. If the calculation of these highs and lows would be made taking into account the values of last Friday, this trade would not be made, avoiding possible losses.
The code you can use can be, for example:
a1=OpenDayOfWeek
b1=DHigh(1)
b2=DHigh(2)
c1=DLow(1)
c2=DLow(2)
d1=DClose(1)
d2=DClose(2)

IF a1=1 THEN
b1=b2
c1=c2
d1=d2

ELSE
b1=b1
c1=c1
d1=d1

ENDIF
Update on the Money management: I played around with the code, I think I discovered that we are not only risking 5% of equity, but as much as 63% at one time, so of cause I’d like to ask people to verify my findings.
Reiner, I think we talked about it before a few month back? I just want us to know how much exactly we are risking- and I might be wrong here 🙂
Simplified: I assume that the max risk is from %LOSS and is calculated by the (total-number-of-points-we-are-risking)/equity*100
So lets find the total total-number-of-points-we-are-risking
..this is where I might be wrong so please comment. 🙂
Please add:
note:apparently the Graph instruction does not support the ABS function- so when short there is a -risk- which is of cause not true. disregard the negative numbers
graph (((tradeprice-(tradeprice-(tradeprice*(stoploss/100))))*COUNTOFPOSITION*pipsize*pointvalue)/(equity))*100 COLOURED(0,0,255) AS "MAXRISK"//blue
Then I came up with a positionsizing code- some how more conservative- however that also shows on the profit. I started with a capital of 100000- max risk around 12%
ONCE positionSize = 1

Capital = 100000
Risk = 5 // in %
equity = Capital + StrategyProfit
maxRisk = round(equity * Risk / 100)

ONCE stopLossLong = 5.5 // in %
ONCE stopLossShort = 3.25 // in %
ONCE takeProfitLong = 3.25 // in %
ONCE takeProfitShort = 3.25 // in %
reinvest =1
if reinvest then
positionSize=max(round((equity+Capital)/capital),1)
maxPositionSizeLong = MAX(625, abs(round(maxRisk / (close * stopLossLong / 100) / PointValue) * pipsize))
maxPositionSizeShort = MAX(625, abs(round(maxRisk / (close * stopLossShort / 100) / PointValue) * pipsize))
else
positionSize=1
maxPositionSizeLong = MAX(15, abs(round(maxRisk / (close * stopLossLong / 100) / PointValue) * pipsize))
maxPositionSizeShort = MAX(15, abs(round(maxRisk / (close * stopLossShort / 100) / PointValue) * pipsize))
Endif
cheers Kasper
Hi Petrus,
we discussed this point here in the forum. Pathfinder consider sunday data if available (e.g. DAX, FTSE, DOW) and this is a benefit and not a lack. When you analyse which weekday is the most profitable one you will find ou that it is the Monday. There are several reasons for that well known statistical anomaly and IG sunday quotes bosst this efect. I give you an example of a simple system I have developed that trade monday morning gap compared to the last sunday/friday candle
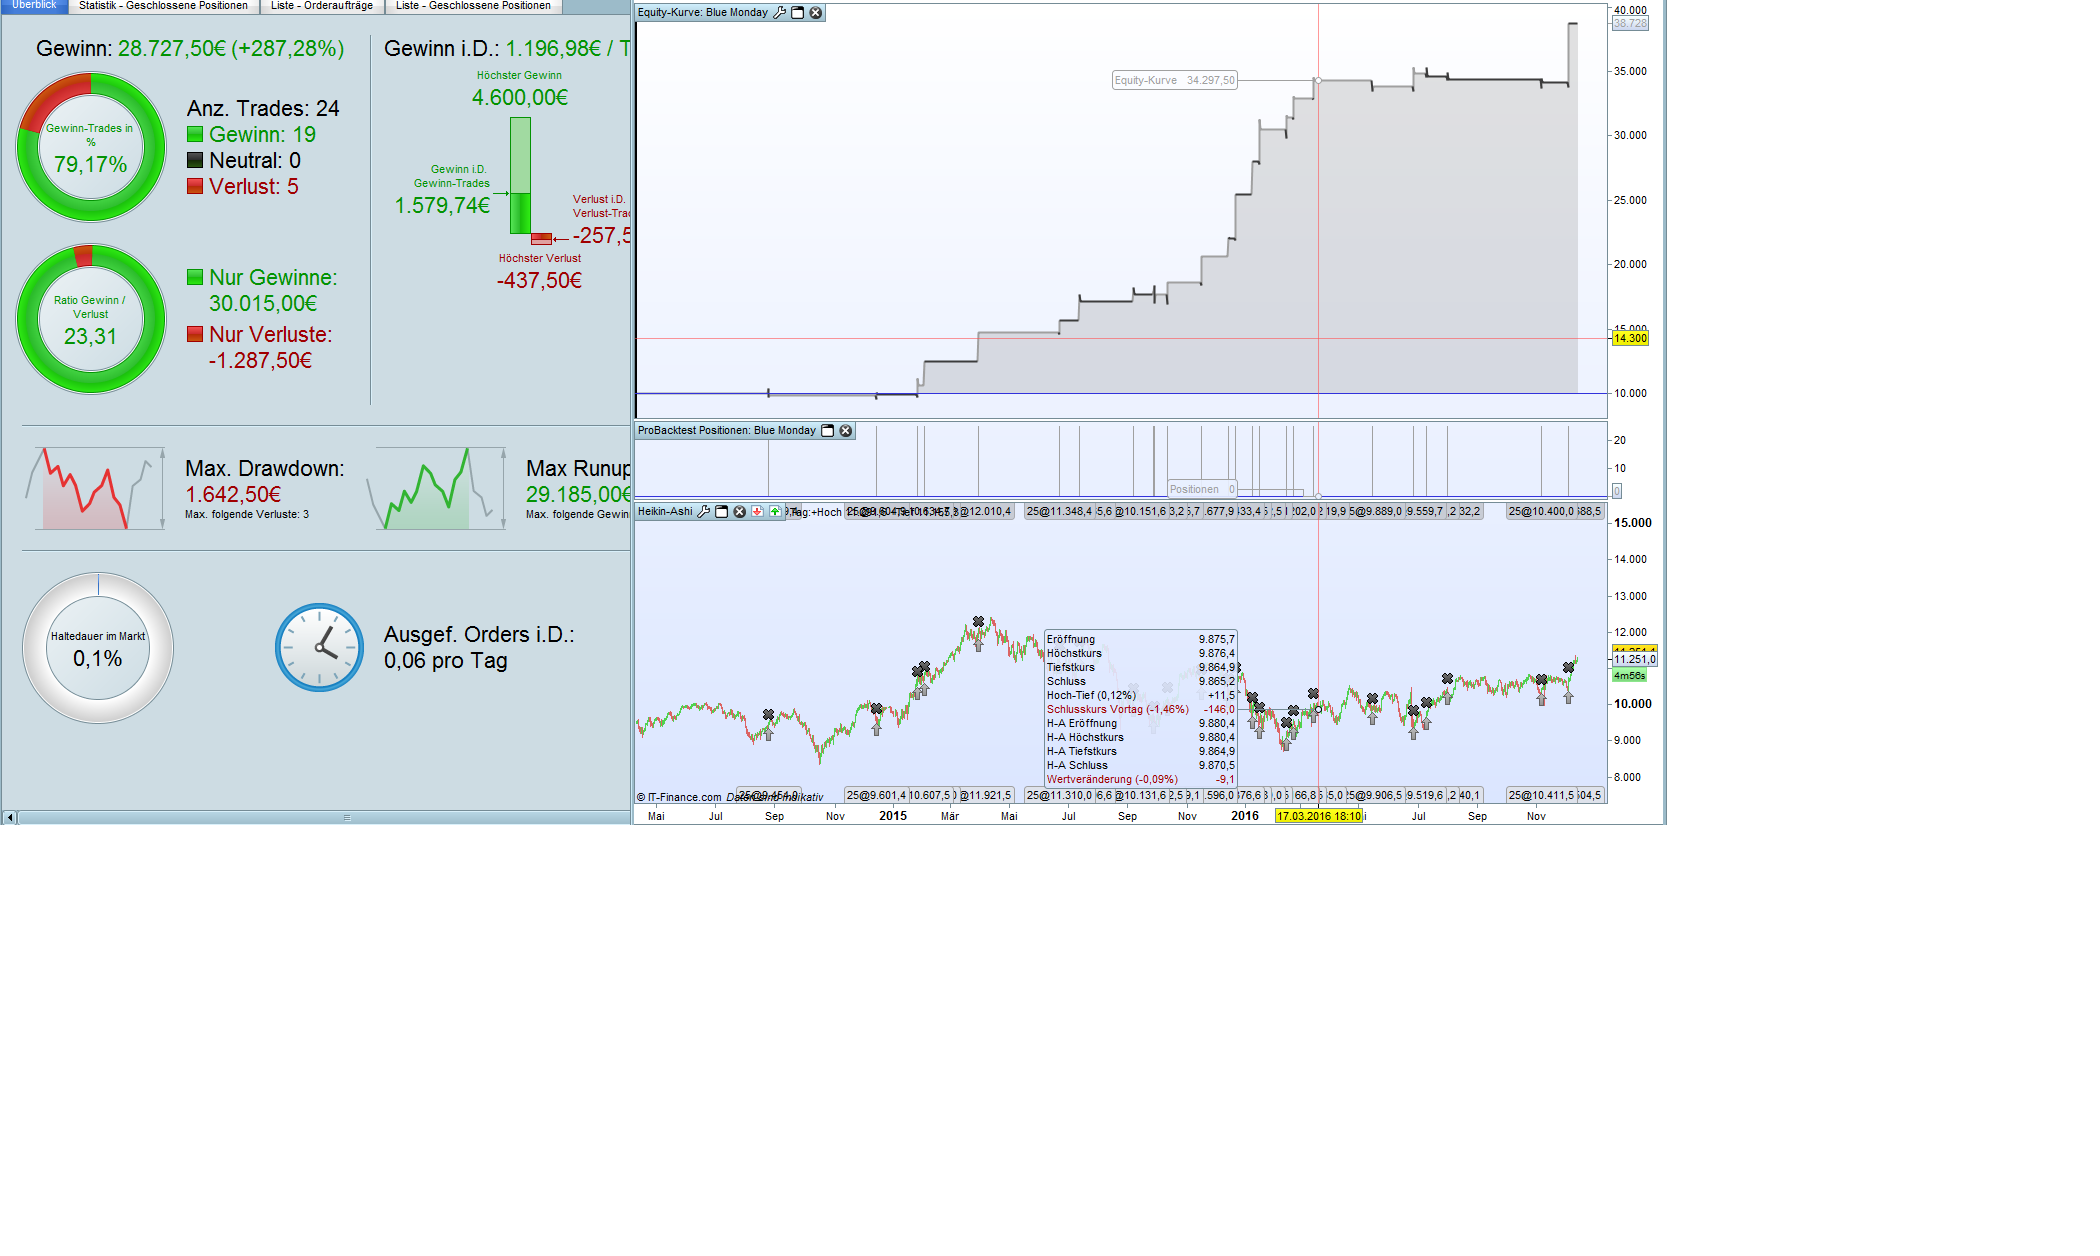
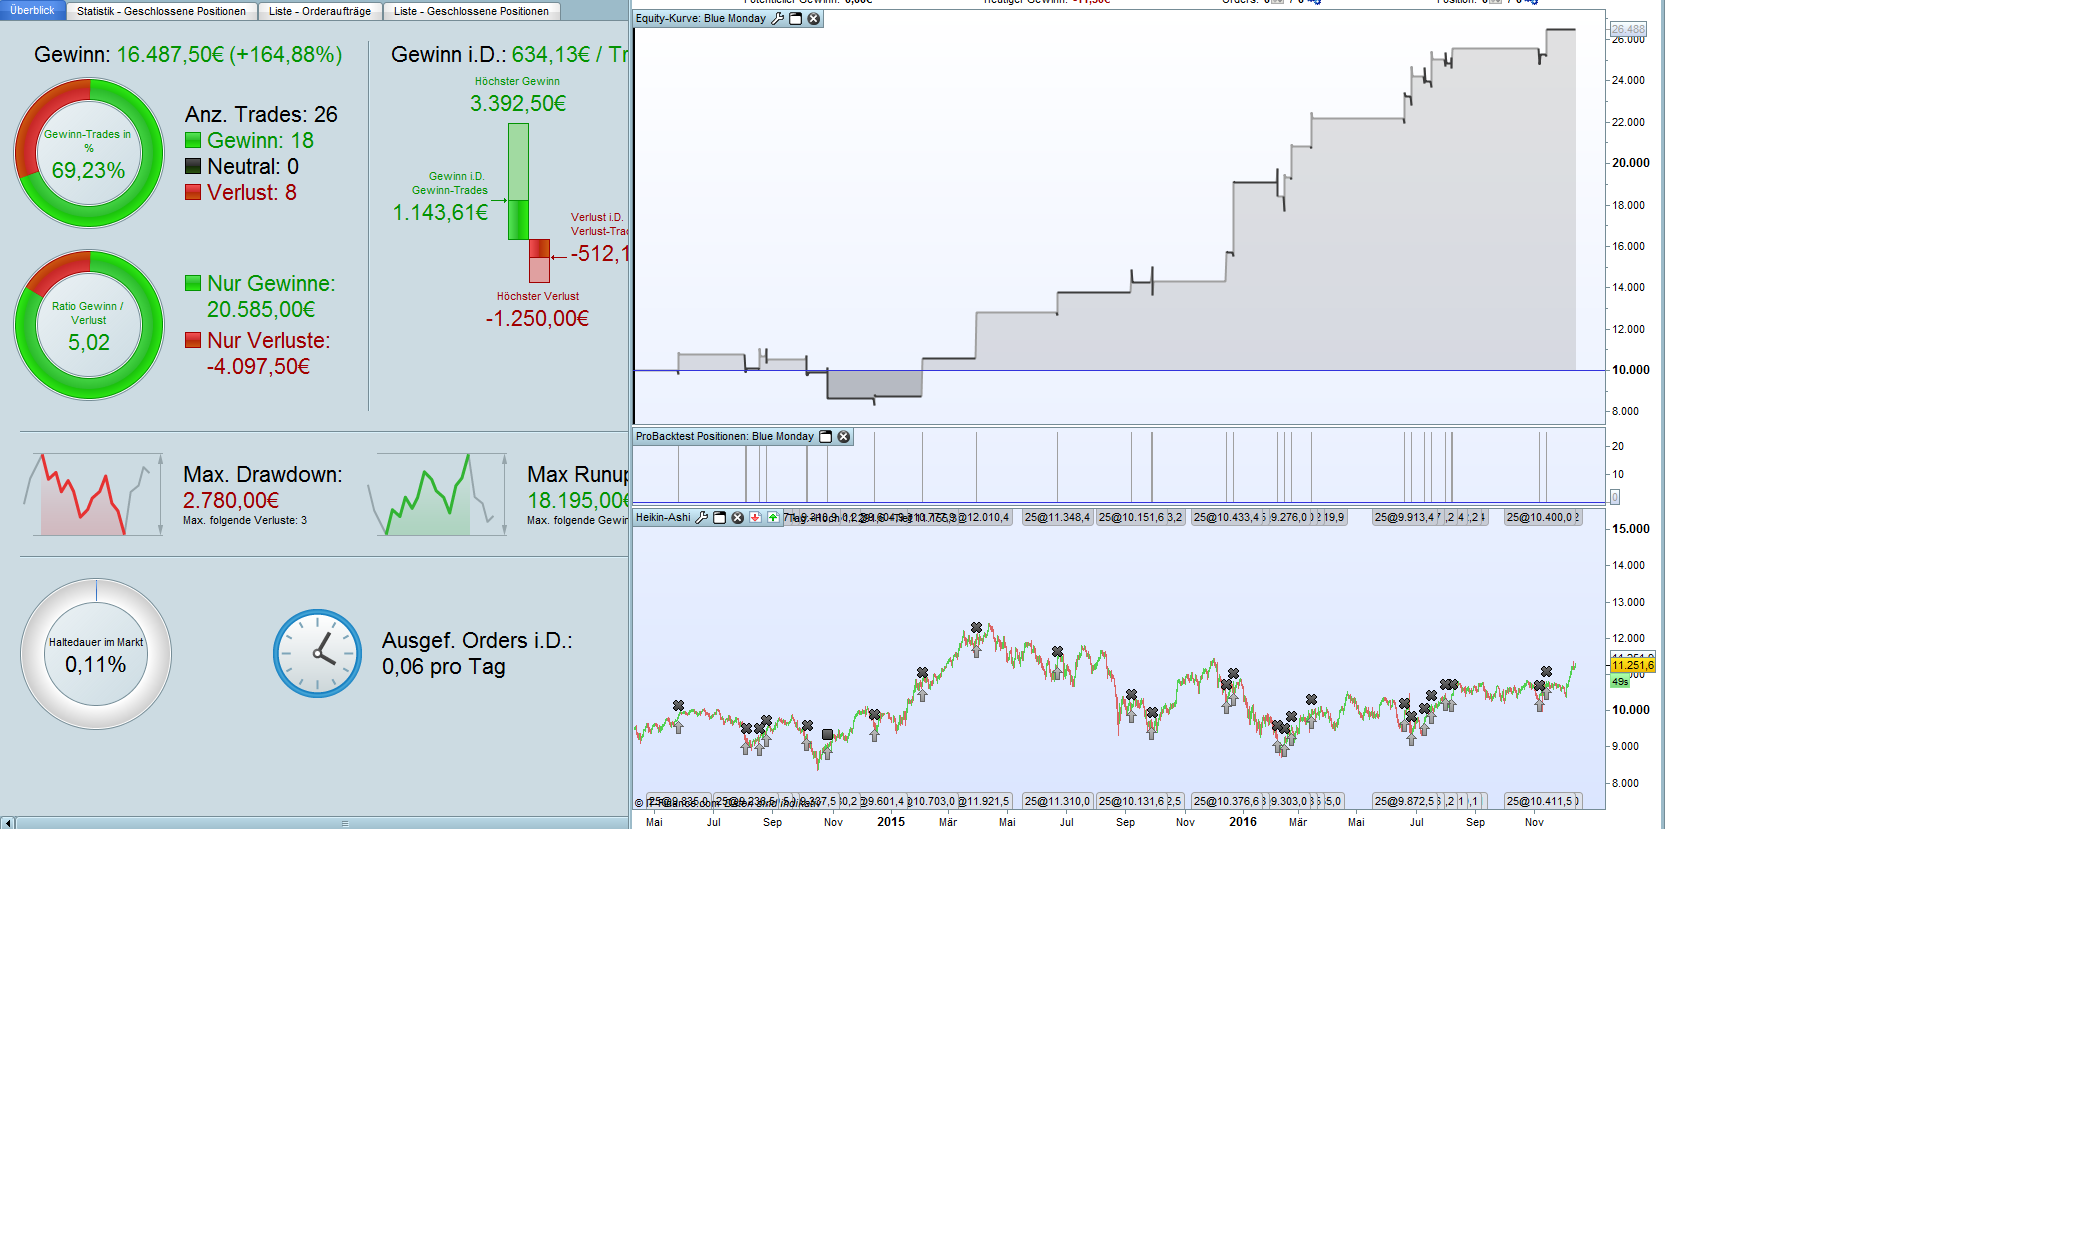
// Blue Monday DAX

// Code-Parameter
DEFPARAM FlatAfter = 093500

// trading window
ONCE BuyTime = 85500
ONCE SellTime = 93500

ONCE CloseDiff = 50

ONCE PositionSize = 25
ONCE sl = 50

// Long all in, if it's Monday and the market is 50 points higher
IF Not LongOnMarket AND Time = BuyTime AND (CurrentDayOfWeek = 1) THEN
Diff = close - DClose(1) // with Sunday quotes
//Diff = close - DClose(2) // without Sunday quotes
IF Diff > CloseDiff THEN
BUY PositionSize CONTRACT AT MARKET
ENDIF
ENDIF

// exit position
IF LongOnMarket AND Time = SellTime THEN
SELL AT MARKET
ENDIF

// stop
SET STOP pLOSS sl
best, Reiner
Hi Joachim and welcome,
I didn’t test the system with 15M or 5M so far. My expierences with a higher timeframe such 4H is that it delivers better signals because longer timeframe works like a filter. The time filters all the noise and especialliy the fake breakouts and we get more high quality signals that the system e.g. can boost in combination with a saisonal patter.
Pathfinder focused on 4H and 1H. 15M or 5M I would trade other things such as daily breakout of the first hour.
best, Reiner
Update V2 on Money management- It might not be as bad as I first assumed- thank god 😀
I came to see the NewSL by which you implemented a trailingstop. I think we need take this into consideration when looking at risk. When trailing the SL we also limmit our risk- actually when breakeven and newsl is used- risk are at 0% so the before consideration is not entirely accurate. I just haven’t found out how to graph it or look at it to get a real sense of what we are risking.
Any suggestions is welcome:-)
Cheers Kasper
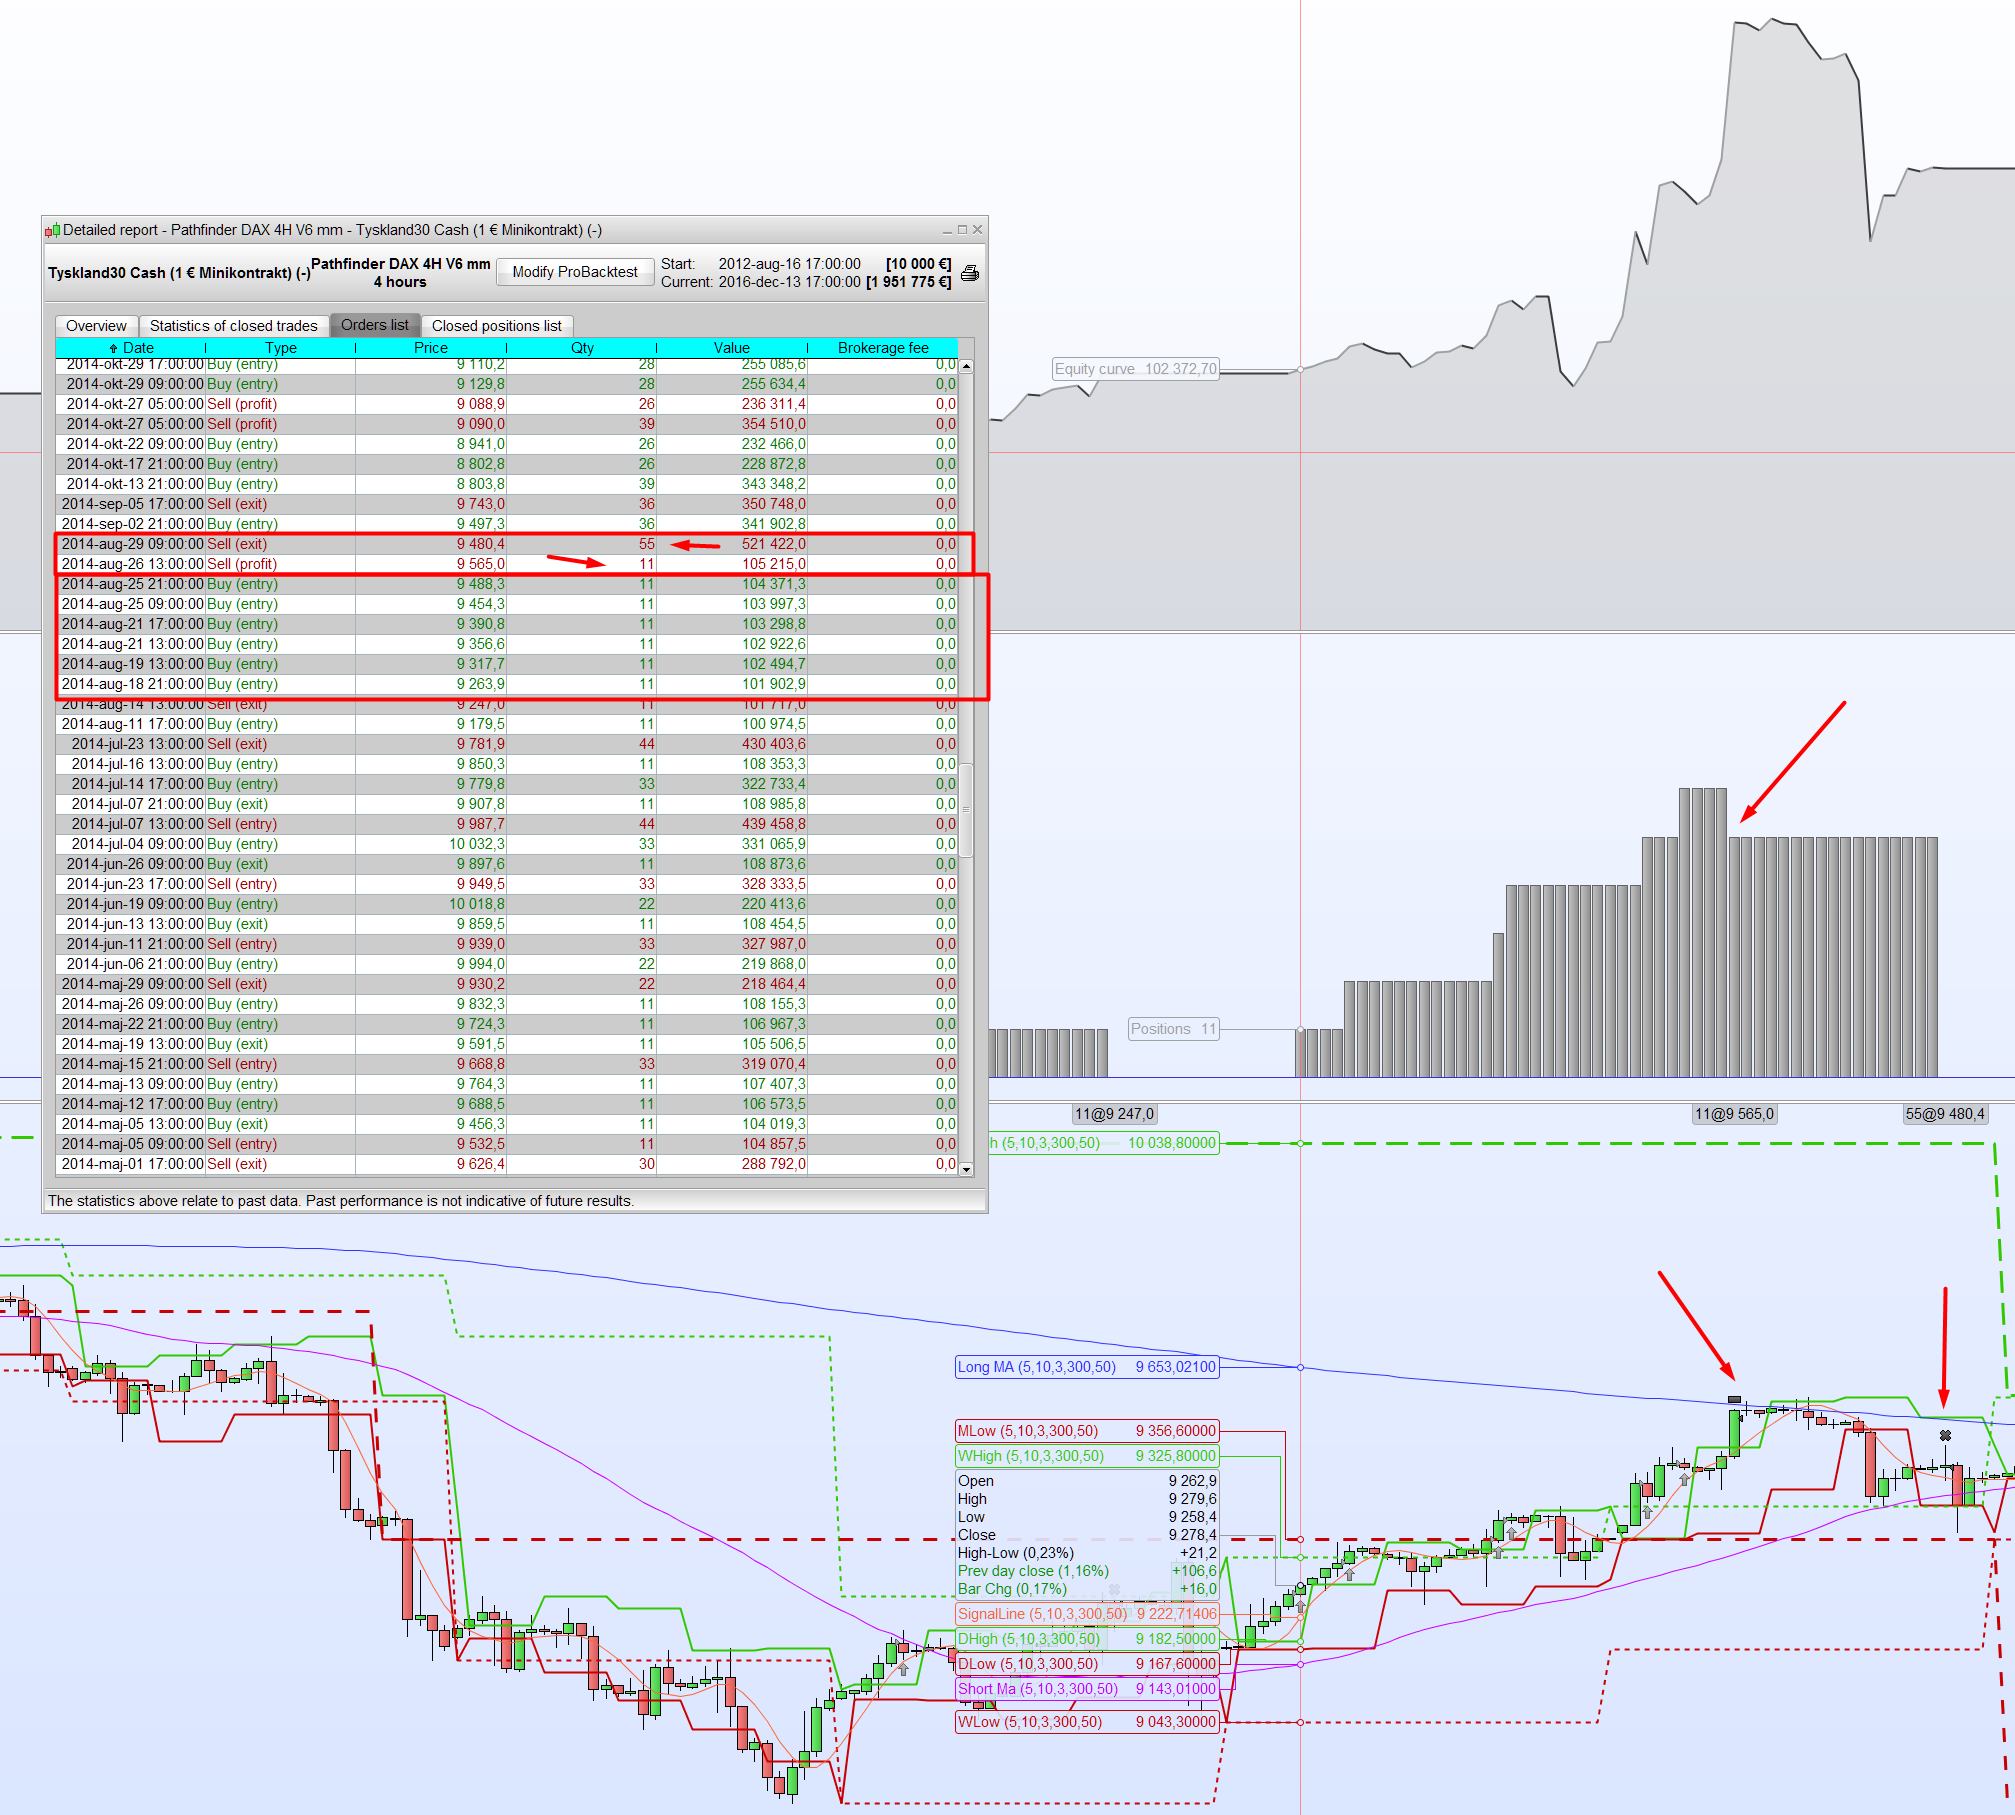
Now when looking in details I noted a strange behaviour when back testing that would lead to false results. I see partial closing of positions. In live trading partiality closing of positions is not possible in proorder, so did anyone encounter this -or is there something that I missed?
In the screendumb you can see trades is opened with 11 positions @2014-aug-18 21:00, accumulated 6 times. Take profit is reached aug 26th 13:00 but only closes 11 positions, the remaining 55 is exited aug 29th 09:00
isn’t that strange?
Cheers Kasper