Hey Reiner,
so did you change the code for the calculation of the monthy low/high from
If Month <> Month[1] then
to
If Month[1] <> Month[2] then
If I change it the drawdown is a bit worse, but it wouldn´t make any sense to keep it that way if this is not the proper execution of the strategy.
Thank you
regards, flo
Hi Flo,
I didn’t change the monthly calculation because in the strategy the levels were always correct. Only the displayed indicator value for monthlyLow was wrong.
best, Reiner
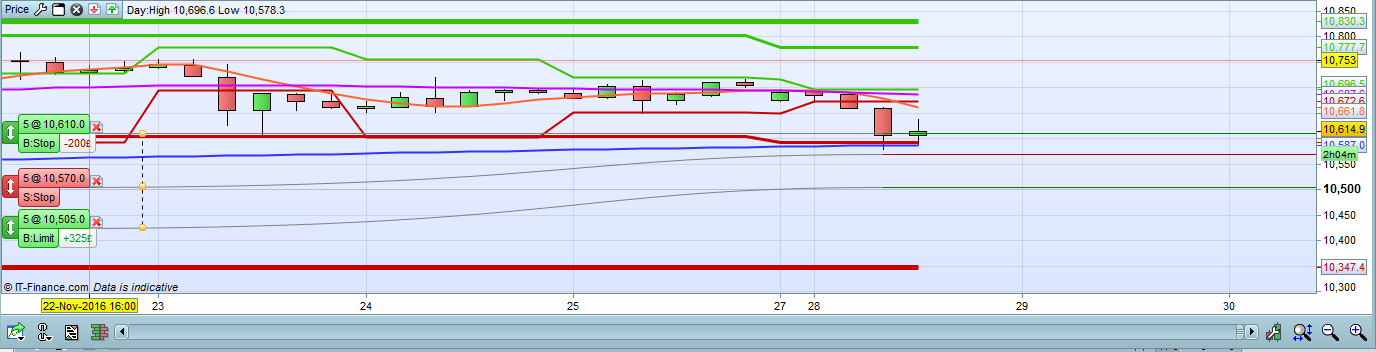
Apologies if I’ve missed something here but weekly low was missing so I’ve added that and some colours. We can’t add width within the code so I have adjusted those manually…
I currently have it setup like this. Does it look correct?
EDIT: Just seen that weekly low is commented out of the latest code so this needs adjustment…
// Pathfinder Indicatror based on ProRealTime 10.2
// Breakout system triggered by previous daily, weekly and monthly high/low crossings with smart position management
// Instrument: Index mini 4H, 9-21 CET, 2 points spread, account size 10.000 Euro
// Version 1.1 fixed problem on montly low/high with last month day values
// Version 1.0 extracted code from Pathfinder strategy

// calculate daily high/low
dailyHigh = DHigh(1)
dailyLow = DLow(1)

// calculate weekly high/low
If DayOfWeek < DayOfWeek[1] then
weeklyHigh = Highest[BarIndex - lastWeekBarIndex](dailyHigh)
weeklyLow = Lowest[BarIndex - lastWeekBarIndex](dailyLow)
lastWeekBarIndex = BarIndex
ENDIF

// calculate monthly high/low
If Month[1] <> Month[2] then
monthlyHigh = Highest[BarIndex - lastMonthBarIndex](dailyHigh)
monthlyLow = Lowest[BarIndex - lastMonthBarIndex](dailyLow)
lastMonthBarIndex = BarIndex
ENDIF

// calculate instrument signalline with multiple smoothed averages
firstMA = WilderAverage[periodFirstMA](close)
secondMA = TimeSeriesAverage[periodSecondMA](firstMA)
signalline = TimeSeriesAverage[periodThirdMA](secondMA)

longMA = Average[periodLongMA](close)
shortMA = Average[periodShortMA](close)

return dailyHigh COLOURED(50,200,0) as "DHigh", dailyLow COLOURED(200,0,0) as "DLow", weeklyHigh COLOURED(50,200,0) as "WHigh", weeklyLow COLOURED(200,0,0) as "WLow", monthlyHigh COLOURED(50,200,0) as "MHigh", monthlyLow COLOURED(200,0,0) as "MLow", signalline COLOURED (255,100,50) as "SignalLine", longMA COLOURED(50,50,255) as "Long MA", shortMA COLOURED(200,0,255) as "Short Ma"
 Pere
PereParticipant
Veteran
Hi Reiner. Thanks for your quick answer. Today the system gave almost the signal for shorts (during some hours), but later it disappeared because the price finally closed under the SMA300.
I want to ask you your opinion about important macro news like the Italian referendum on Sunday. What do you think about it? Better to stop the system on Sunday, or let it do it’s proper work, hoping that it will react?
It worked good on 8th of November with the USA elections (with a big drawdown), but was it only casually or do you think that this system is prepared to react to this kind of events, even if it starts with a tendency and suddenly this tendency changes to the opposite one?
Regards
Hi guys,
I want to share some new ideas related to Pathfinders trading system framework.
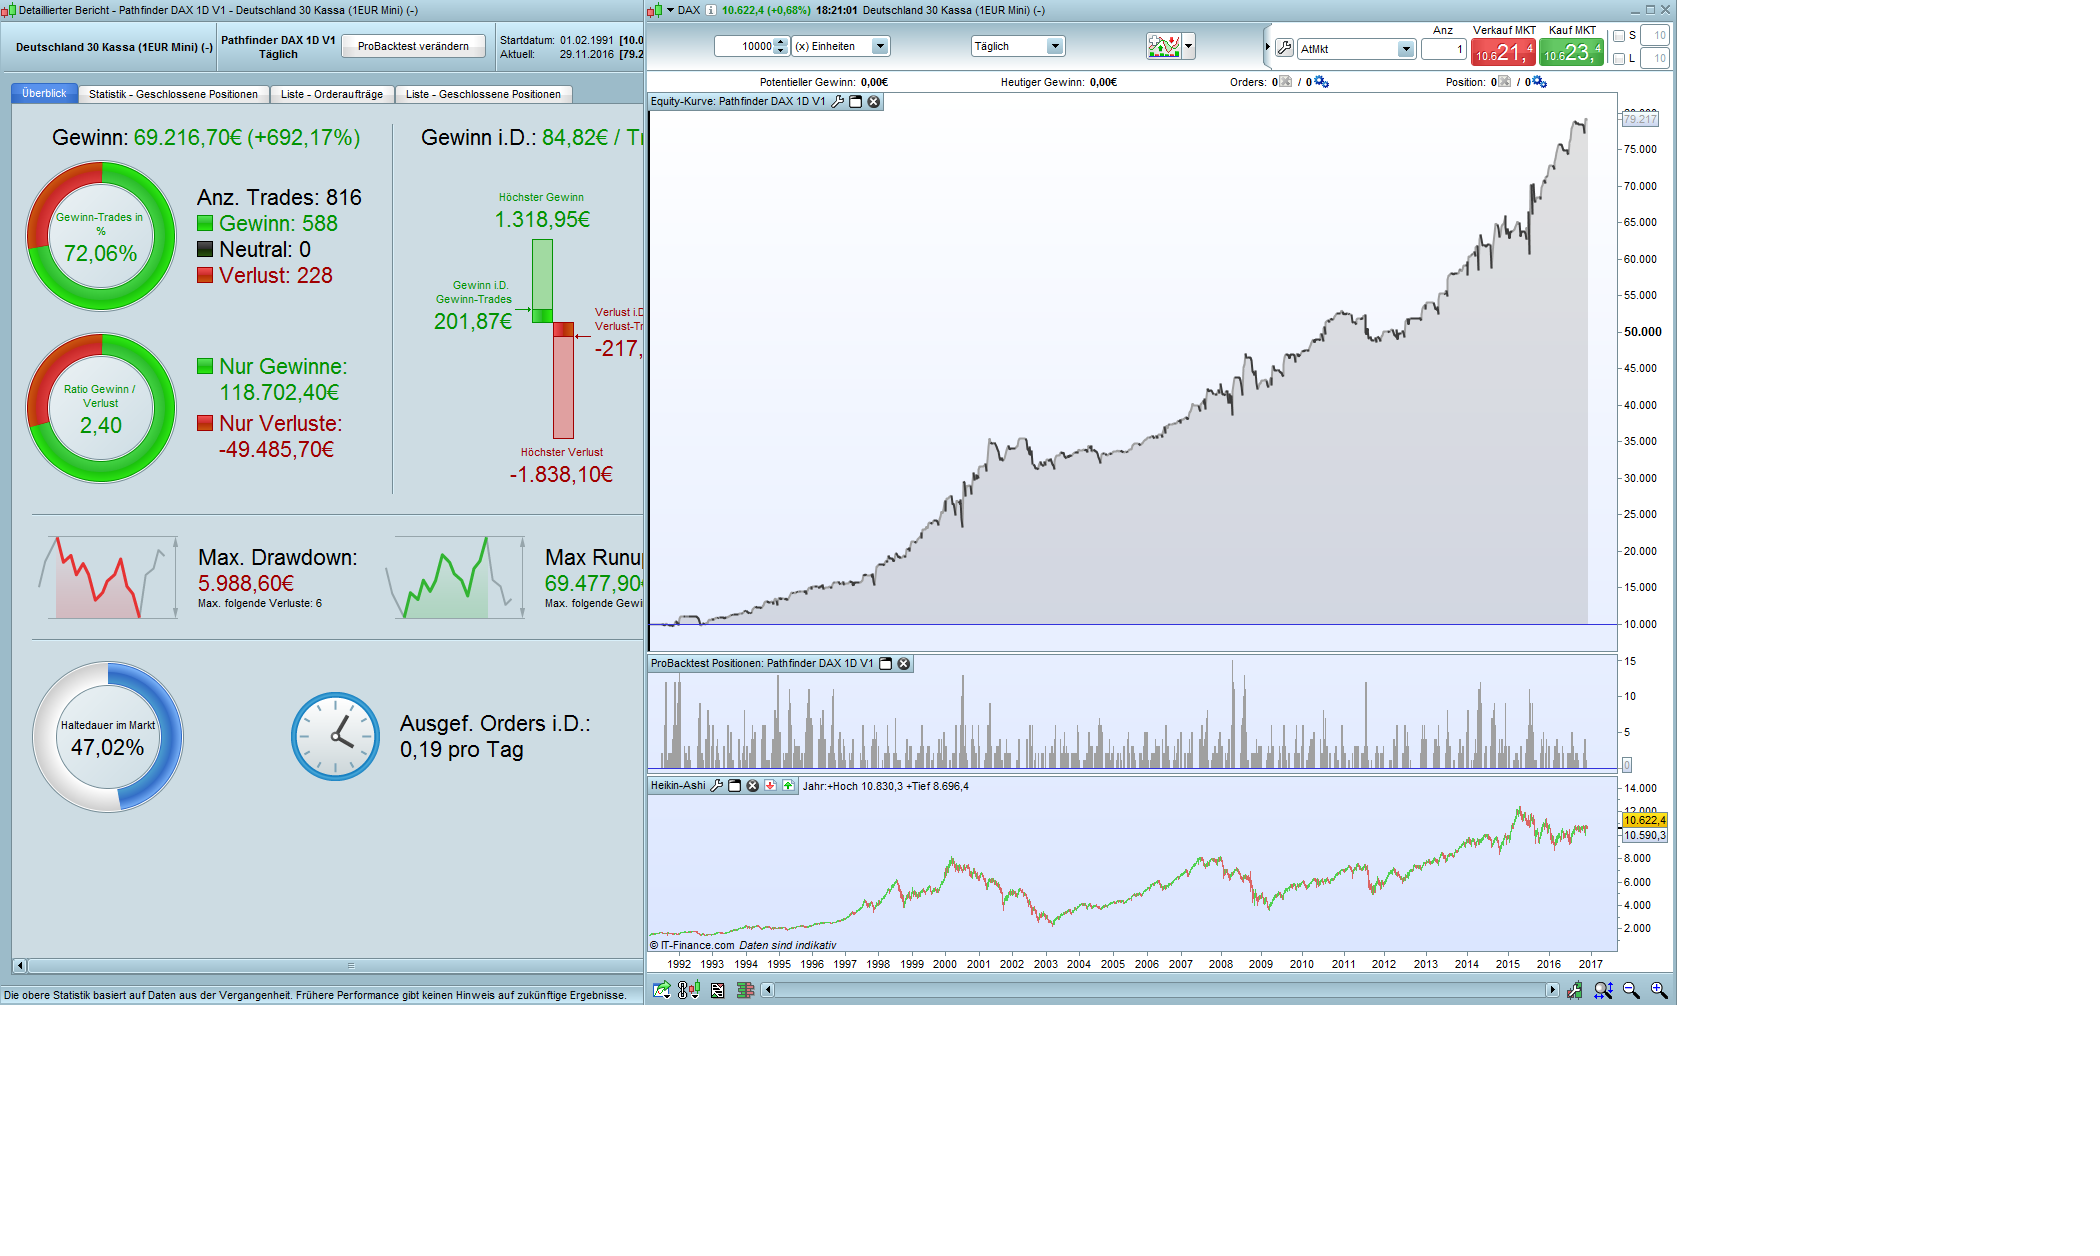
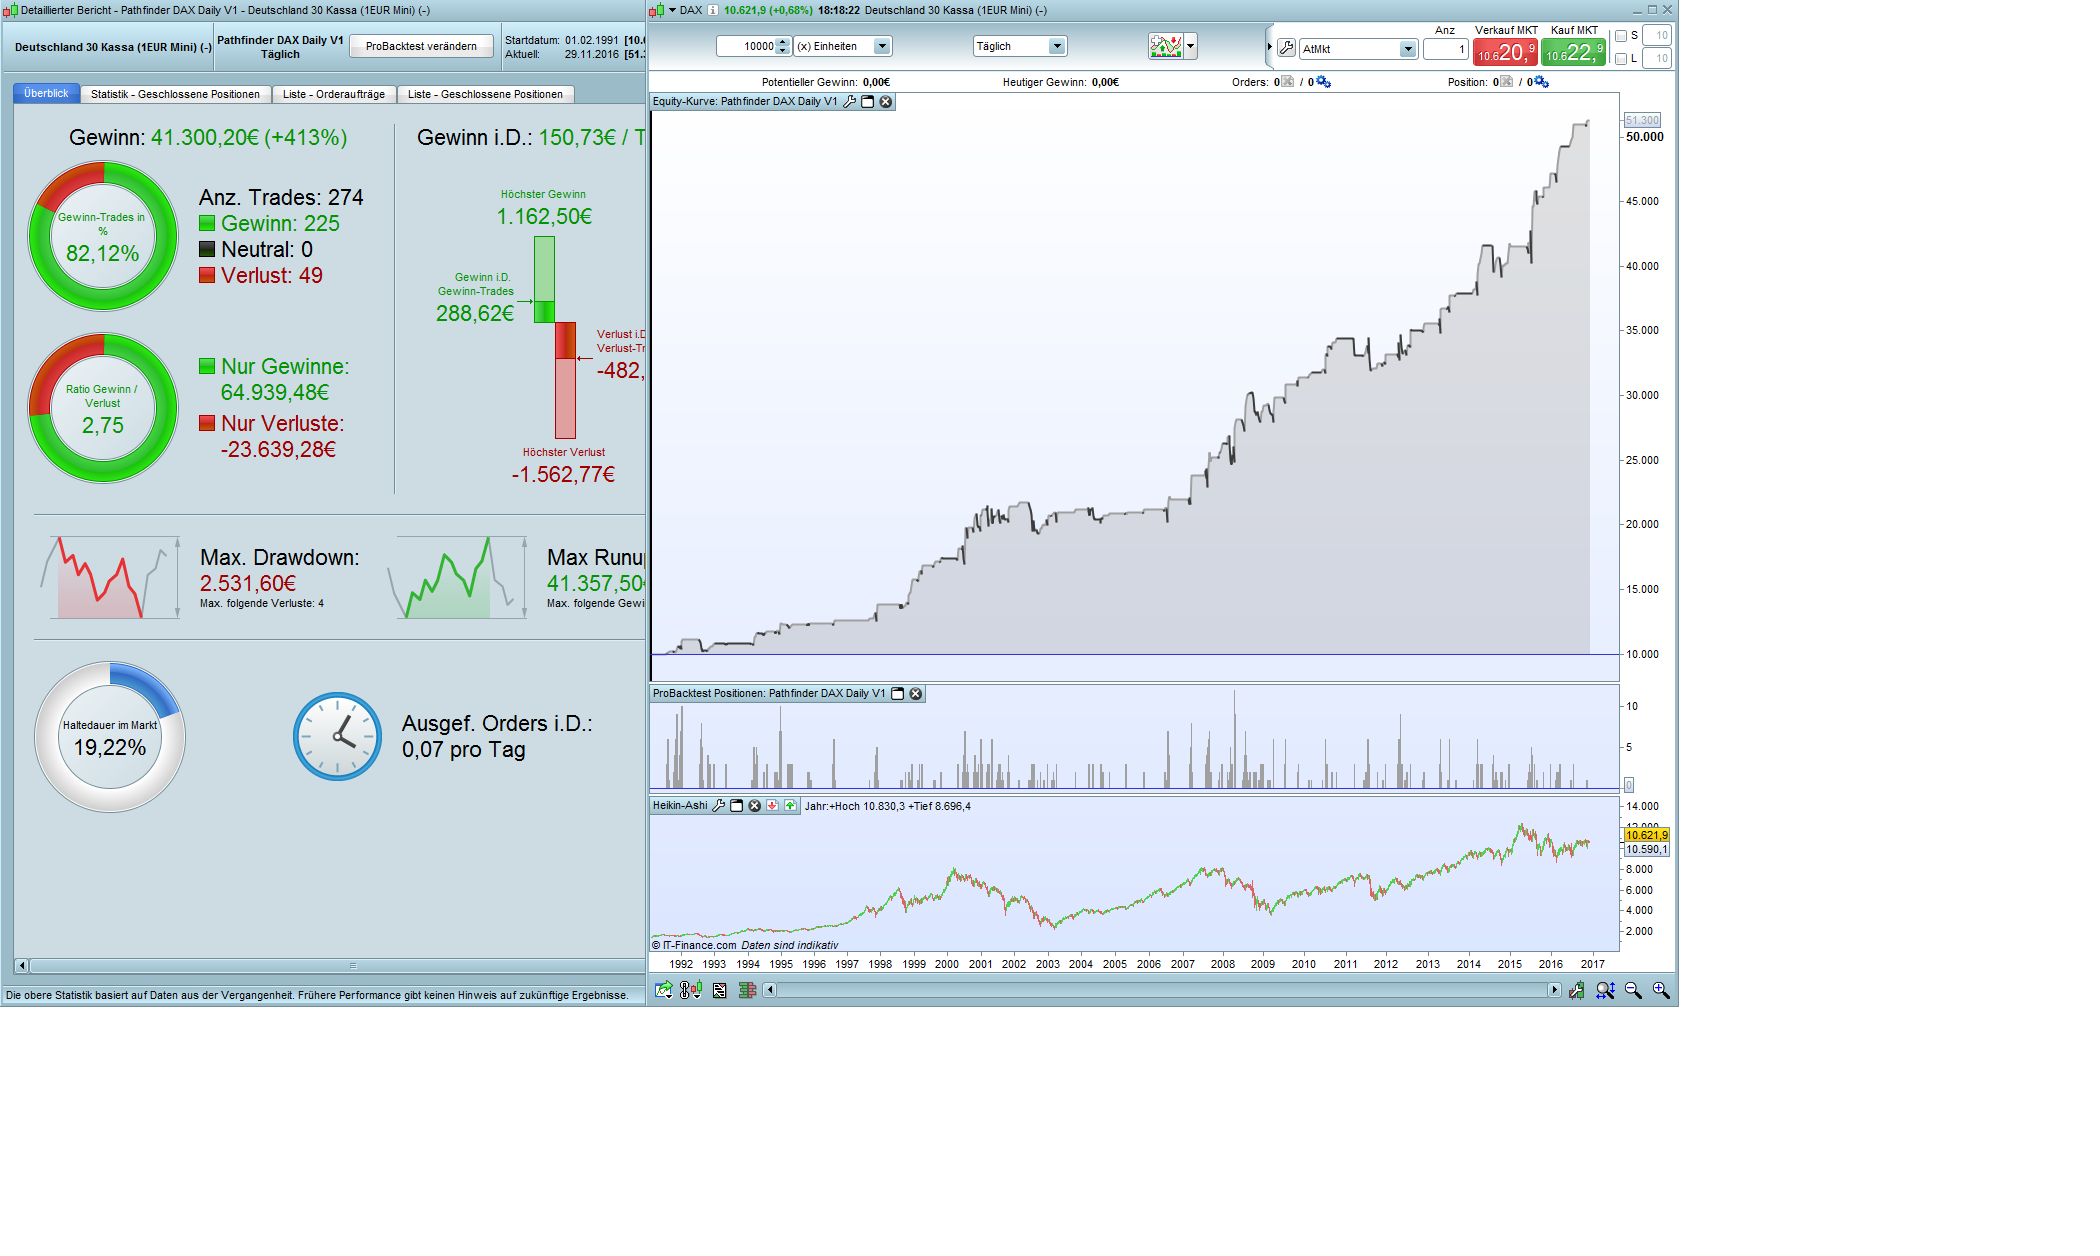
As you all know the advantage of daily timeframe is the very long history of available data for more or less every instrument. Please find attached two backtests of Pathfinder DAX. Both versions are trading only the long signals because of the higher profitability. The first version based on the original 6 breakout signal, the return is great but drawdown is also significant. The second version only trade the strongest signal based on daily breakout, return is very good with an acceptable drawdown. With the daily versions we are now in a position to verify some things much better for instance the seasonal behavior.
best, Reiner
That’s good news Reiner! Thanks for sharing this. Creating a backtest further into history is important to be more sure of expected outcome. Not only profitability but also DDs.
Hi guys,
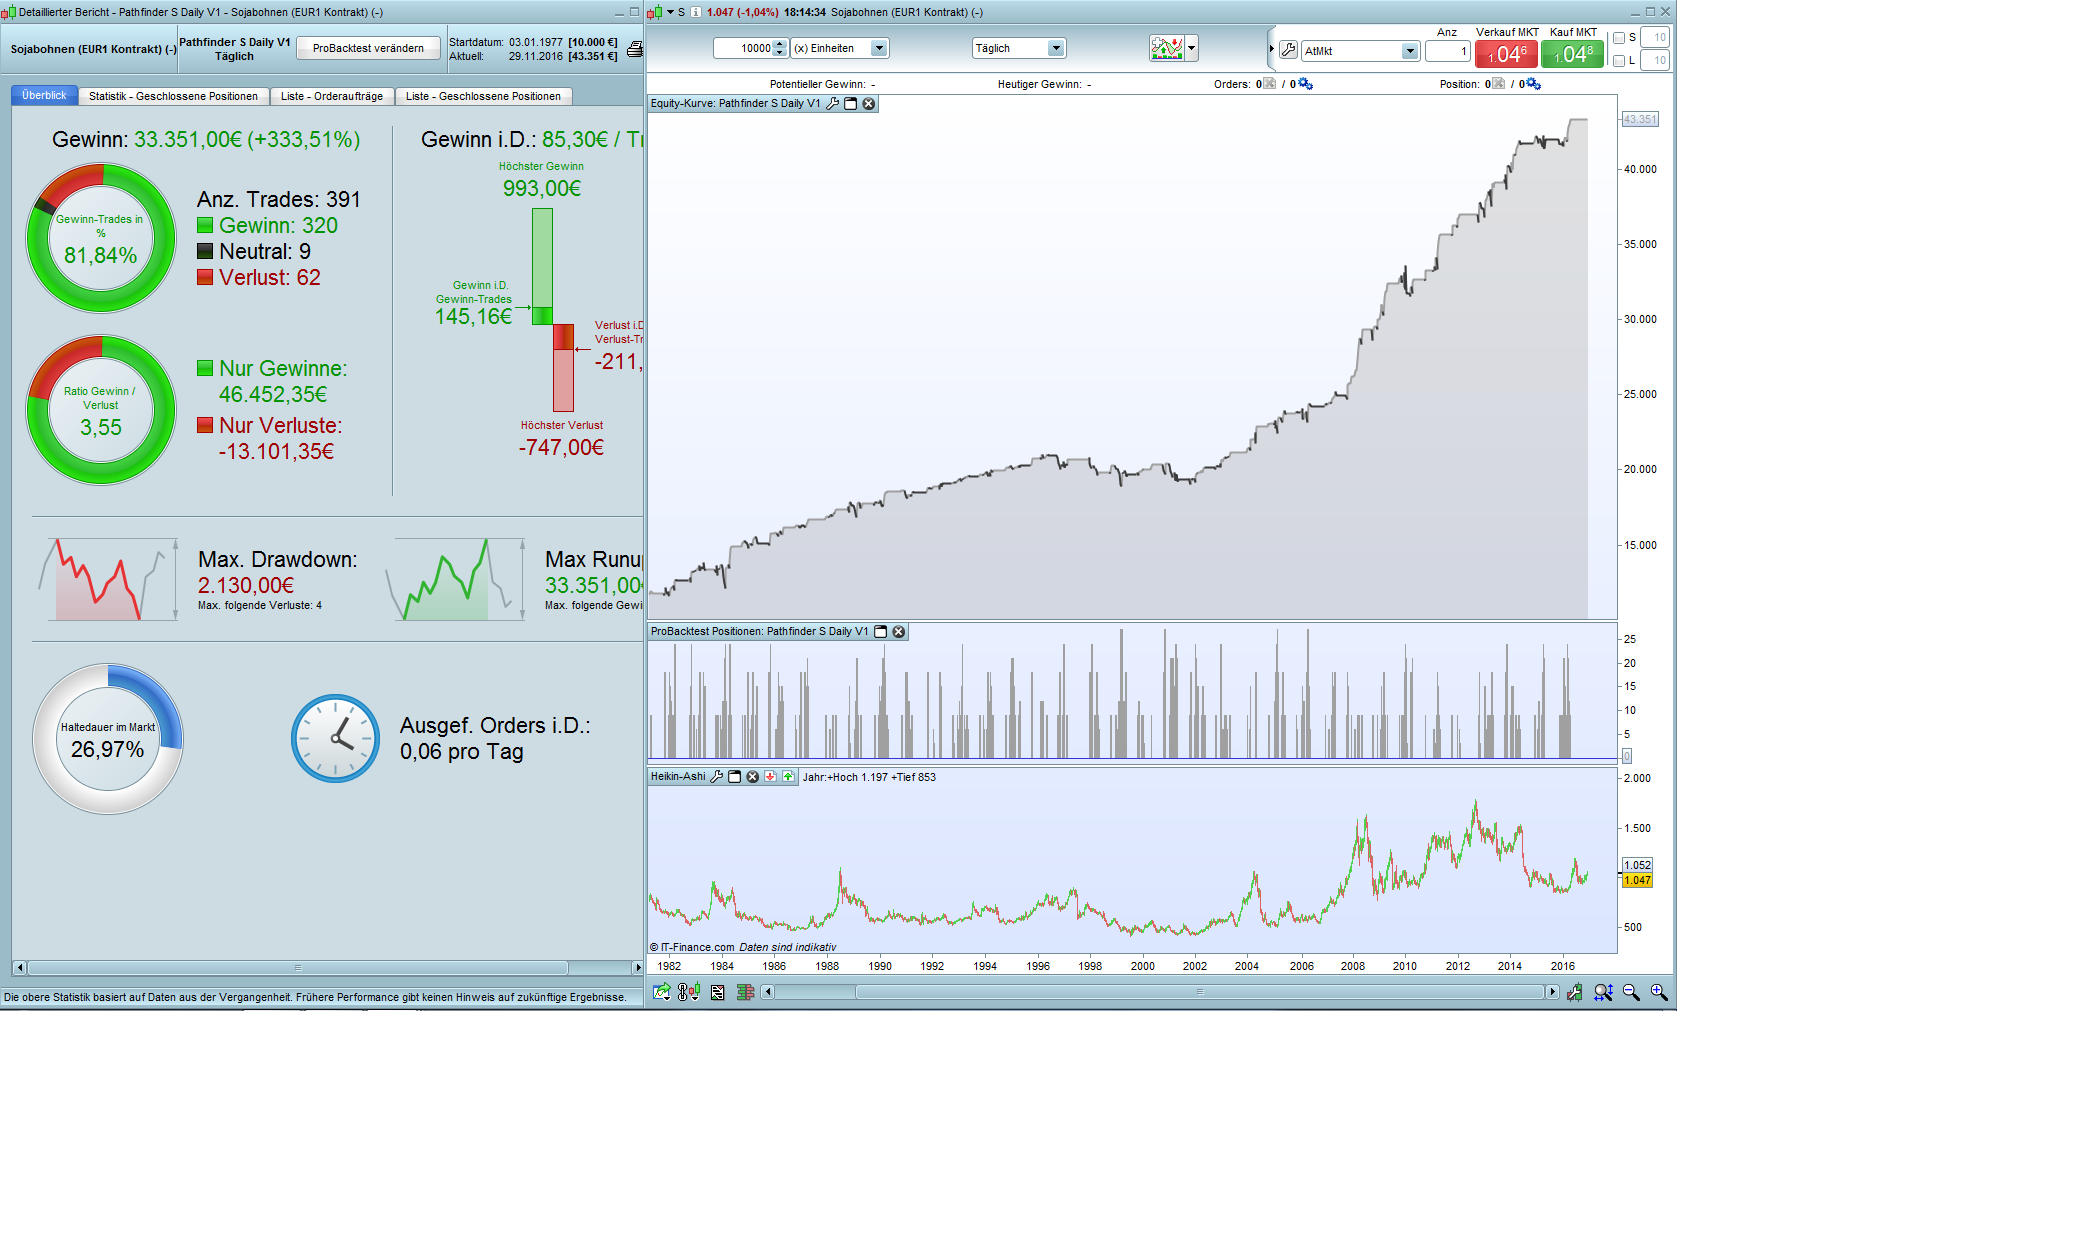
As mentioned in my last post with the availability of a daily Pathfinder version a lot more things are possible now. You all know my trading based on seasonality. That’s not a holy grail but really helpful to do the right things. Please find attached a perfect sample of the advantage of seasonality trading. I love trading the “beans” because of their strong seasonal behavior, on equityclock web page you find more details http://charts.equityclock.com/soybeans-futures-s-seasonal-chart
best, Reiner
 wp01
wp01Participant
Master
Hi Reiner,
Thank you very much for your new additions.
A question regarding the first file Pathfinder-DAX-1D-V1.itf . It looks like this is just a png file of the backtest instead of the itf file.
Or am i mistaken?
Best regards,
Patrick
my mistake, Sorry Patrick. Please find attached the correct itf file.
Hi Petrus,
At the end of the day it’s your personal decision and you have to feel good about it because it’s your money that is in the line of fire :-). For me it’s a valid option to stop the system on rough and fast markets.
Don’t expect to much from 250 lines of code it’s only a good working backtest and not a professional trader. The Trump day is a good example that the stop loss should be high enough to react to unexpected events but it was of course a lucky trade and not a smart algorithm.
best, Reiner
on ig there are no beans?
wp01Participant
Master
The code is “S” Miguel.
With a history from 1977 on the daily chart.
error in the demo and real
wp01Participant
Master
This error is probably the same as it was with the DAX 1H. Since this code only takes long positions there must probably something changed in the sell positions.
I compared the DAX 1H with the beanes but i can not figure it out. Sorry.
Regards,