just a quick question is ATR trailingstop affected by current price of market?
If you have for example atr trailing long = 10
Does the market price affect the trailing to start? If market is @ 1000 will the atr move differently if the market was at @ 3000?
ONCE trailingStopType     = 1
ONCE trailingstoplong     = 10
ONCE trailingstopshort    = 6
ONCE atrtrailingperiod    = 100
ONCE minstop              = 1


atrtrail = AverageTrueRange[atrtrailingperiod]((close/10)*pipsize)/1000
trailingstartl = round(atrtrail*trailingstoplong)
trailingstartS = round(atrtrail*trailingstopshort)
if trailingStopType = 1 THEN
TGL =trailingstartl
TGS=trailingstarts
if not onmarket then
MAXPRICE = 0
MINPRICE = close
PREZZOUSCITA = 0
ENDIF
if longonmarket then
MAXPRICE = MAX(MAXPRICE,close)
if MAXPRICE-tradeprice(1)>=TGL*pointsize then
if MAXPRICE-tradeprice(1)>=MINSTOP then
PREZZOUSCITA = MAXPRICE-TGL*pointsize
ELSE
PREZZOUSCITA = MAXPRICE - MINSTOP*pointsize
ENDIF
ENDIF
ENDIF
if shortonmarket then
MINPRICE = MIN(MINPRICE,close)
if tradeprice(1)-MINPRICE>=TGS*pointsize then
if tradeprice(1)-MINPRICE>=MINSTOP then
PREZZOUSCITA = MINPRICE+TGS*pointsize
ELSE
PREZZOUSCITA = MINPRICE + MINSTOP*pointsize
ENDIF
ENDIF
ENDIF
if onmarket and PREZZOUSCITA>0 then
EXITSHORT AT PREZZOUSCITA STOP
SELL AT PREZZOUSCITA STOP
ENDIF
ENDIF
This is what I mean with “normal”
Either way the TS would kick in after 10 points movement.
But as 10 / 1000 is different to 10 / 3000, then using ‘% of Price’ would ensure both scenarios are the same?
Yes, I understsand that TS would kick in after 10 points movement. But is it easier for the TS to start @ 1000 or does the distance work the same way and its not affected by marketprice?
How do you mean?
For an example an index has went from 10000 to 20000 in 3 years but it has went expotential so most of the data is @ 10000, and almost nothing at 20000 but it is where we are right now.
That is why I am wondering if it does matter, because if 10 points ATR is working differntly at 20000 compared to 10000 the TS would not kick as easy? Or do it work the same that is what I am wondering.
Try it in 2 backtests …
- System A – ATR Tail at 10 points start.
2. System B – ATR Trail at 10 / 10,000 = (0.001 * Price) points start
I still dont get it how that would tell me if atr is working differntly? You dont seem to understand what I mean? I want to know if ONCE trailingstoplong = 10 works and move ts the same way if the market is @ 1000 or @2000 or @10000 is it affected by marketprice at all?
move ts the same way
You would have to define what you mean by … the same way??
If an ATR of 10 is used with a price of 1000, then this will be bigger range candles (relative to price) than an ATR of 10 with a price of 10,000.
A TS step of 10 with price = 1000 will move in bigger steps (relative to price) than a TS with step of 10 with price = 10000.
If you add ‘GRAPH TGL’ to your code then you will see the TS move on a Chart
Ok thanks alot. So the step will be bigger but the start is the same?
Another example. 1. market is @ 1000, current latent gain is arround 300 euro (usually arround this ts starts) and that is when ts starts becase atr has moved 10 steps
2. market is @ 3000, current latent gain is also arround 300 euro (usually when ts started at @1000), will atr move the same way and start trailing as it would if it was on @1000. Or does the latent gain have to be much higher as the price has moved up or does it not matter at all, for example does the latent gain have to go 700 euro for the atr to move 10?
I need to let my coffee work through! 🙂
If anybody else can see a better way to explain than how I have then please jump in??
thanked this post
I think plotting ATR on the chart should help spotting any value at any time.
thanked this post
Yes that would solve it BUT
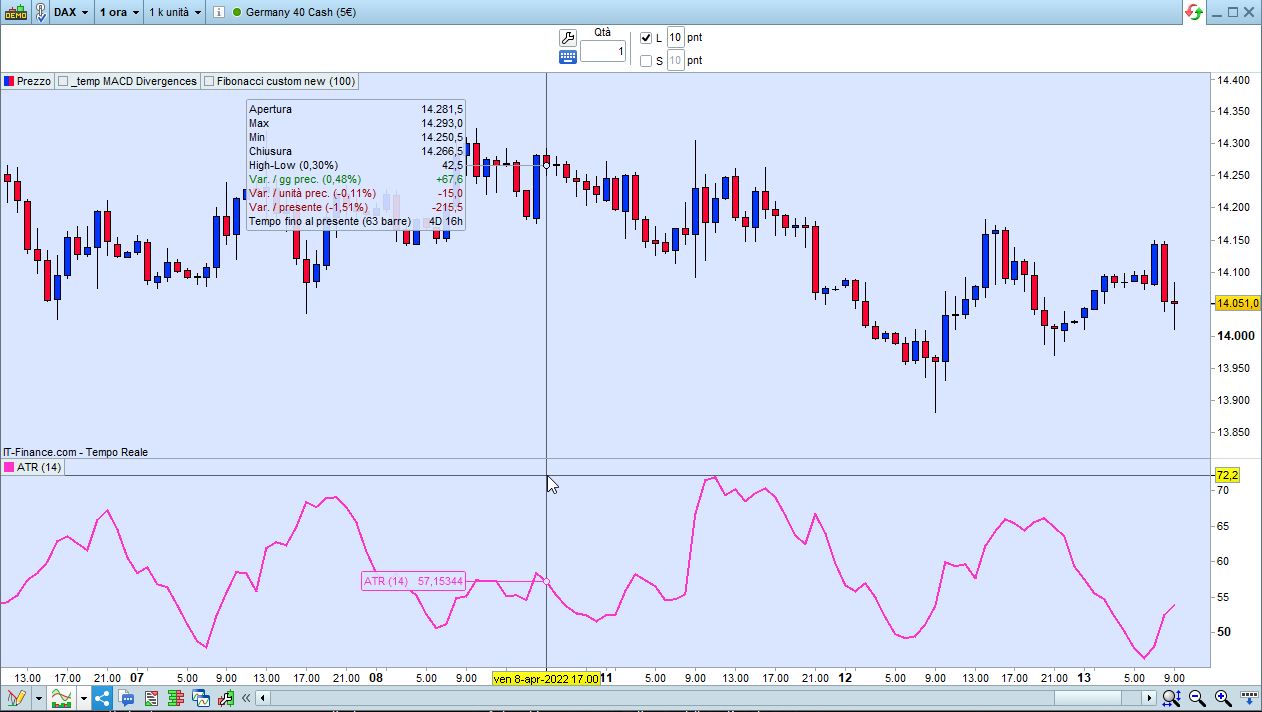
I have tried plotting ATR on the chart like that with 100 in periods from this “ONCE atrtrailingperiod = 100″
But a distance of 10 ( ONCE trailingstoplong = 10) is never shown. The max distance 200 units on 1 hour chart is arround 5, BUT TS has kicked in with 10 points on thoose 200 units when using the system. This means the plotting is totally wrong and I can not seem to find out what I am doing it wrongly by plotting it? I am right clicking the chart + add indicator and I choose Averge true range (atr) then I choose nbr of periods 100.
How can I plot the actual TS ATR?
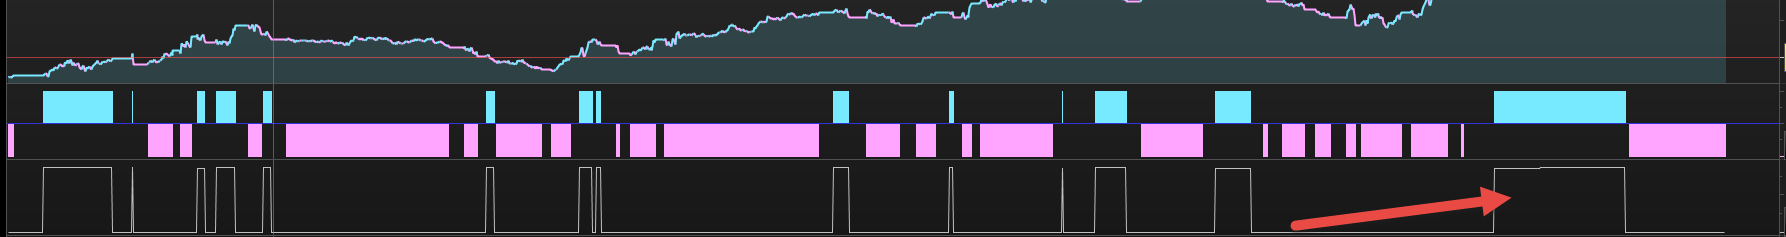
If you, for example, GRAPH ‘MAXPRICE’ … you will see the ATR working as shown at the red arrowhead on attached.
You will need to zoom in as otherwise MAXPRICE looks like a horizontal line.
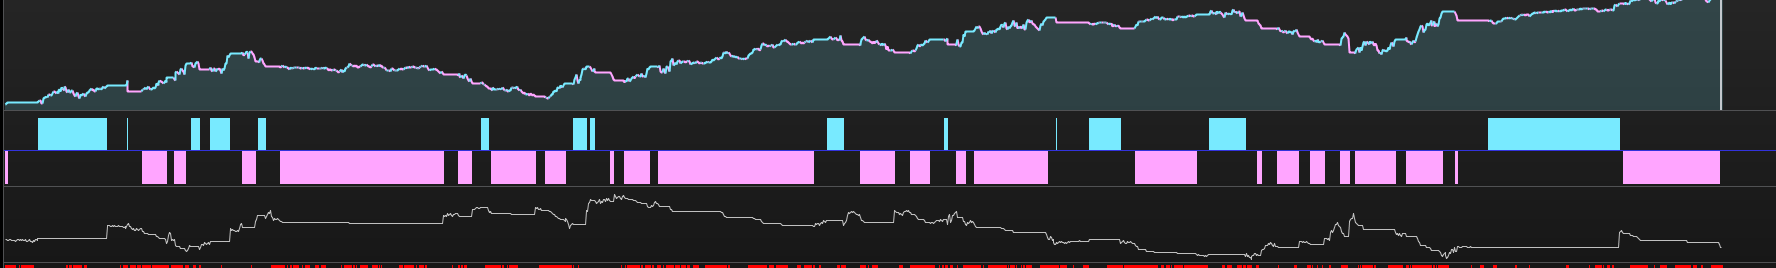
GRAPH MINPRICE is easier to see that the ATR Trail code above is working … see attached.
I know and understand that the trailcode is working. I just want to be able to see the distance in ATR. How can I do that?
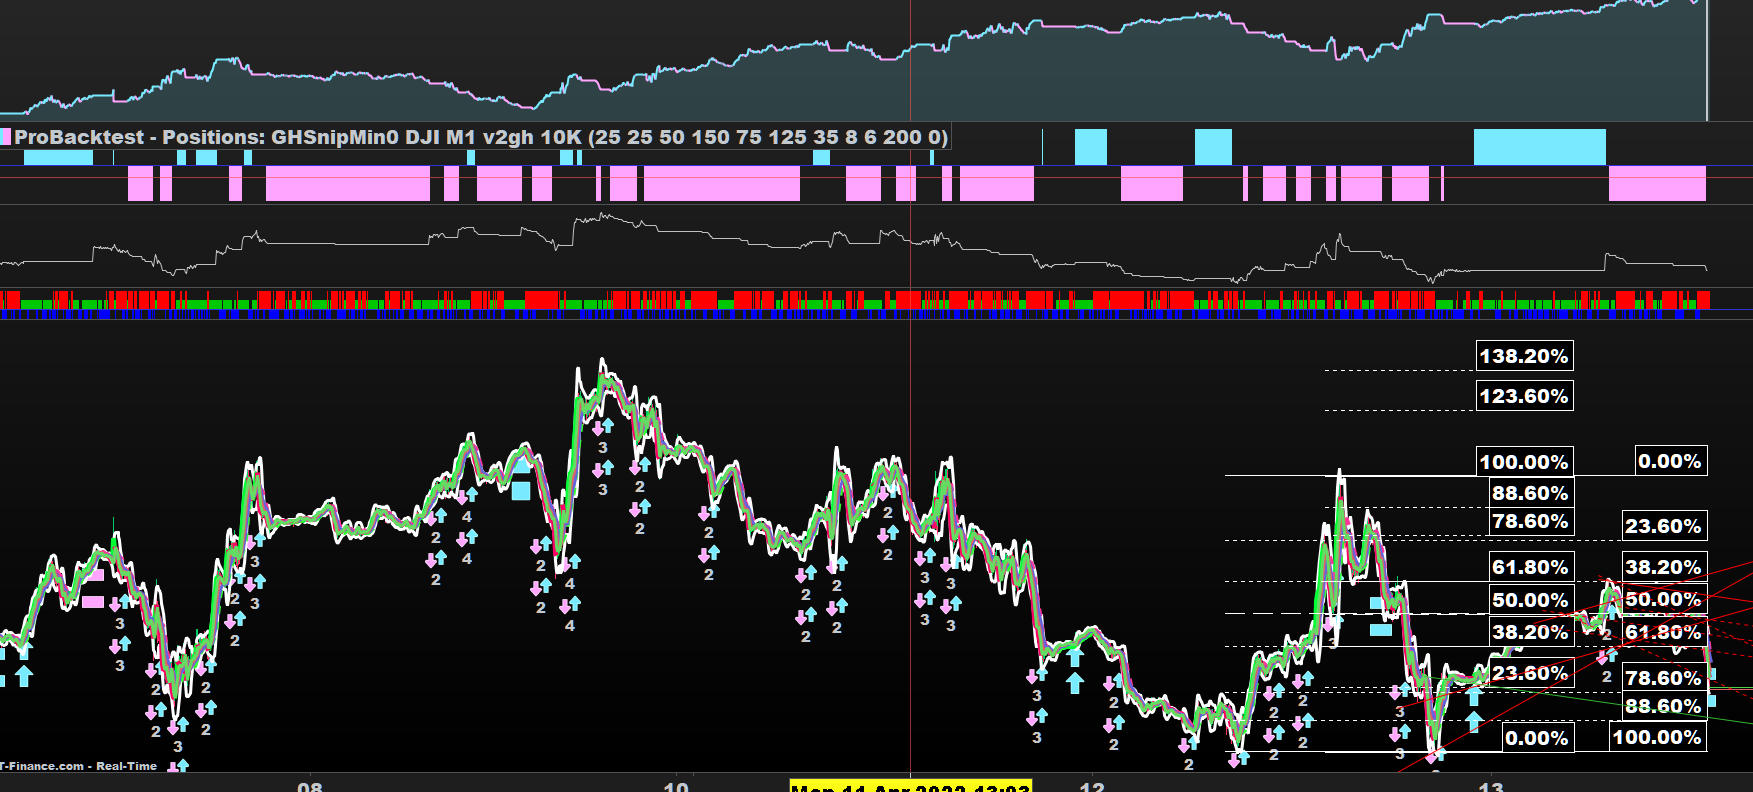
By plotting “GRAPH PREZZOUSCITA” I can see when the trail starts, but I want to see the actual ATR values
And also it would be nice for someone could answer my question. Let me try to explain it further…
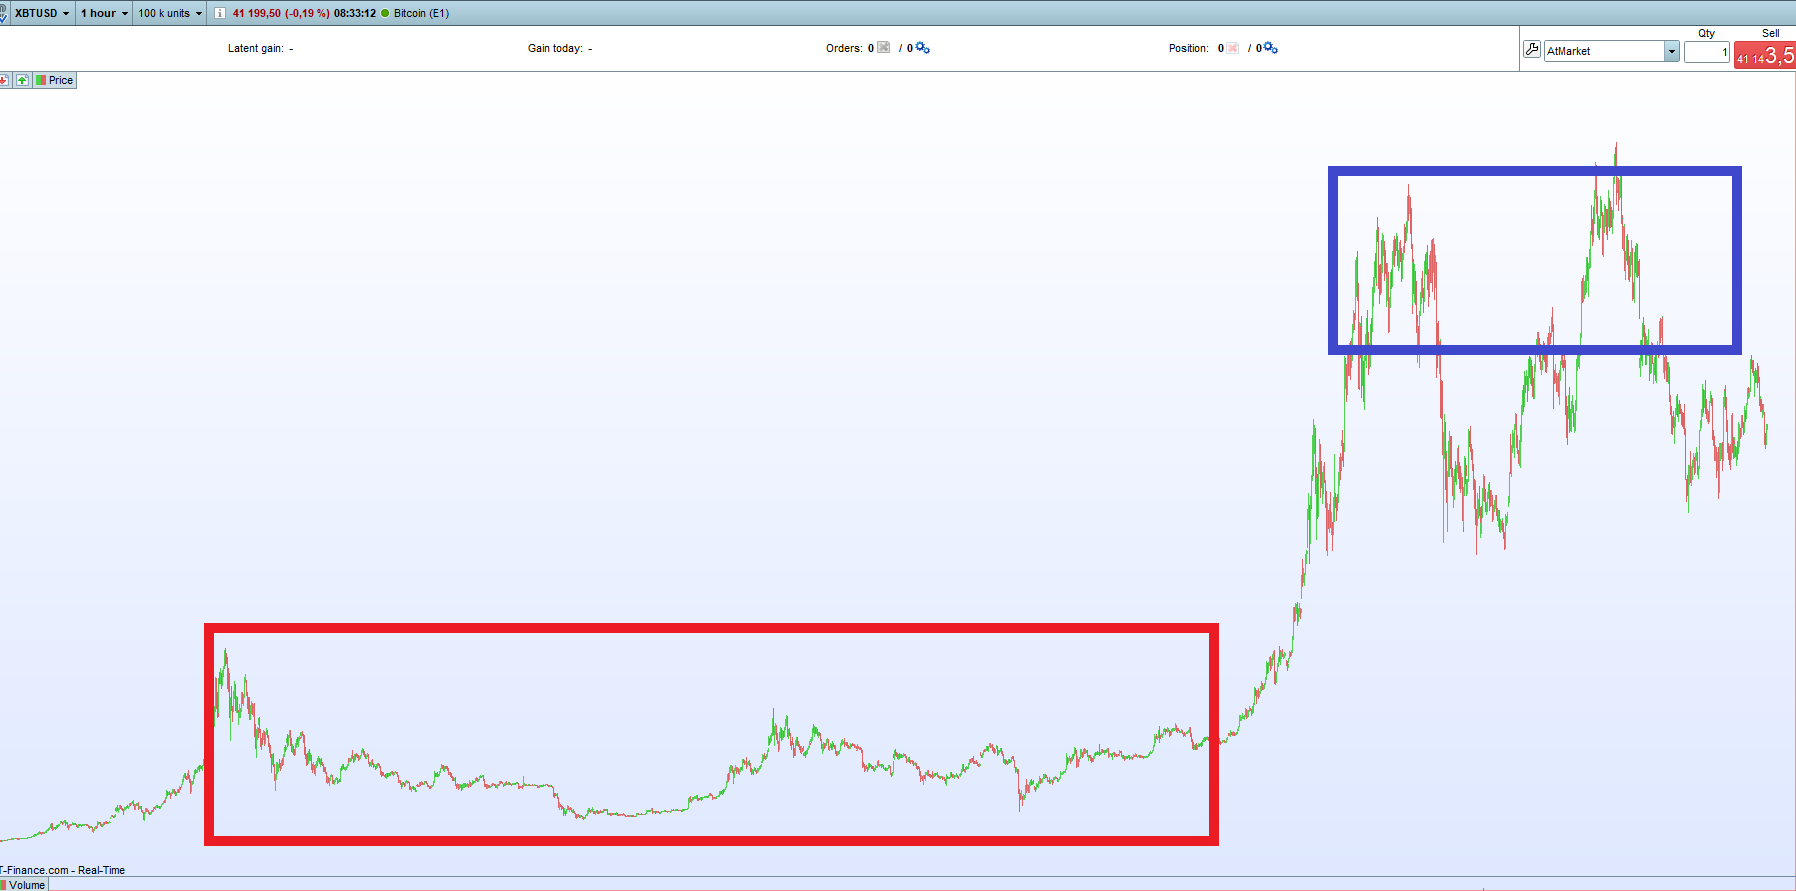
For example on the attached picture from XBTUSD.
In the red box its the period of arround 2018 to 2020. The price was much lower in the red box as in the bluebox. If I would like to use the trailingstop code above.. Would for example ONCE trailingstoplong = 10. Work the same as in the blue box as the red box.
Lets say that most of the trades in the red box the trialingstop was kicked in when the price of the current position was arround 300 euro for the most cases (not all).
Would the same algo with same trailingstoplong = 10 still kick in the trailingstop arround 300 euro in the blue box also. Or as the price has gone much higher up in the blue box would it automaticly change that current latent gain has to be much higher than it was back when the price was lower?
I hope I made it much clearer now.