ATR Take Profit and Stop Loss

Viewing 5 posts - 1 through 5 (of 5 total)
  • Author
    Posts
  • #221073 quote
    Patrick K TemplarPatrick K Templar
    Participant
    Average

    Hello could you convert this please from Tradingview into pro-real-time code

    I have one I have been using but it is not as correct as this thank you


    study(title = "NNFX ATR", shorttitle = "ATR", overlay = true, format = format.price, precision = 5) //Don't add scale = scale.right as the indicator will move all over the place
    
    atrLength = input(title = "X", defval = 14, minval = 1)
    atrProfit = input(title = "TP", defval = 1, type = input.float)
    atrLoss   = input(title = "SL", defval = 1.5, type = input.float)
    
    smoothing = input(title="Smoothing", defval="RMA", options=["RMA", "SMA", "EMA", "WMA"])
    function(source, length) => 
    	if smoothing == "RMA"
    		rma(source, atrLength)
    	else
    		if smoothing == "SMA"
    			sma(source, atrLength)
    		else
    			if smoothing == "EMA"
    				ema(source, atrLength)
    			else
    				wma(source, atrLength)
    
    formula(number, decimals) =>
        factor = pow(10, decimals)
        int(number * factor) / factor
        
    atr = formula(function(tr(true), atrLength),5)
    
    //Buy
    bAtrBuy  = atrLength ? close + atr* atrProfit : close - atr* atrProfit
    bAtrSell = atrLength ? close - atr* atrLoss   : close + atr* atrLoss
    
    plot(bAtrBuy, title  = "Buy TP", color = color.blue, transp = 0, linewidth = 1, trackprice = true, editable=  true)
    plot(bAtrSell, title = "Buy SL", color = color.red, transp = 25, linewidth = 1, trackprice = true, editable = true)
    
    //Sell
    sAtrBuy  = atrLength ? close - atr* atrProfit : close + atr* atrProfit
    sAtrSell = atrLength ? close + atr* atrLoss   : close - atr* atrLoss
    
    plot(sAtrBuy, title  = " Sell TP", color = color.blue, transp = 35, linewidth = 1, trackprice = true, editable = true)
    plot(sAtrSell, title = "Sell SL", color = color.red, transp = 50, linewidth = 1, trackprice = true, editable = true)
    
    //This one is way below price because I don't want there to be a 5th line inbetween the 2 TPs and SLs
    plot(atr, title = " Main ATR", color = color.yellow, transp = 0, linewidth = 1, editable = true)
    
    //---END---


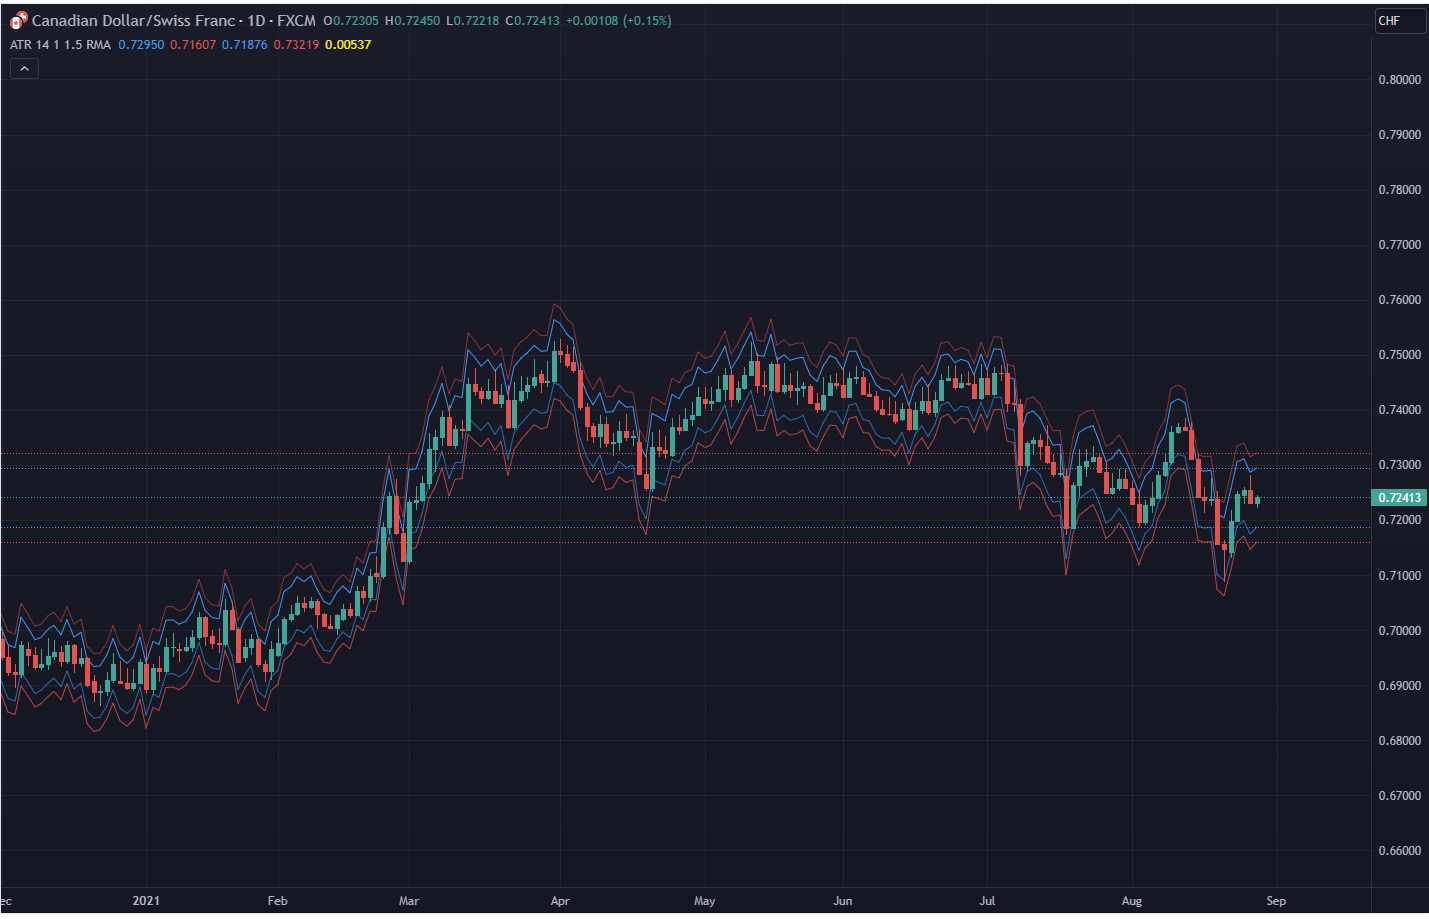
    1. This is an indicator specially made for NNFX traders who use the ATR rule of ATR1x for Take Profit and ATR1.5x for Stop Loss

    The indicator:
    1. It can be used for a quick look using the lines to see instead of calculating whether price hit a TP or SL. However I have kept the Main ATR for those who want to record the ATR into the spreadsheet when back testing or forward testing
    2. When placing a buy/long order, TP is blue and appears above price, SL is red and appears below price
    3. When placing a sell/short order, TP is blue and appears below price, SL is red and appears above price
    4. The Main ATR, which is yellow, is way below price because I didn’t want the chart to be overwhelmed by a 5th line in the middle of 2 TPs and SLs aka make the chart look claustrophobic

    atr-tv.png atr-tv.png
    #221114 quote
    NicolasNicolas
    Keymaster
    Legend

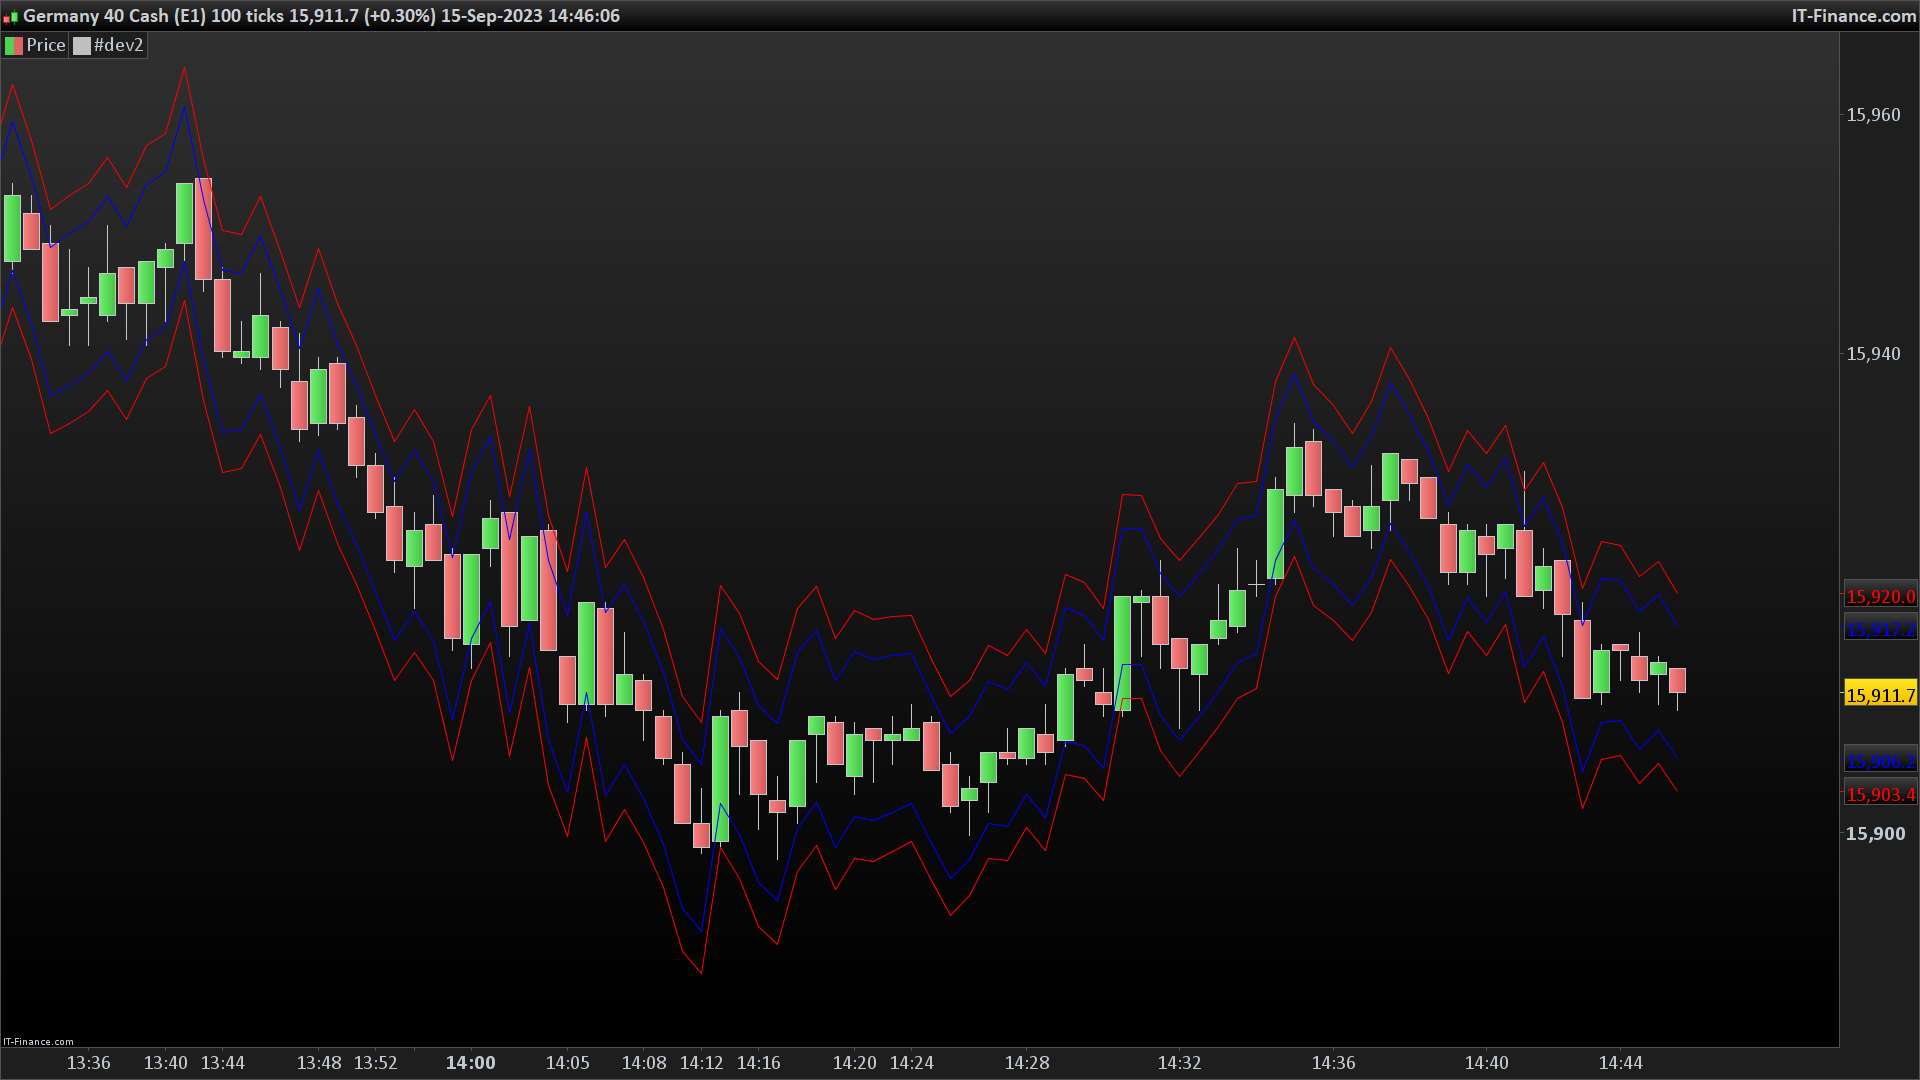
    Here is below the translated code for this NNFX indicator that display the ATR takeprofit and stoploss for both Buy and Sell orders:

    //NNFX ATR
    atrLength = 14
    atrProfit = 1
    atrLoss   = 1.5
    
    smoothing = 1
    
    //formula(number, decimals) =>
    once factor = pow(10, 5)
    //int(number * factor) / factor
        
    atr = (averagetruerange[atrlength]*factor)/factor//formula(function(tr(true), atrLength),5)
    
    //Buy
    bAtrBuy  = close + atr* atrProfit //: close - atr* atrProfit
    bAtrSell = close - atr* atrLoss   //: close + atr* atrLoss
    
    //plot(bAtrBuy, title  = "Buy TP", color = color.blue, transp = 0, linewidth = 1, trackprice = true, editable=  true)
    //plot(bAtrSell, title = "Buy SL", color = color.red, transp = 25, linewidth = 1, trackprice = true, editable = true)
    
    //Sell
    sAtrBuy  = close - atr* atrProfit 
    sAtrSell = close + atr* atrLoss
    
    //plot(sAtrBuy, title  = " Sell TP", color = color.blue, transp = 35, linewidth = 1, trackprice = true, editable = true)
    //plot(sAtrSell, title = "Sell SL", color = color.red, transp = 50, linewidth = 1, trackprice = true, editable = true)
    
    //---END---
    
    return bAtrBuy coloured("blue") as "Buy TP",bAtrSell coloured("red") as "Buy SL", sAtrBuy coloured("blue") as "Sell TP",sAtrSell coloured("red") as "Sell SL"
    Meta Signals Pro and Patrick K Templar thanked this post
    atr-takeprofit-and-stoploss.png atr-takeprofit-and-stoploss.png
    #239389 quote
    borsoggeborsogge
    Participant
    Junior

    Thanks but not exactly what i had in mind. I use this code to know when to take my stop:

    // Période
    p = 5

    // Average True Range X
    ATRx = AverageTrueRange[p](close) * 3.5

    // ATRts = ATR Trailing Stop

    // Inversion de tendance
    IF close crosses over ATRts THEN
    ATRts = close – ATRx
    ELSIF close crosses under ATRts THEN
    ATRts = close + ATRx
    ENDIF

    // Cacul de l’ATRts lors de la même tendance
    IF close > ATRts THEN
    ATRnew = close – ATRx
    IF ATRnew > ATRts THEN
    ATRts = ATRnew
    ENDIF
    ELSIF close < ATRts THEN
    ATRnew = close + ATRx
    IF ATRnew < ATRts THEN
    ATRts = ATRnew
    ENDIF
    ENDIF

    return ATRts as “ATR Trailing Stop”

    But i dont want it to be active until i have reached a certain profit level. For example, i take an entry at in the SP500 at 5820. When it reaches 5840 the ATR stop begins under the previous bar.

    Is this possible to program?

    robertogozzi thanked this post
    #239431 quote
    robertogozzirobertogozzi
    Moderator
    Legend

    Thanks but not exactly what i had in mind.

    Of course it isn’t. It is what Patrick K Templar asked for 🙂

    #239470 quote
    robertogozzirobertogozzi
    Moderator
    Legend

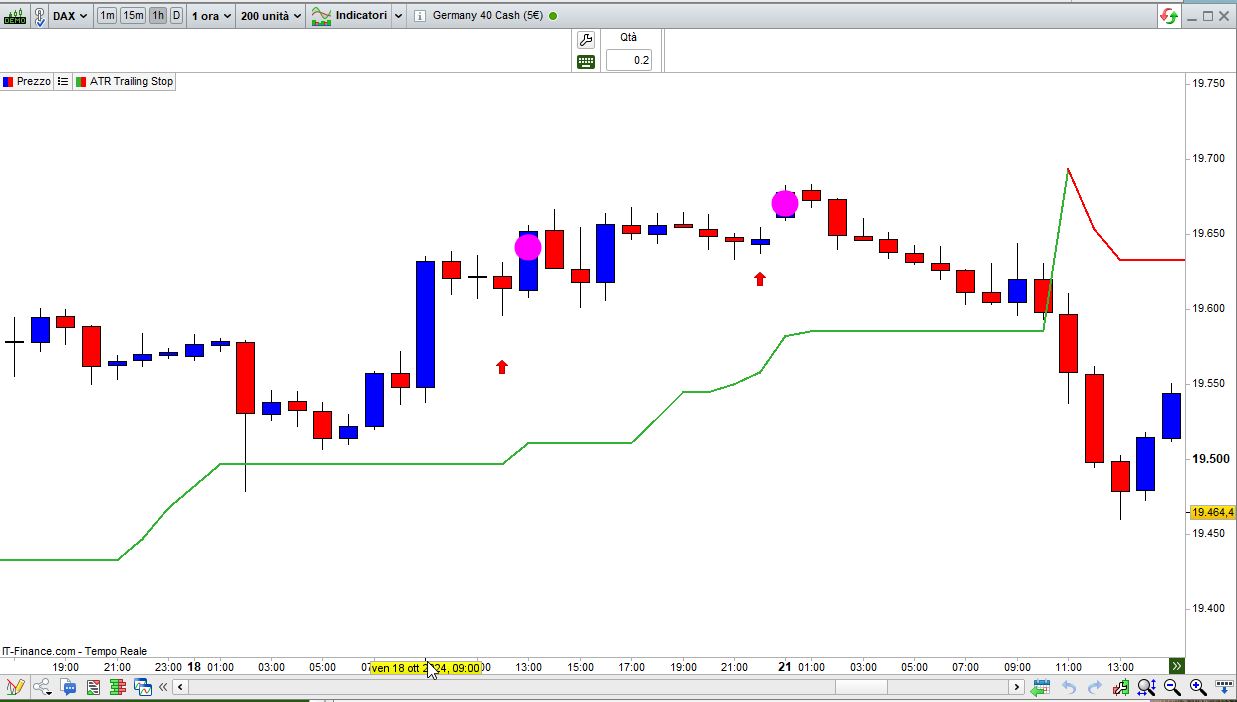
    Cela imprimera sur la bougie actuelle et ⬆︎ en dessous de la bougie précédente, lorsque le prix actuel dépasse le HAUT des 20 bougies précédentes :

    PriceLevel = highest[20](high[1])  //DRAW only when CLOSE > this level
    
    // Période
    p = 5
    
    // Average True Range X
    ATRx = AverageTrueRange[p](close) * 3.5
    
    // ATRts = ATR Trailing Stop
    
    // Inversion de tendance
    IF close crosses over ATRts THEN
       ATRts = close - ATRx
    ELSIF close crosses under ATRts THEN
       ATRts = close + ATRx
    ENDIF
    
    // Cacul de l’ATRts lors de la même tendance
    IF close > ATRts THEN
       ATRnew = close - ATRx
       IF ATRnew > ATRts THEN
          ATRts = ATRnew
       ENDIF
    ELSIF close < ATRts THEN
       ATRnew = close + ATRx
       IF ATRnew < ATRts THEN
          ATRts = ATRnew
       ENDIF
    ENDIF
    IF close > PriceLevel THEN
       drawtext("●",BarIndex,PriceLevel,dialog,bold,36) coloured("Fuchsia")
       drawarrowUP(BarIndex[1],low[1]-range[1]) coloured("Red")
    ENDIF
    return ATRts as "ATR Trailing Stop"
    x-18.jpg x-18.jpg
Viewing 5 posts - 1 through 5 (of 5 total)

  • You must be logged in to reply to this topic.

ProRealAI ProRealAI New

Stuck on this ProBuilder code?

Describe what this topic is trying to build, in plain English, and ProRealAI writes the ProRealTime™ indicator, screener or system for you.

Available in 7 languages
Try ProRealAI

ATR Take Profit and Stop Loss


ProBuilder: Indicators & Custom Tools

New Reply
Summary

This topic contains 4 replies,
has 4 voices, and was last updated by robertogozzirobertogozzi
1 year, 11 months ago.

Topic Details
Forum: ProBuilder: Indicators & Custom Tools
Language: English
Started: 09/15/2023
Status: Active
Attachments: 3 files
ProRealCode ProRealCode
Loading...