You always need to have enough contracts to “pay” spread, slippage and so on …
If I have time next week I will show you with IS/OOS tests that after some amount of contracts it changes nothing in % variation (not total gain of course)
Bye
Like Vonasi said, each contract is a single unit-that has a spread attached to it.
1 contact has spread x 1.
3000 contracts has spread x 3000.
How do you escape that?
How do you model slippage?? I haven’t heard much about that in PRT? Didn’t know you could do it. I thought that more came into play with the broker and actual real prices that they give you for the trade, and not historic tick by tick, which I thought just gave you the price stored in the database?
Have you had a look at margin rates for 1000-3000 contracts? Be pretty high wouldnt it? Do you have the actual cash to trade that and have 60% + spare? It’s a personal question, I don’t want the answer, but it’s one you need.
Will you get a fill for 3000 contracts?? Have you ever traded 3000 contracts? Is it doable?
Haven’t quite got to that size myself yet…
Hi @Finning
As I said initially it’s backtest on PRT demo, it’s just “food for thought” and to speak about this conclusion
No you can’t escape spread and slippage you can do an estimation based on IG data and indicate it in your code
Have nice week-end
Valeurs
Stops : aucun slippage
Slippage négatif moyen (en pips)
EUR/USD
91 %
0,136
Hi Zilliq,
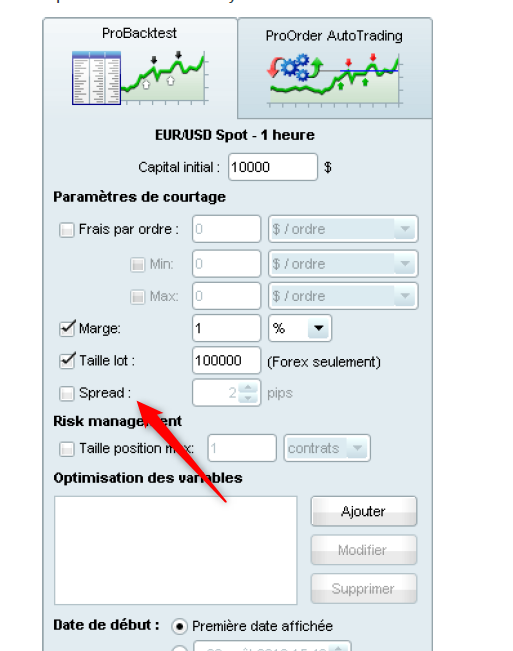
Ah ok food for thought – it’s always good to see the possibilities. With the spread setting, if it’s an average of say 2, and a max of 4, I always just leave it on 4.
The biggest food for thought that I like doing is bumping up my account to say $100k (much more than I currently have… 🤦♂️) but keeping the trade size the same, and looking at how it seems to be a lot more robust-gives the chance to keep going and get to a new equity high. Bit of an easy way to do it i guess…
I like doing is bumping up my account to say $100k (much more than I currently have… 🤦♂️) but keeping the trade size the same, and looking at how it seems to be a lot more robust-gives the chance to keep going and get to a new equity high. Bit of an easy way to do it i guess…
Yep – the easiest way to make a lot of money is to start with a lot of money… a lot of money that you wouldn’t be upset to lose (someone else’s?). With a lot of money you can sit through a lot of drawdown while averaging down and suffer a lot of fees while you wait for the market to recover. Then again if you have the sort of money to do that then your name is Warren Buffet so you don’t need to be messing around with coding algos to use for spread betting!
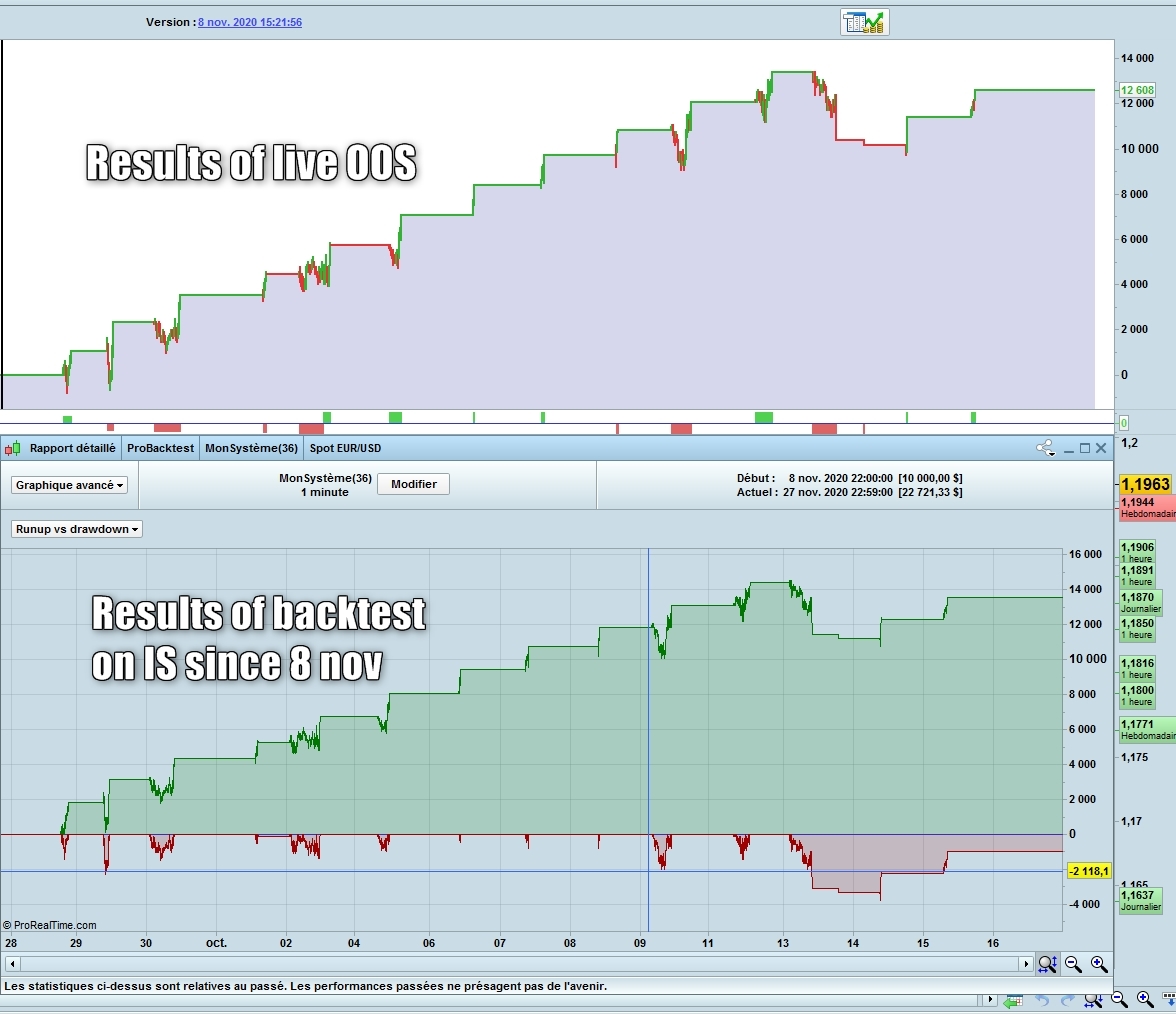
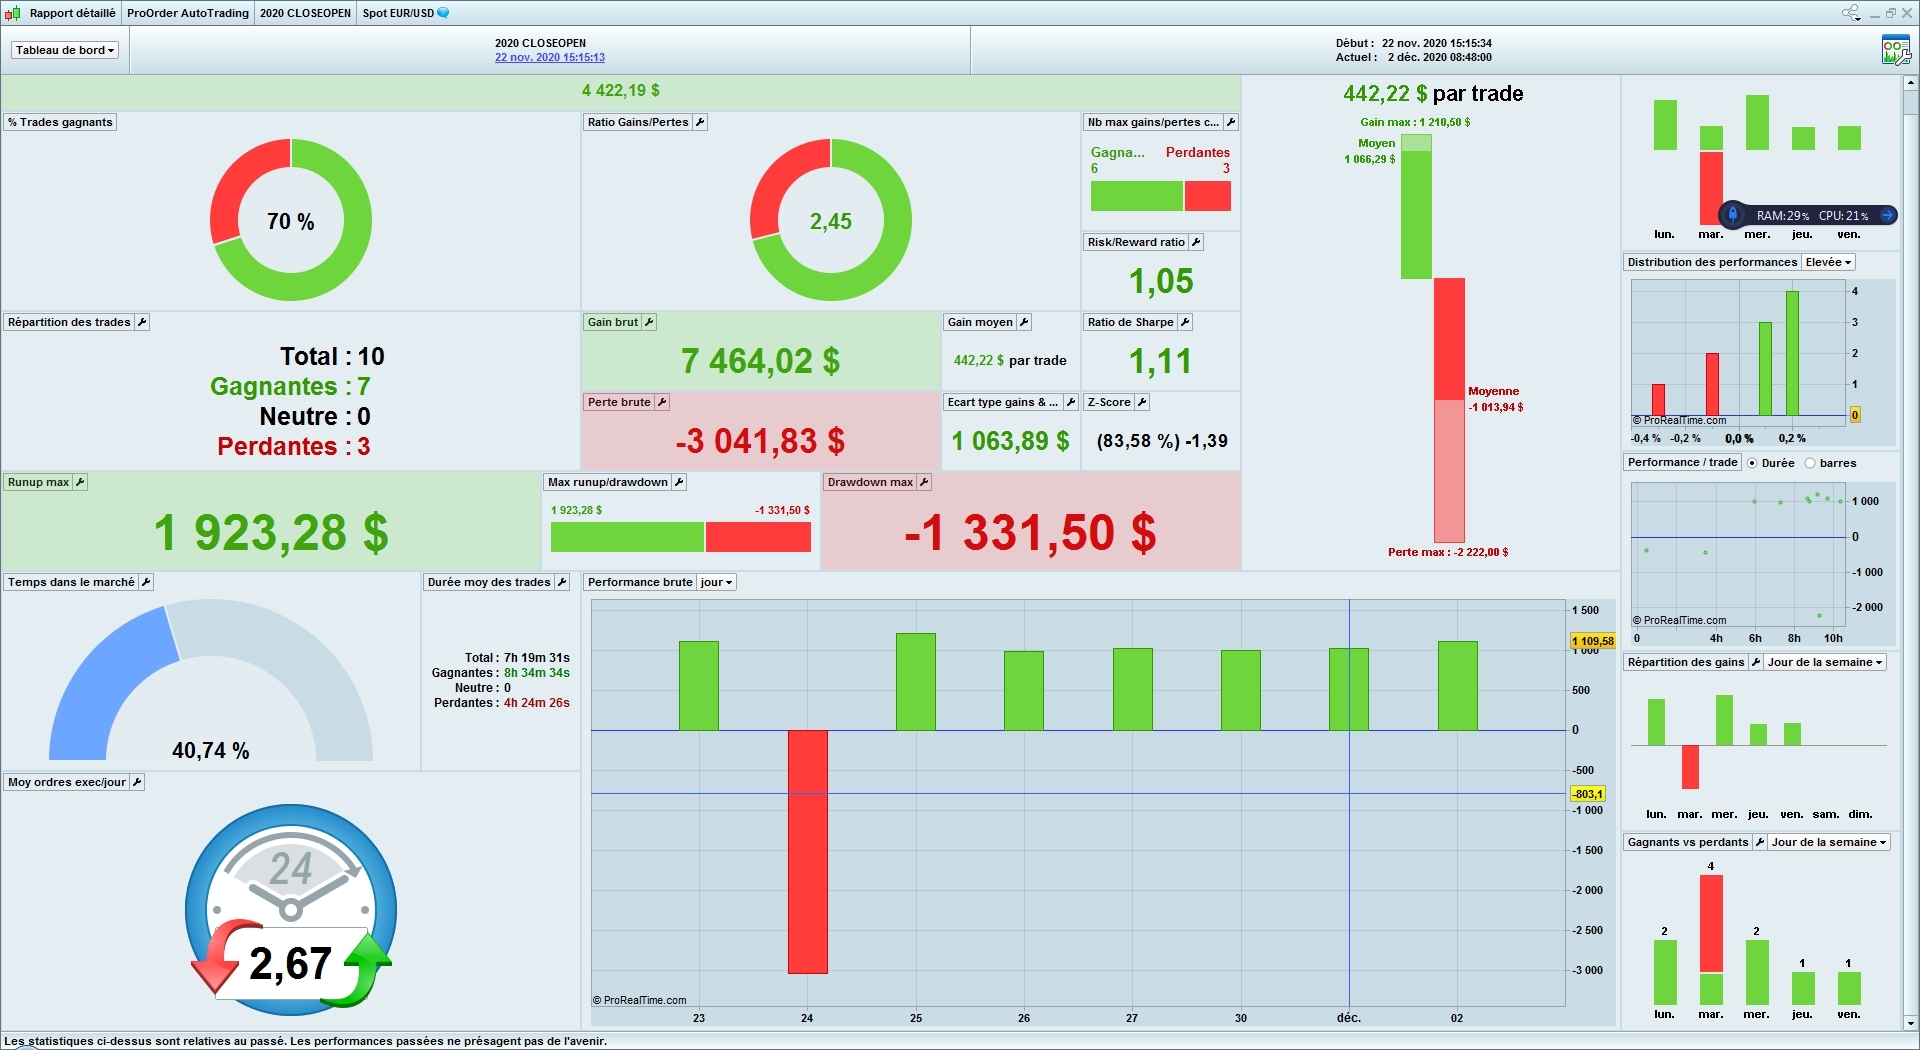
Well, new trial to explain what I do. On EUR/USD 1 mn Autoadapt Position sSizing (8-12 contracts) (VanTharp/Vince Method). The big red drop is the big drop on EUR/USD of this week
Sorry I put the pictures in the post to facilitate the “complex” explanations
Well, the goal is always to find the best factors/indicators.. who can predict a correlation between IS and OOS (If they exists !). remember the OOS results are the most important because it’s what you can win !
We have different ways obtain to OOS results with an algo
First, classical, we create an algo and put it in the Proorder Autotrading = paper trading and wait, wait, wait ..
As with this algo who begin on 8 november
Second is to do an IS backtest from 8 nov until today and see the results = OOS simulation
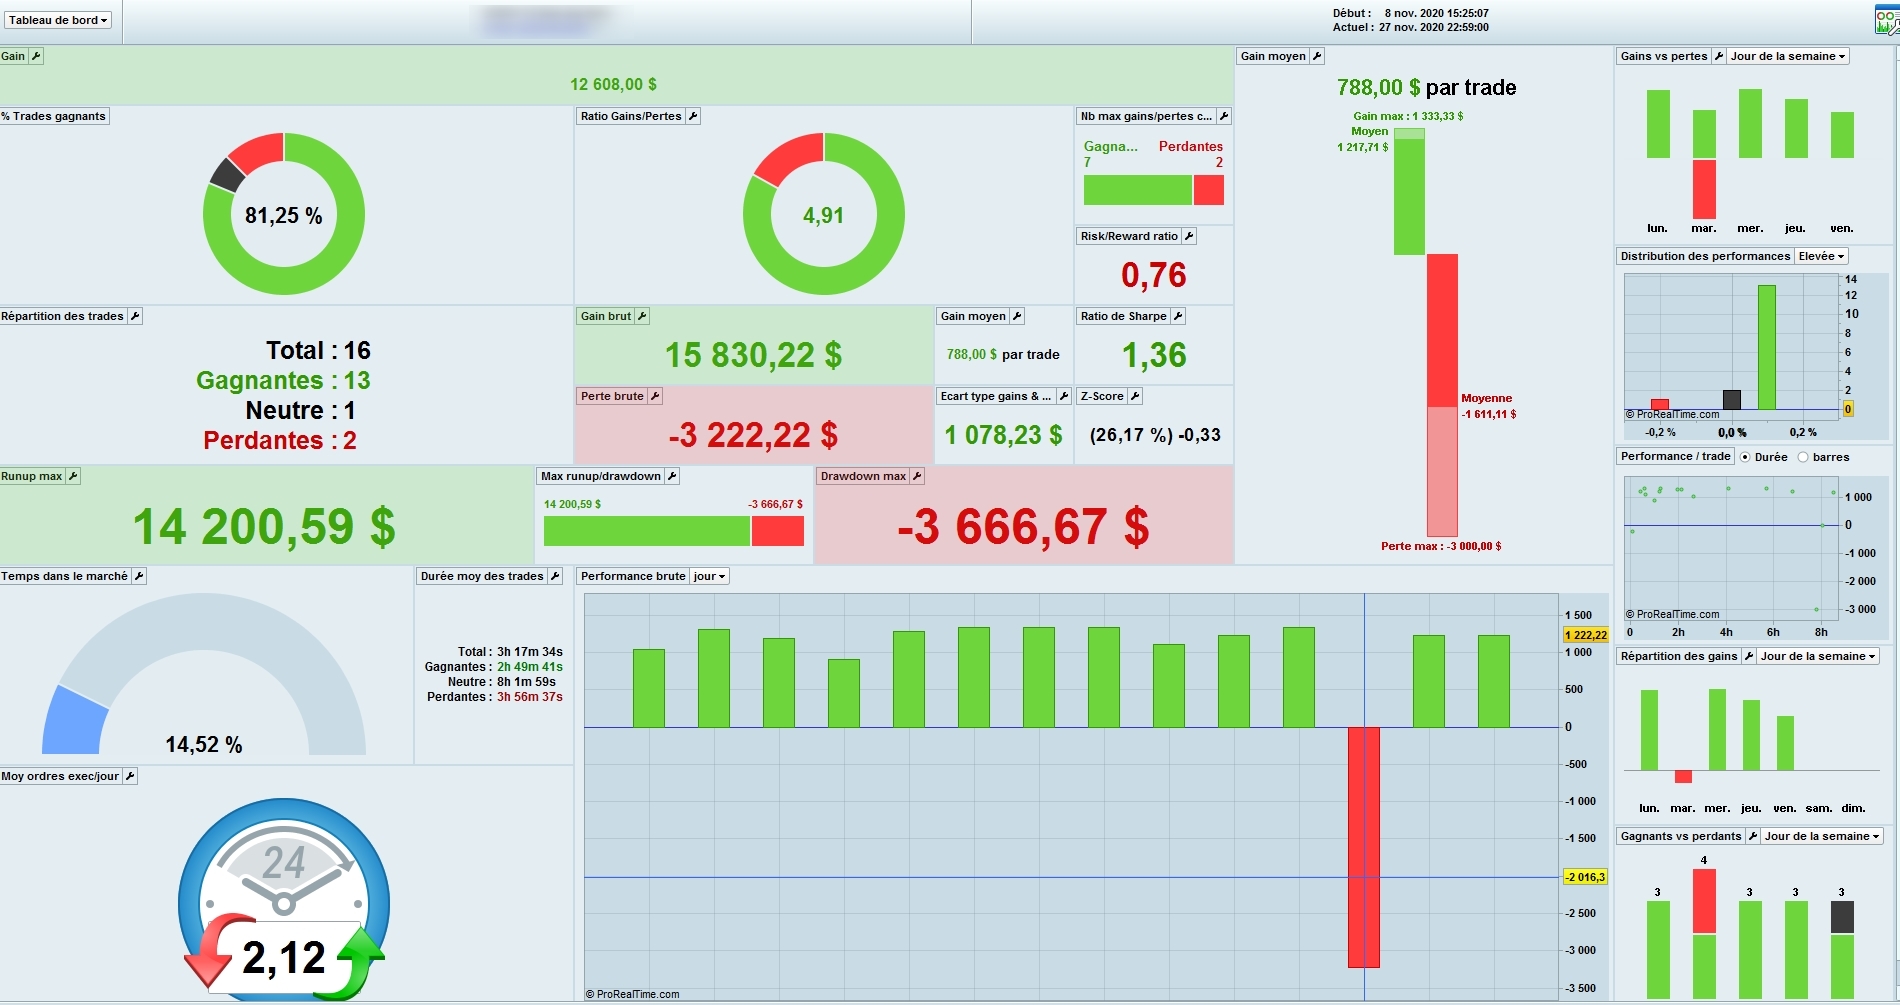
As you see OOS results on Live since 8 november are quite the same that backtest on IS since 8 novembre
But second take 10 seconds to obtain the results, and the first in live take 2 weeks…
[attachment file=”152080″]
[attachment file=”152081″]
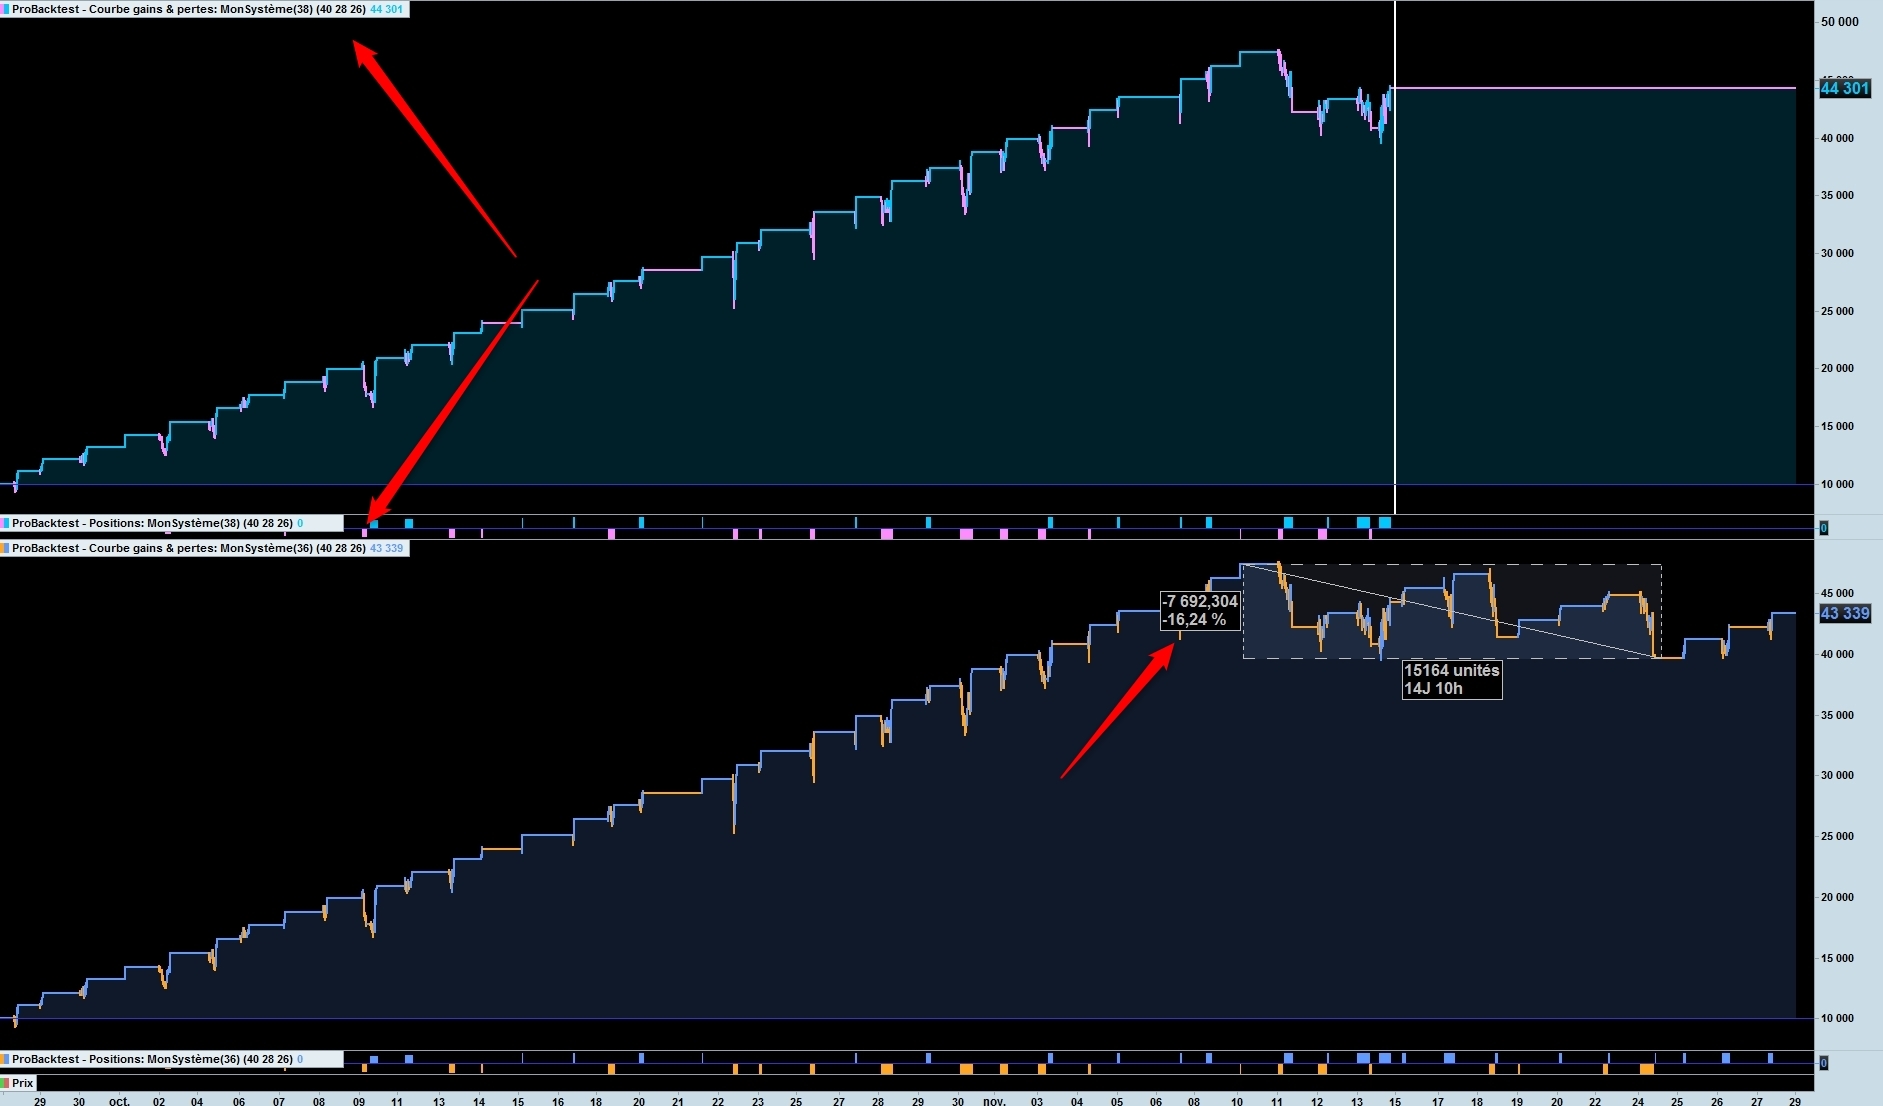
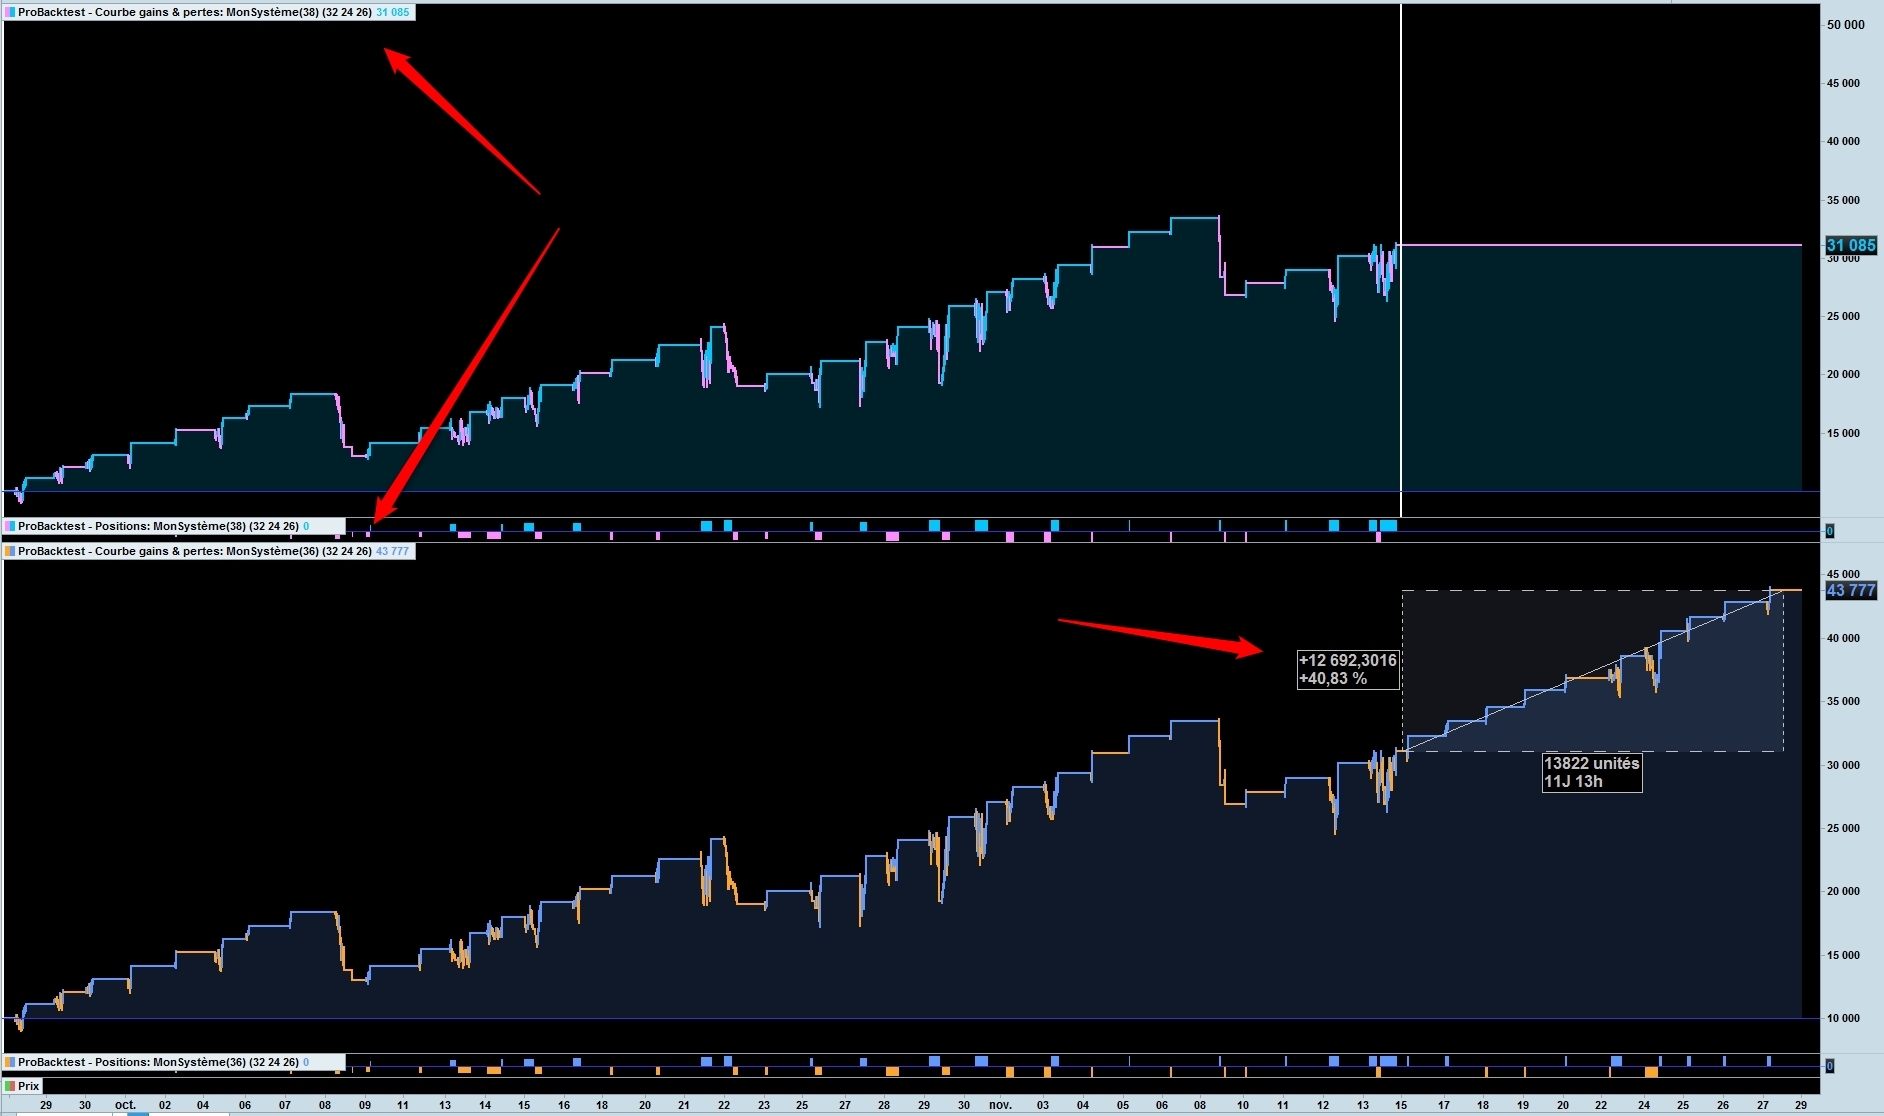
As I said in this post, I don’t know why but the first results in a backtest which stop on November 8 (With OOS results from November 8 until now) give the worst OOS results and the last the best OOS results ..
It is very very important because generally we take the first results, first variables, to put them on real (demo or not), but we are probably wrong
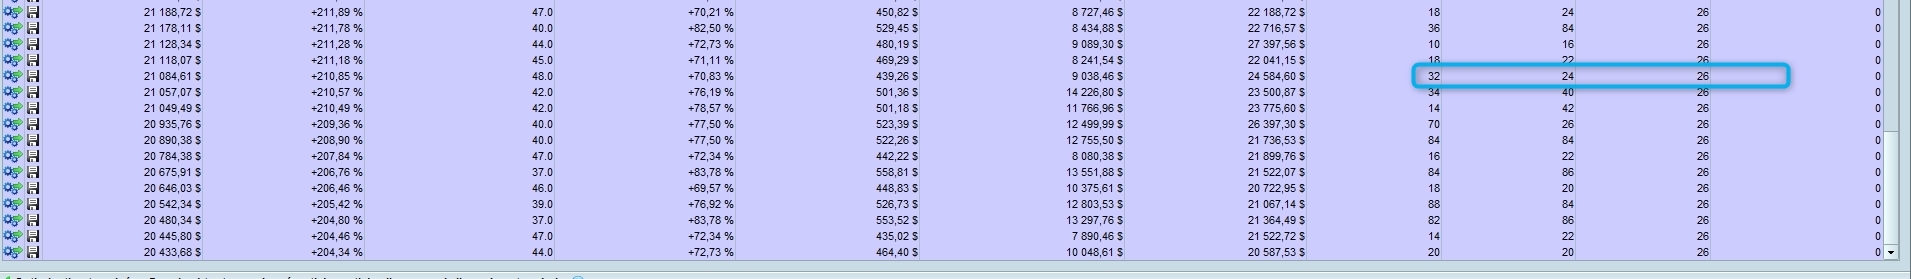
As you see on these pictures
The 3rd result (with very good curve fit !) with var1=40, var2=28, and var var3=26 give an OOS results (8/11 until now) of -16.24 % !!
[attachment file=”152084″]
[attachment file=”152085″]
But if you take on of the last results in the IS backtest (with very bad curvefit!) with the same variable you have an OOS results of +40 % !!!
[attachment file=”152086″]
[attachment file=”152087″]
Why ? I don’t know and it’s what I look for
Actually, I know, may be at 90-95 %, which variables will be in the 5 best OOS results BUT there are not necessary the one with the best variation
BUT, now, I don’t know which factors/stats/indicators should be see to “predict” the best variation (If they exists!). I have some good Ideas but not any conclusion now
To be continued
So we go back to the bit where I pointed out that you are just doing a very simple in sample test and then an out of sample test that includes some extra data. No rocket science involved and no special tricks for anyone to learn from then. Just a simple in sample and then a walk forward in to some previously untested data.
I would point out that the quantity of trades is tiny so not much can be learned from such small data samples which is why with such a strategy it is necessary to put it on live forward test and wait and wait and wait…. before you can get any truly worthwhile results to analyse.
In short, this topic will be of no use to anyone, it is a waste of time to read it.
@vonasi
I always say it’s like a one pass WF, it’s the first part and after, with EXCEL, we can do 80-90 automatic One pass and accelerate the analysis, find Pearson correlations and so on..
@fifi743
You’re right, it’s unncessary to know that most of people are wrong to select the first results on a IS backtest to use them on real, because first results are the worst 🙂
But after a bit of irony, you’re probably right I’ll stop wasting time, especially on a Sunday morning, to explain longer
Have a good day Guys, I continue my analysis ..
generally we take the first results, first variables, to put them on real (demo or not), but we are probably wrong
I spend ages trying different sets of results (usually from first 5 or 6) and I make judgements from viewing the respective Equity Curves and Detailed Reports.
Often – as you say – a far more preferable equity curve and stats is visible from NOT the top Gain result.
 Eric
EricParticipant
Master
Did some testing with a simple moving average crossover on 5 minute tf (as we all have done)
and by using the best variables out of sample i found that if i changed the tf to 3 or 1 minutes in sample the result was better almost every time than on 5 min tf
Small sample as i dont belive in this to work in real
Will you get a fill for 3000 contracts?? Have you ever traded 3000 contracts? Is it doable?
Slippage will be huge if the broker either allow that size! By the way, the margin required must be also be stratospheric. But if you have enough money and want to offer your broker a new Rolex with spread, just do it 😆 (sunday afternoon joke).
dont belive in this to work in real
You might be surprised!
One of the first things I do with Algos (shared on here by kind folk) is to try on other TF’s. Then I often run 2 or 3 variations in Demo Live and it can be that the ‘rogue’ TF will outperform the TF the Algo was intended for!
Similarly, if I have been running (my own or others Algo’s) on Live data and performance is dropping off, often I try on the next higher or lower TF and set it going as a variation on the original TF … and the rogue TF often outperforms with no other code changes.
I put above down to the market price action speed has changed and the rogue TF better suits this latest price action … until another change is needed to keep pace or even to slow down! 🙂
Life goes on with Donkey …
+44,22 % in OOS for now
To be continued
PS: The big red is the big drop last week
thanked this post