Hello! I am a new user of ProRealTime and I really need some help with programming. I have my own strategy that is based on Point and figure which I wish to use in auto trading. Anyone that has knowledge and could assist with this?
Many Thanks!
/Martin
>> Please update your country flag in your profile. Thank you 🙂 <<
Point and figure charts are not tradable with ProOrder like any other price charts not time dependent (renko, tick charts, etc.)
But I already made some simulation of point and figure candlesticks construction for customers to trade them automatically, and it works fine as far as I know (don’t trade these strategies myself). Anyway, please give us more details about the strategy and I’ll help the more I can.
I manually programmed a Renko strategy for DAX trading on the 1 min and 15 minute charts myself, and it turned out that Renko charts cannot be used for automated trading. This is because of an inherent priciple : The result depends entirely on the precise closing value of the FIRST bar chosen. So, for example, for the DAX this means you will get totally different results whether you start with an initial upper value fo your first Renko box of 11000.0 or 11001.0. This is because the Renko box size remains fixed to a certain value for the whole chart, and so values for e.g. the upper Renko limit of a box (10 points size) can be only 11010.0, 11020.0 or 11030.0 when starting with an initial value of 11000.0, or 11011.0, 11021.0 and 11031.0 when the first Renko box is started with a value of 11001.0. This may seem as a minor difference only, but it turns out it is not. Trading decisions in the course of a Renko system will entirely change their course for slightly different initial values of the first Renko box.
For point and figure charts I suppose it will be similar, because the box size in these charts remains fixed to a certain value througout the whole chart. So, everything depends exactly on the initial conditions that will never adapt to some convergent value as in most other indicators. Renko charts do look good optically, but cannot be used for defined trading.
Compare the ZigZag indicator ! It also looks perfect (in hindsight) but is in fact completely useless for trading, because it can change direction backwards during the chart evolution.
@verdi55
Are you talking about original renko charts of the PRT platform? If it’s the case, I’m agreeing with you about the fact that it is not tradable with its actual behavior. Renko bricks are disappearing even after their own previous construction and then rebuild themselves until the close of the bar of the chosen timeframe.
Of course, because of their construction, renko charts will never be the same from time to time, depending on when you start their construction. Renko trading, as point and figure, are pure price action way of displaying the price, IMO.
 Eric
EricParticipant
Master
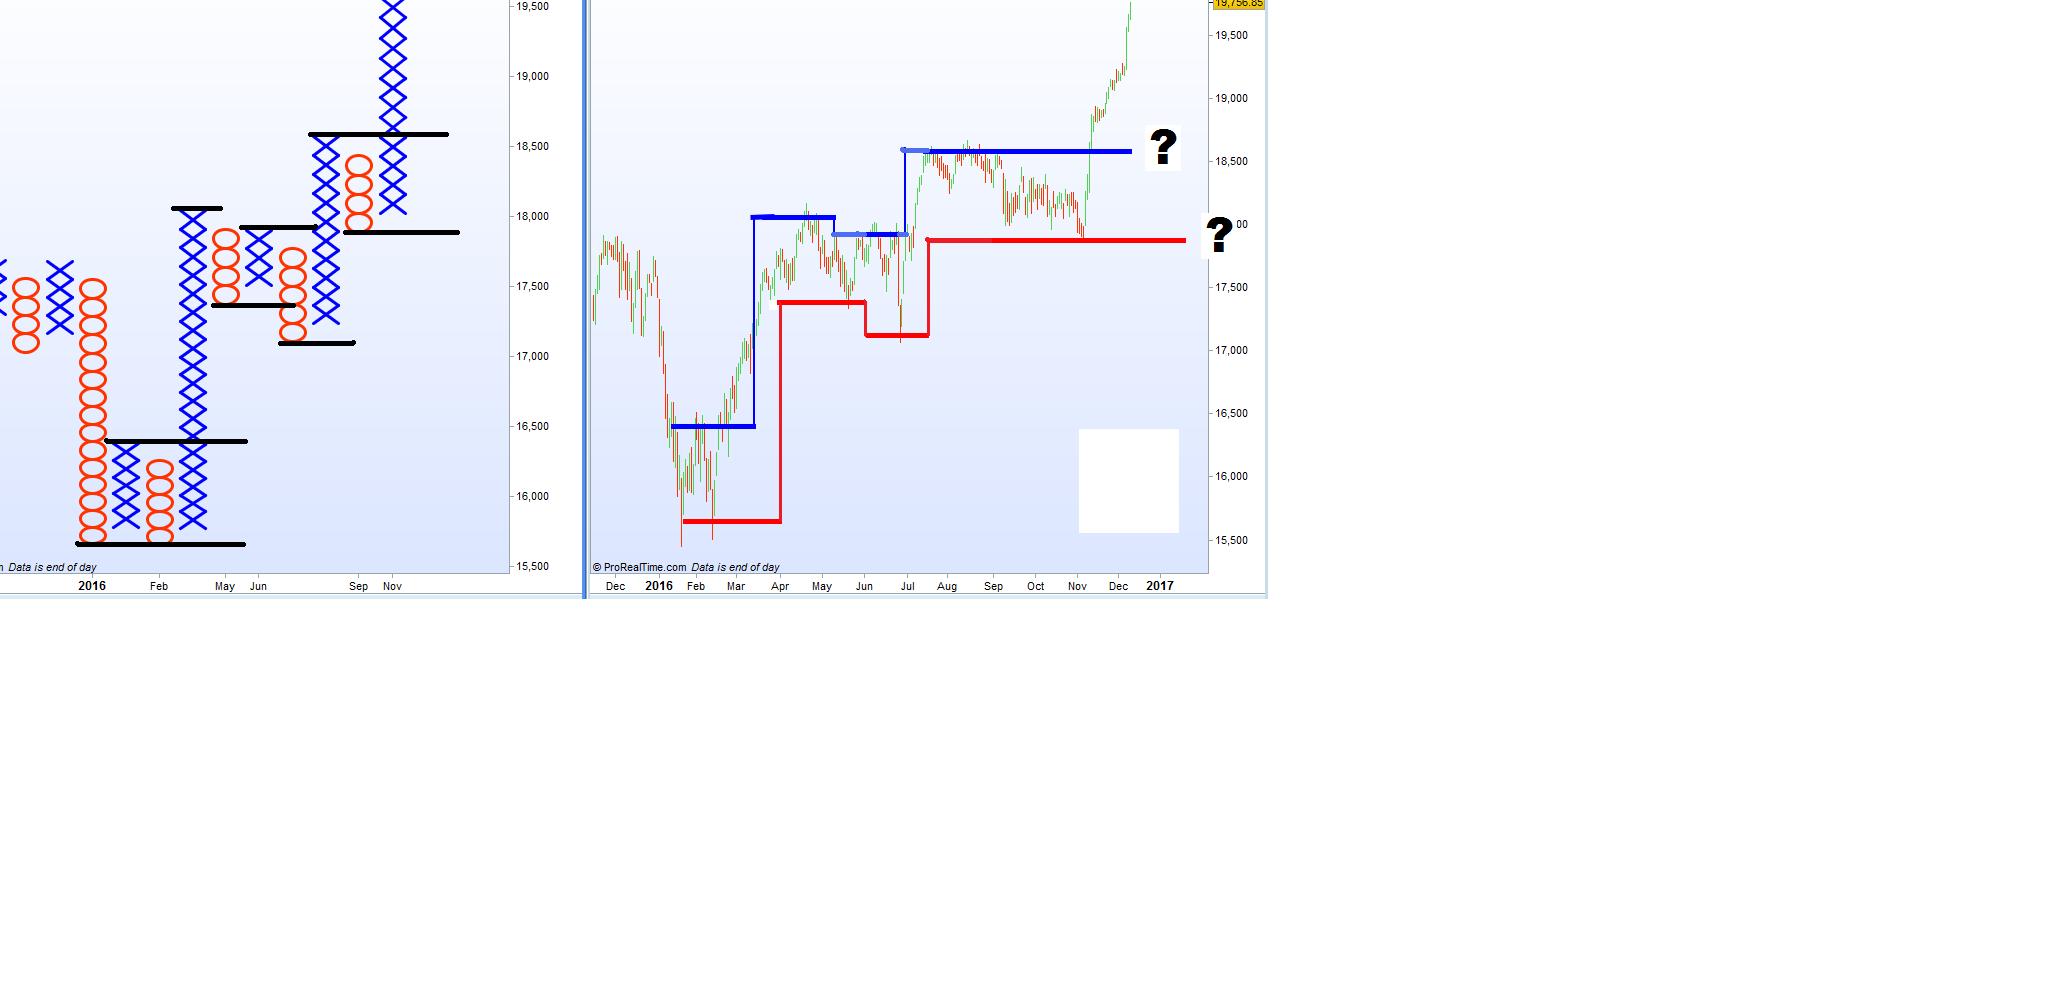
Maybe simple buy and sell would be possible by using the levels on a bar chart?
and maybe a binary indicator 1 when long and X in play and 0 for O?
(reversal amount, H,L or Close?)
No, I’m not talking about the built-in Renko charts (I think it is not possible to code a trading strategy with these, because there is no Renko command in the indicator list for backtests). But I programmed my own Renko charts (in the end totally identical to the built-in charts), and a trading system using the condition : Turn a position from long to short or from short to long after 2 Renko boxes have appeared in the other direction of the open position at the close of a bar. This is precisely defined, and in principle, there are only 2 variables : The borders of the very first Renko box at the beginning of the chart and the box size. It turned out that the result of this system at a fixed box size depends entirely on the position of the first box, as this fixes the borders of all other boxes for all times. So, Dax close 10.000 in the first bar gives a totally different result than, say, DAX close 10.001. Therefore, Renko charts cannot be used for trading, I think, although they look optically so good. It is all chance.
As it is often the case : You see a chart, and think : Wow, this must lead to big gains. Only after doing a precisely defined back-test, you can see if this is realistic or just chance.
You are right about the fact that it is not possible to trade automatically the renko charts (hope it will in the future..). But even if the renko charts can change a lot if you modify the step from only 1 point, there are some clues to make it more accurate and identical with other traders that use the same start of their construction, especially with intraday trading:
- Futures market open
- Round number
- Pivots levels of any time horizons
About the renko construction on time dependant charts you may have already found them, but here are some links on the website (indicators and strategies):
http://www.prorealcode.com/prorealtime-trading-strategies/renko-automated-trading-with-moving-average-on-candlesticks-chart/
http://www.prorealcode.com/prorealtime-indicators/median-renko-boxes-on-price/
http://www.prorealcode.com/prorealtime-indicators/renko-boxes-on-price-chart/
http://www.prorealcode.com/prorealtime-indicators/renko-bricks-on-chart/
It would be nice to discuss about the strategy you created and even try to improve it! 🙂
Special indicator to trade renko chart with automated trading strategy available here:
https://market.prorealcode.com/product/prt-renko/