







Renko automated trading with moving average on candlesticks chart
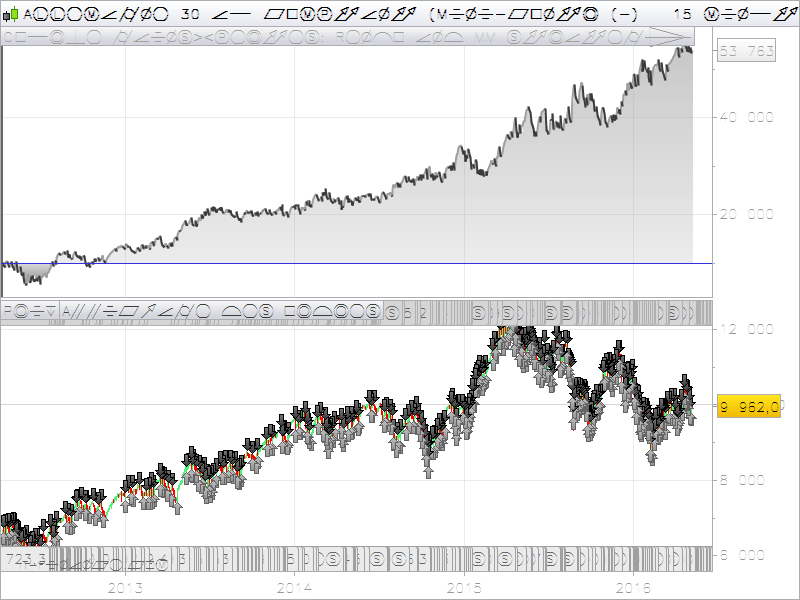
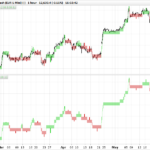
This automated trading strategy is built upon pseudo renko chart on ordinary candlesticks one.
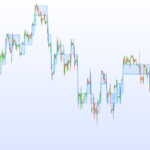
Originally coded by request on French forums, this strategy use a combination of the renko on chart indicator available here : http://www.prorealcode.com/prorealtime-indicators/renko-boxes-on-price-chart/ and a moving average built within the close of each renko brick. The strategy consist of a simple cross over of the renko close and the moving average.
This code seems to work well on DAX on a 15 minutes timeframe. I know renko don’t deal with time, but my simple test shows that conditions which are tested only one time per bar are giving good results on this timeframe. I don’t have test much on any other instrument or other timeframe though. But it would certainly be profitable with any other ones as there are only 2 parameters to set : the brick size (20 points default size) and the moving average period (20 periods by default), which are quiet common and may not be so curve fitted..
Test were made with 1 point spread.
defparam cumulateorders = false

bsize = 20 //renko size in points
mmperiod = 20 //moving average period
orderstime = 300 //minimum seconds between 2 orders

boxsize = bsize*pipsize

once topprice = close
once bottomprice = close - boxsize*pipsize*2

if(close > topprice + boxsize*2) THEN
 topprice = close
 bottomprice = topprice - boxsize*2
 barclose=topprice
ELSIF (close < bottomprice - boxsize*2) THEN
 bottomprice = close
 topprice = bottomprice + boxsize*2
 barclose = bottomprice
ELSE
 topprice = topprice
 bottomprice = bottomprice
ENDIF

mm = average[mmperiod](barclose)

if barclose=barclose[1] then
 mmRENKO = mmRENKO[1]
else
 mmRENKO = mm
endif

if barclose crosses over mmRENKO AND ABS(time-lasttime)>orderstime then
 BUY 1 SHARES AT MARKET
 EXITSHORT AT MARKET
 lasttime=time
endif

if barclose crosses under mmRENKO AND ABS(time-lasttime)>orderstime then
 SELLSHORT 1 SHARES AT MARKET
 SELL AT MARKET
 lasttime=time
endif
Comments
You must be logged in to post a comment.


I'm not trading it, this is a concept about trading renko bricks on price chart with ProOrder which is normally not possible with renko charts. Of course this strategy can be traded with the renko bricks size you want. About money management, you can add your request on forums and I'll answer your request there. Thank you.

Yes, I was talking of your strategy, and my own code. And the results are really different according to the box size. So I think that I can't bet on this strategy. Maybe with much improvemenets...
It's renko bricks size. 20 points mean nothing more than 13 or 17 ones! Also, please consider that renko bricks construction begin at the very first price of the loaded history, so 20 bricks size would have been completely different if history begin 10.000 bars ago than 12.000 bars.. Equity curve of a backtest is a line on a computer screen, there's so much more behind it.. ;)
Hi all, Hello Nicolas,
I've just coded another Renko strategy, with the same DAX M15 (to make a comparison)
Buy I have the same problem : the test is (very) positive only after 2013. Before, results are quite bad.
Do you have an idea : why ?
I wouldn't bet on a strategy that wins for only the last 2 years, whereas it wasn't profitable for the 5 years before...
Thanks for your advice.
Intraday randomish patterns, post subprimes crises, price random walk, curve fitted strategy maybe? Are you talking about this one or another one? Because this one haven't been tested by myself previous this date.
Also, renko bars are point fixed and reflect price movement (20 points here), which can be a serious parametric bias. I know some people like to adapt renko bar size with division of daily ATR, this is another idea of improvement.


Evening Nicolas,
Just had a quick look and backtesting a further 4 years to 2008 does not produce very good results.
I realise this system is very simple at this stage and not complete.
I do want to explore the use of renko on time based charts myself so this code will be helpful I'm sure.
Thanks.

Yes I think it would be the same as in real time trading, it not use any kind of takeprofit, stoploss or trailing stop, just stop and reverse orders and trade open and close cannot be in the same candle. The worst thing in this strategy is that you are always in the market and you have to deal with overnight fees which are not included. Spread are also larger in the evening on DAX. But this strategy were made by request on forum, I saw it could gave good results, so here it is. DAX was the opened chart when I coded this strategy, anyone can test it with any other instrument with different bricks size and moving average period, it can surely give an edge on fine equity elsewhere or be part of an automated trading strategies portfolio.
Hello Nicolas,
Nice Code ! I was just looking to make my own Renko system, because I think Renko is really profitable on the long term. My manual backtests on Renko show very profitable tests with acceptable drawdown, but I haven't test sufficient data.
I have my own trading rules for Renko, maybe I will post my own code when I create it.
Best regards,
Thanks. Graphical representations that rely only on price and not time are always more accurate (renko,range,tick bars). I encourage your research in this way :)
This system is only a simple price over moving average. The way I changed the moving average calculation to not take time into consideration would be adapted to any other indicators, such as Supertrend, RSI and so on..
Interesting code, thanks! It will provide me with a good starting point for further development and testing. One question: Why do you multiply boxsize by 2? I am sure there is a simple reason, but right now I am feeling thick-headed and not able to figure out why by myself. Wishing you a festive christmas season! /Fredrik