Good Day
I have been cheating on PRT with MetaTrader lately and spent a decent amount of time playing around with some of the indicators in their CodeBase.
I have used the time to develop an extremely robust trend following strategy based on some of these indicators that allows one to get onboard strong trends while filtering out potentially weak ones. Risk is also managed exceptionally well while at the same time optimizing take profit levels.
The indicators I am using is as follow:
1. Ichimoku Cloud with Kijun-Sen and Tenkan-Sen
2. Elder Auto Envelopes (https://www.mql5.com/en/code/16807)
3. Ehlers Inverse Fisher Transform (https://www.mql5.com/en/code/16777)
4. Ehlers Inverse Fisher Transform of RSI (https://www.mql5.com/en/code/16963)
5. Ehlers Fractal Dimensions (https://www.mql5.com/en/code/20580)
If some of my experienced fellow forum members are willing to translate these indicators, I will, in turn, code them into a very robust automated strategy using the rules I have established.
The rules of the strategy are rather complex, but in a nutshell, it comes down to the following:
- Only take trades in the direction of the color of the Elder Ribbon
- Validate the strength of the Elder Ribbon using the Ehlers Inverse Fisher Transform
- Check trend momentum using Ehlers Inverse Fisher Transform of RSI (has some rules of it’s own)
- Check trend strength using Ehlers Fractal Dimension (conditional rules apply)
- If we are below the cloud (and also above Tenkan-Sen and Kijun-Sen) and conditions 1-4 are validated take a long position and use a close below Tenkan-Sen as a stop (up until rule 6 becomes valid). The opposite would apply for short positions
- If we are in or above the cloud (and also above Tenkan-Sen and Kijun-Sen) and conditions 1-4 are validated take a long position as soon as we have a close below Tenkan-Sen (if rule 1-2 is still valid and Kijun-Sen is at least a couple of points below us). After a pullback to below Tenkan-Sen, rule 1 can be overruled by a strong rejection from either the Elder Ribbon or Kijun-Sen. The opposite would apply for short positions
- If we are in a long position and we have close below Kijun-Sen and Ehlers Inverse Fisher Transform is red, exit the trade and wait for re-confirmation of rule 6. The opposite would apply for short positions
- If in a long position, remain in the position as long as the Elder ribbon remains blue and the Ehlers Inverse Fisher Transform of RSI is not green. If the Ehlers Inverse Fisher Transform of RSI turns green and the Ehlers Inverse Fisher Transform turns red, then exit at the first close below Tenkan-Sen. The opposite would apply for short positions
- Additional rules apply when certain price action occurs at the 200MA
- Certain discretions can be used during a strong trend if price movement is particularly volatile
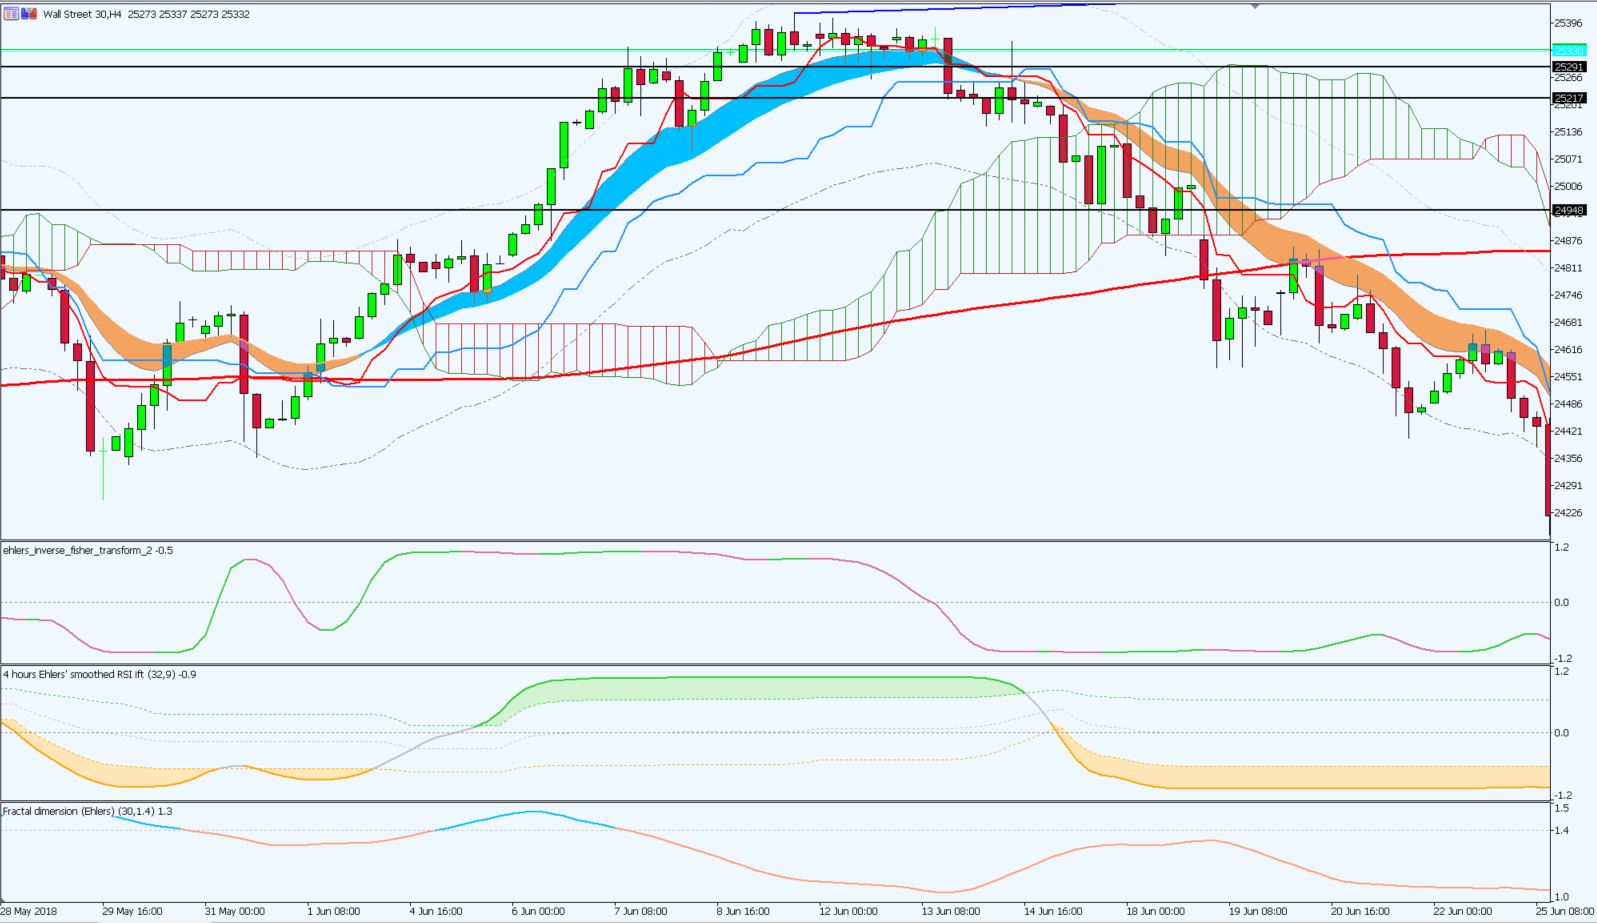
I have attached a picture of how the setup looks in MetaTrader.
For reference, I have elaborated the rules of the strategy to be as complete as I can now think of it.
- Only take trades in the direction of the color of the Elder Ribbon
- Validate the strength of the Elder Ribbon using the Ehlers Inverse Fisher Transform. Color must match the direction of the trade. i.e. green for long. Additionally, a sell signal above the 0 line will be stronger than one below it and vice versa.
- Check trend momentum using Ehlers Inverse Fisher Transform of RSI. We do not want to take longs if the indicator is overbought (i.e. green). The opposite would apply for short positions
- Check trend strength using Ehlers Fractal Dimension. Used in borderline cases to help make a decision (i.e. rule 6) on whether to wait for Tenkan-Sen pullback and/or if price breaks through the 200MA and we have to make a call on whether the re-test will hold or not.
- If we are below the cloud (and also above Tenkan-Sen and Kijun-Sen) and conditions 1-4 are validated take a long position and use a close below Tenkan-Sen as a stop (up until rule 6 becomes valid). The opposite would apply for short positions
- If we are above the cloud (and also above Tenkan-Sen and Kijun-Sen) and conditions 1-4 are validated take a long position if we are above the 200MA and the Ichimoku leading cloud points up. If not look to rule 7.
- If we are in or above the cloud (and also above Tenkan-Sen and Kijun-Sen) and conditions 1-4 are validated take a long position as soon as we have a close below Tenkan-Sen (if rule 1-3 is still valid and Kijun-Sen is at least a couple of points below us). After a pullback to below Tenkan-Sen, rule 2 can be overruled by a strong rejection from either the Elder Ribbon or Kijun-Sen if we remain above the cloud. The opposite would apply for short positions
- If we are in a long position and we have close below Kijun-Sen and Ehlers Inverse Fisher Transform is red, exit the trade and wait for re-confirmation of rule 7. The opposite would apply for short positions
- If in a long position, remain in the position as long as the Elder ribbon remains blue and the Ehlers Inverse Fisher Transform of RSI is not green. If the Ehlers Inverse Fisher Transform of RSI turns green and the Ehlers Inverse Fisher Transform turns red, then exit at the first close below Tenkan-Sen. The opposite would apply for short positions
- Only make one trade per trend i.e per Elder Ribbon color change
For sake of convenience, I have posted separate forum topics requesting the conversion of the Ehlers indicators above.
I also no longer require the conversion of the Elder Envelopes as I currently only make use of it’s two EMA’s
Firstly we could inventory all indicators already available:
1. Ichimoku Cloud with Kijun-Sen and Tenkan-Sen = OK
2. Elder Auto Envelopes
///variable pds = périodes de la moyenne exponentielle (défaut =22)
     ///variable pdsback = période du canal donchian (défaut = 44) (le double).


     //price field

     x = customclose
     //{ Envelope bands }
     Avg= ExponentialAverage[pds](x)
     hiAvg=Highest[pdsback](high)
     loAvg=Lowest[pdsback](low)
     ////////////////////////////////////////////////////////////////////////////////////
     if hiavg >=avg then

      shift= exponentialaverage[pds](hiavg -avg)
     else

      shift=exponentialaverage[pds](avg-loavg)

     endif


     ////////////////////////////////////////////////////////////////////////////
     UpperBand=Avg+shift
     LowerBand=Avg-shift


     /////////////////////////////////////////////////////////////


     return avg as "exponentielle",upperband as "bande haute",lowerband as" bande basse"


////////////////////////////////////////////fin///end ///code
3. Ehlers Inverse Fisher Transform = same as 4/ but with dynamic levels and many more RSI formula, are you sure you want this one too??
4. Ehlers Inverse Fisher Transform of RSI = https://www.prorealcode.com/prorealtime-indicators/inverse-fisher-transform-rsi/
5. Ehlers Fractal Dimensions = https://www.prorealcode.com/topic/ehlers-fractal-dimension-code-correction/
or https://www.prorealcode.com/prorealtime-indicators/fractal-dimension-index-fdi/
Could you please have a look at all these different versions, in order to not code what already exist! Good luck 😉
Please add a link to this thread instead in each of your post, as I would prefer to compile everything here where everything has started, thank you.
Hi Nicolas
I am very excited to get this strategy automated, as my manual backtesting has shown tremendous promise!
3. Ehlers Inverse Fisher Transform = same as 4/ but with dynamic levels and many more RSI formula, are you sure you want this one too?? Yes the dynamic levels are crucial, but I only require the RSX calculation formula
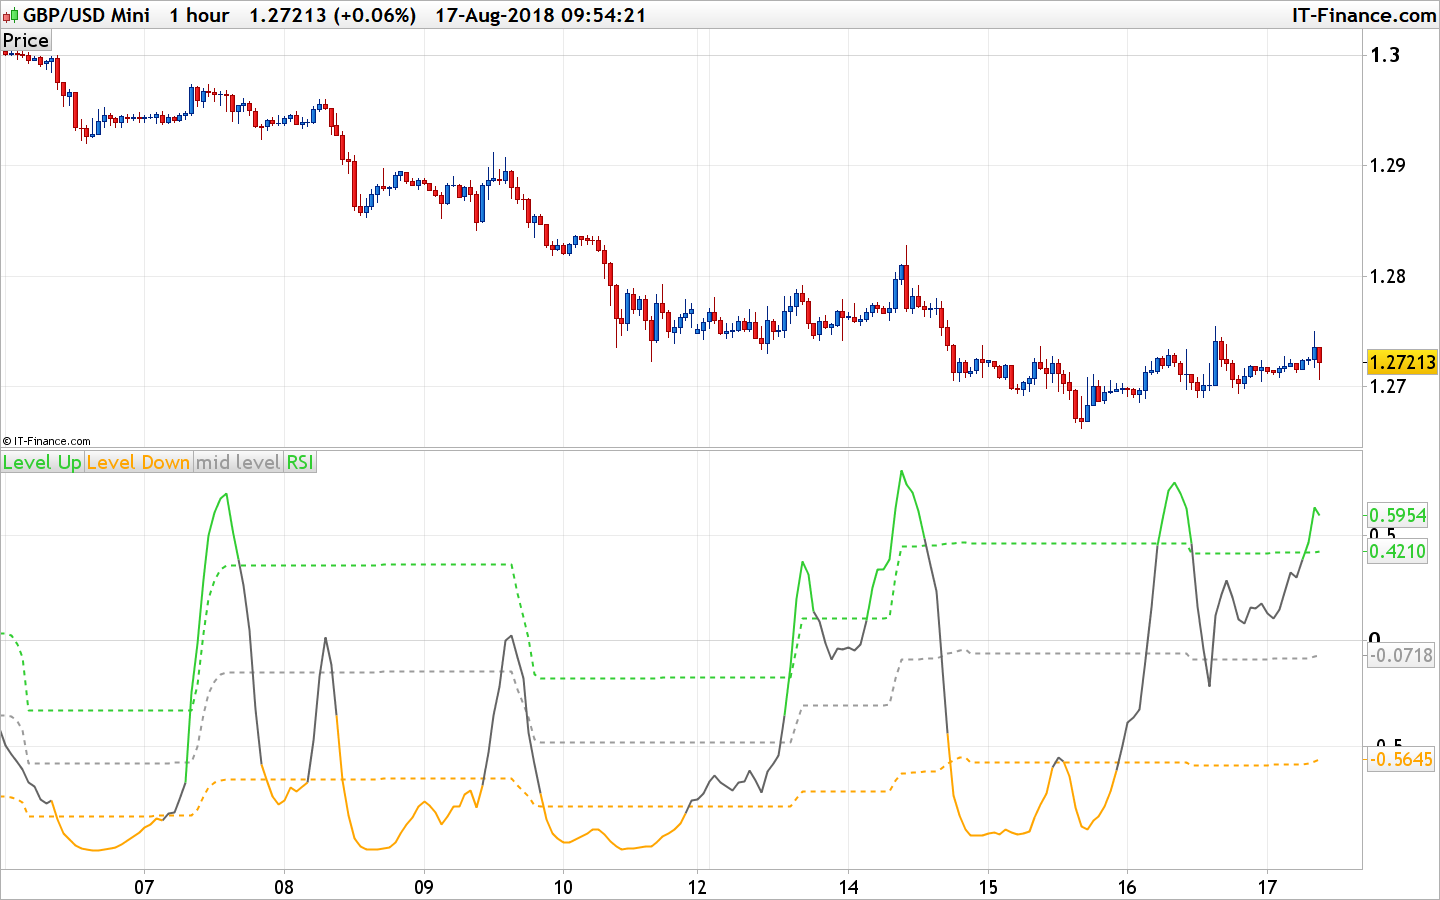
4. Ehlers Inverse Fisher Transform of RSI = https://www.prorealcode.com/prorealtime-indicators/inverse-fisher-transform-rsi/ I have looked at the indicator in the PRT library but it doesn’t give the same results as the mq5 version. Here I only require the ‘Ehlers Smoothed RSI’ calculation method, I would also like the corresponding color changes as this is key to the strategy.
5. Ehlers Fractal Dimensions = https://www.prorealcode.com/topic/ehlers-fractal-dimension-code-correction/ I have looked at this indicator in the library and compared the output to the MetaTrader version and although they seem to be close, they differ slightly from the one I have in MetaTrader. This could possibly be attributed to slight differences in Candle Closing times. But can I ask that you perhaps just double check the formula to be the same as the mq5 version?
Ok, I’ll have a look at 3/ first. Please do the backlinks to this thread in each of your other conversion request topic. Thank you.
Great Thanks. I did included backlinks to this thread in all three requests.
Looking very interesting, I will follow.
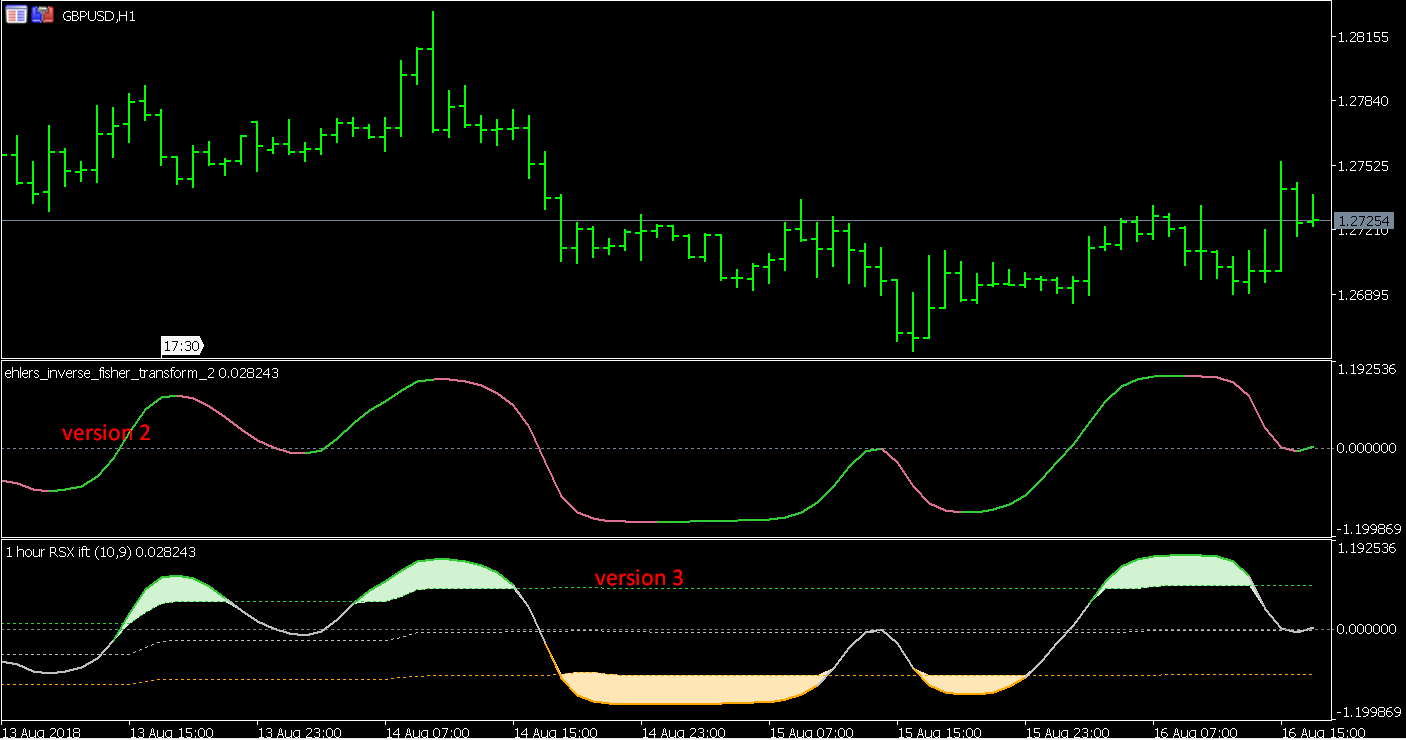
3/ and 4/ are the same indicators. I will code the 4/ (which is the version 3 of this indicator) with the RSI and RSX version in order to get the signals needed for the strategy.
Hi Nicolas, that is technically correct.
Just keep in mind the way in which they are colored is very crucial to the strategy.
It is just important for me to understand to understand how version 1 switches from red to green (as this is core and forms part of rule 2).
Other than that version two with both the ‘RSX’ and ‘Ehler Smoothed RSI’ calculation methods we will be good to go.
Nicolas, your version of Elder Auto Envelopes looks like a Bollinger Band, not a directional ribbon like MT4.
Am I wrong or what else?
Technically Elder’s Auto Envelopes are primarily upper and lower bands. It justs includes two EMA’s as well.
For this strategy, I simply use the EMA’s together with standard Bollinger Bands.
So, in reality, I don’t really use Elder’s Indicator at all.
The color change when the oscillator is ascending or descending, that’s all. I don’t know about the Elder’s Enveloppes, I just copy/paste a code found on the web, but it is definitely not a Bollinger Bands, just by looking at its code.
RSI version is done, let’s do RSX now…