CN
CNParticipant
Senior
@zilliq, that is still v2 as it looks…
 Pere
PereParticipant
Veteran
Zilliq: So you really think that V2 is better than V1, even when the “normal” results are better in V1? You really mean that results of V1 with WFE are worse than V2 with WFE?
I work with IG. Do you know how to start the WFE in PRT? Nicolas said that IG will put this WFE early, but I don’t know if they already did it.
Yes I tried only on V2. I don’t understand why V2 would be worst than V1 ? Generally the last versions of a system are better
@Petrus
I tried on IG and it works. Do an optimisation and you will see
The question is … what value is the WF results using out of the optimised results for 5 periods (if using 5 periods)? It can only be the average out of the 5 results?
Whereas for example, two of my 5 periods show optimised value figures different from the other 3 periods and in those two periods the WF results are not as good. So I conclude that in the two In Sample ‘bad periods’ there was an exceptional event that gave the outlier value. This value then did not give produce good WF % for the corresponding Out of Sample period due to the exceptional event not occuring in the Out of Sample period.
So to go forward Live, I am going to use the figure shown in the 3 periods (it’s the same figure for 3 periods) which give good WF %.
Walk Forward requires interpretation of the results (in my opinion) not just using the average figure thrown out by the Walk Forward engine.
I hope above starts a discussion? Maybe I should start a new Thread?
GraHal
@winnie37 you asked in #30628 … how to proceed to do a walk forward … do you need what to do to get WF working? Or is my #30691 above what you are looking for?
Maybe I’d best read below to see if I can learn any more? 🙂 I got WF yesterday and just clicked the buttons to get it going (easy) and then thought about what the results are telling me.
https://www.prorealcode.com/blog/learning/strategy-optimisation-walk-analysis/
Also Nicolas has done the video below in French.
https://www.prorealcode.com/blog/video-tutorials/analyse-walk-forward-prorealtime/
Cheers
GraHal
PereParticipant
Veteran
Well, the answer is simple:
V1 shows in demo the last trade with a gain of 3583€ during 21 days, while V2 shows only 904,80€ during 11 days.
V1 has only two trades this year, with gains of 1160€ and 3583€, while V2 has three trades in the same period, two of them with gains of 741€ and 904,80€ and one loss of 2165€, so a total loss of 519,20€.
Anyone has these results in life?
@Grahal
Hi,
All optimized variables are good in fact.
WF IS NOT to determine optimized variable (Forget the variable he used in the results), as we do in an “normal” optimization=Non WF
WF is ONLY to determine if an optimization at equal interval can be profitable with the system
That’s why we need WFE>50 %, more than 3/5 period with >50 % , final in gain and so on…
Zilliq
Hi Zilliq, thanks
I’ll use an example …
WF produces 5 values, 1 each for 5 periods all different from each other (say 3, 5, 7, 12, 14)
AND this Value is
Different than the optimum value (say 10) produced during a nonWF / normal optimisation (for whole period from start to finish of 5 periods).
What use is the WF% (for values 3, 5, 7, 12, 14) if I then go and use value 10 in my Live System?
GraHal
Btw for my example above, assume all 5 periods are > 50% WF %.
I will anticipate your answer (maybe?) … I guess the 5 different WF values are telling me I need to optimise regularly?
So then, with value 14 being the most recent WF figure (and also shows a healthy WF% > 50%) do I use value 14 to go Live with?
OR
Do I use the average of all 5 periods for WF – value 8 – but keep optimising every x period (x = In Sample period for 5 periods in original WF)?
Thank You
GraHal
Simply use the last Optimize variable for the next period
Remember WF is ONLY to see if you can win in the next period when you optimize your system
We don’t see the future but if you have a WFE>50 % you have a much higher probability than if WFE<50 %
Another way : if you have a WFE>50 % you have a high chance than your optimization will be reproductible
I’m pretty sure than the vast majority of the system on PRT or others on the Net don’t pass the WF test…
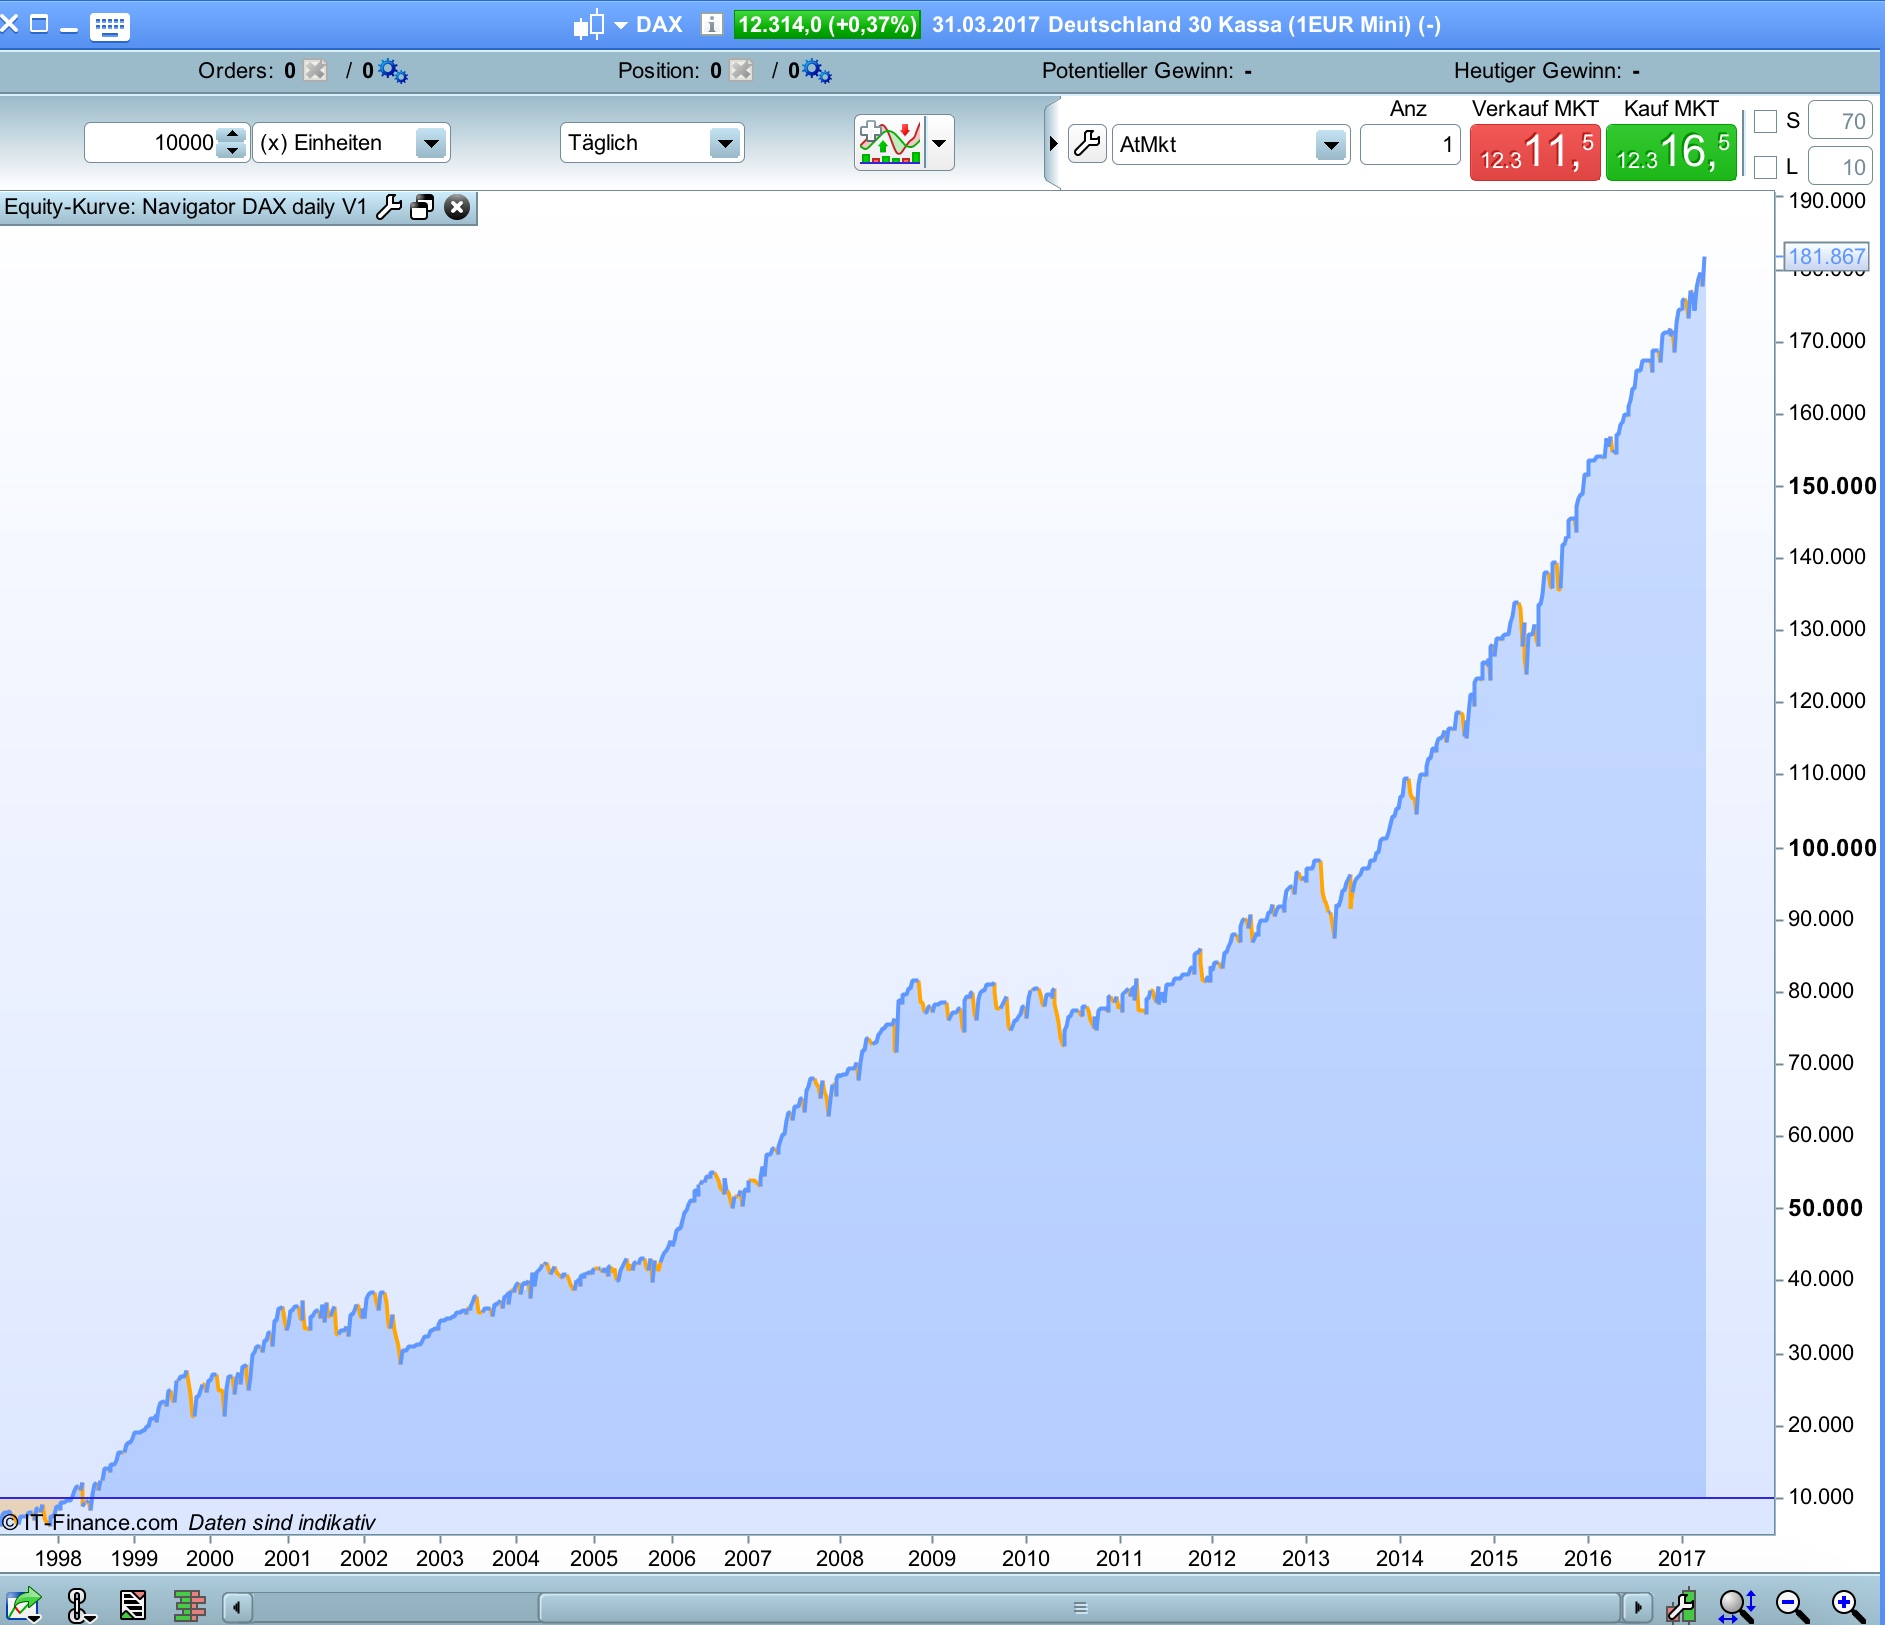
I wanted to know if the DAX tdom’s are stable for a longer period (20 years).
I migrated Navigator DAX H4 V1 version for daily timeframe and the result confirm the tdom of 1 (sell) and 8 (buy).
In the code the daily version buy tdom is 9 but in a daily timeframe this at 1.00 pm and it’s more or less the same as 8 and 17 CET in H4.
It’s interesting that this simply idea works so good for the last 20 years. Draw is unfortunately high.
@zilliq you say … use the last Optimize variable for the next period … so in my example where the WF 5 periods In Sample Optimised values are 3, 5, 7, 12, 14, you are saying to use variable value 14 to go Live with? Accepting that the value 14 has a good WF% > 50%.
Thanks
GraHal
@Grahal
Just tried it now and it works thanks!
I was thinking that it was to do with the times not working with the 4H timeframe but didn’t notice the time on line 62, thanks!
both systems have opened positions .
i would like to add to code system a line with “graph ” that will use to see the take profit and stop loss .
i ve tried different ideas but nothing works really .
does anybody have an idea