

Strategy optimisation with Walk Forward analysis
Category:
Platform
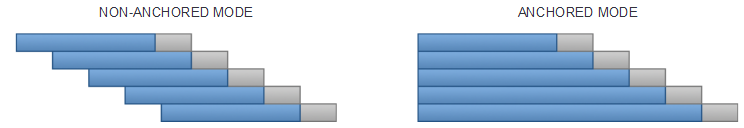
Walk Forward analysis allows you to optimize a trading system and to validate its robustness and stability over time.First, the walk forward analysis optimizes a set of variables on an initial period called “in-sample data”, then it tests the best parameters on the following period called “out of sample data”, and repeats the process by shifting forward the time windows. The optimization periods (in-sample) may have a single starting point (Anchored mode), or different starting points (Non-anchored mode).
By comparing the results of these 2 periods, the method allows you to:
- Check that the performance of the strategy on the optimization periods (in-sample data: shown in blue) are consistent with the test periods (out-of-sample data: shown in grey). This avoids the risk of “overfitting”
- Check how the strategy behaves in changing market conditions
- Test the strength of the strategy on past data
Practical example of Walk Forward analysis
This section shows how to optimize an existing trading system using the Walk Forward method.
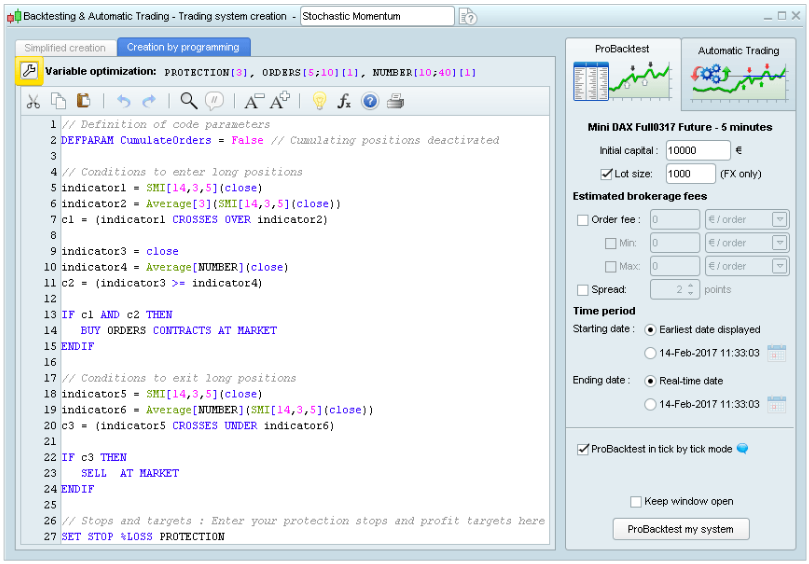
First click on the ‘wrench’ button at the top of the code editor window shown below.
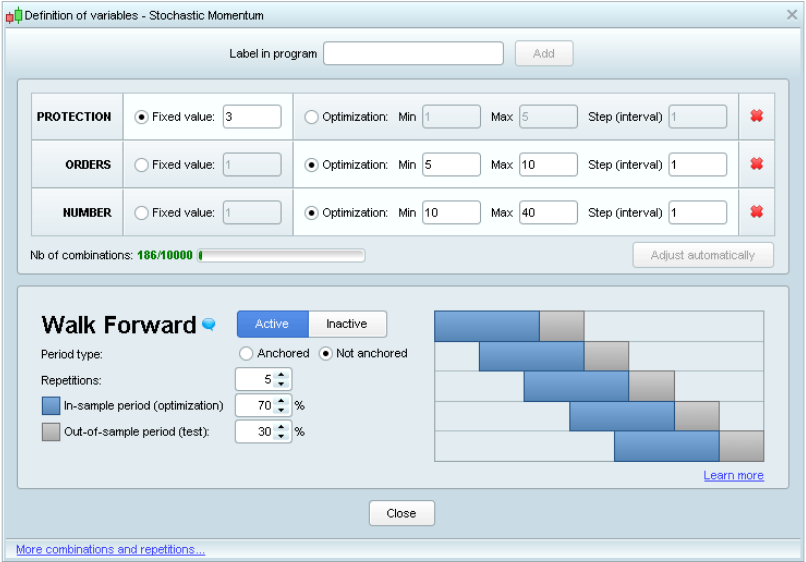
The window below will then appear. Once your variables are defined, you can activate the Walk Forward method by clicking on the “Active” button and choose the Walk Forward parameters. Select Non Anchored mode for different starting points, or Anchored mode for a single starting point for all test repetitions.
You can also define the number of Walk Forward repetitions (one repetition consists in optimizing the parameters on the optimization period and testing the best set on the test period), and the ratio between the optimization period and the test period.
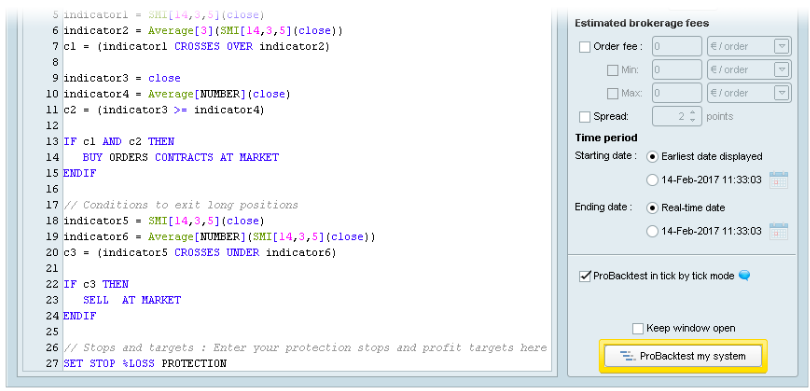
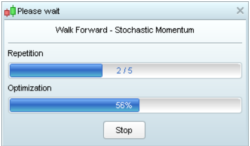
Once the parameters are defined, close the window above and launch the Walk Forward analysis by clicking on “ProBacktest my system”.
During the Walk Forward analysis, the platform starts by optimizing the strategy on a first sample to determine the set of variables that generates the highest performance. Then the performance of this set is evaluated on an additional sample that was not included in the optimization sample. The process is repeated 5 times. The aim is to determine whether the optimal set of variables has generated consistent or greater performances in different market conditions.
Depending on the number of variables and repetitions, the calculation can be more or less complex. The backtest execution time will depend on this complexity.
After calculation, a chart containing an equity curve will be displayed together with the detailed report of the system performance. In addition to the usual detailed report tabs, an additional Walk Forward tab compares the results for each test repetition.
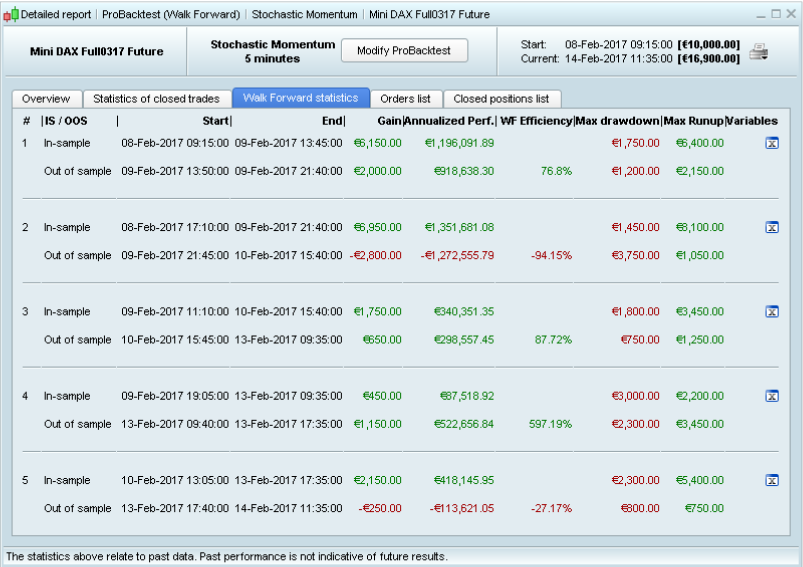
In order to determine if the strategy is robust, the WFE ratio (or Walk Forward ratio) compares the annualized gain of the test period (out-of-sample) to the annualized gain of the optimization period (in-sample). A ratio above 50 or 60% is necessary to consider that the strategy is not over-optimized.
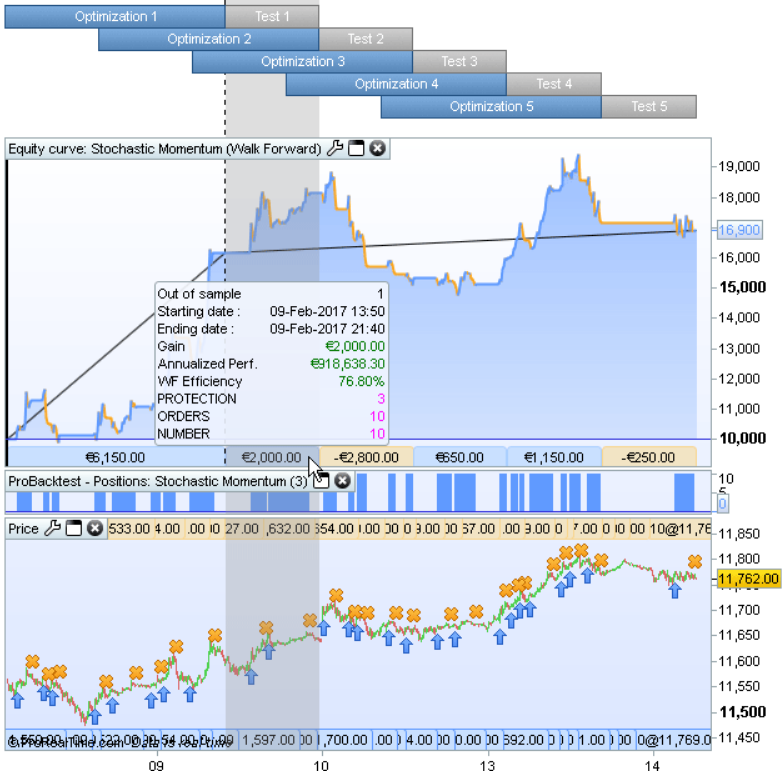
The equity curve aggregates and displays the first in-sample (or optimization) period and the 5 out-of-sample (or test) periods on the chart.
When moving your mouse over the lower bands, the corresponding period will be highlighted with the parameters used, along with the performances of this time period. On the above screenshot, the mouse is over the first test period. The values shown above for the variables PROTECTION, ORDERS, and NUMBER gave the best results during the 1st
optimization period (in-sample #1) and were then applied on the test period (out-of-sample #1), resulting in a gain of 2,000 € during test period #1 (highlighted in the image above).
(this article is a copy/paste of the ProOrder documentation, I will make videos later to explain it better).
Loading...