Leavitt Convolution & Acceleration by Cryptorhythms da Tradingview

Forums ProRealTime forum Italiano Supporto ProBuilder Leavitt Convolution & Acceleration by Cryptorhythms da Tradingview

Viewing 1 post (of 1 total)
  • #119761

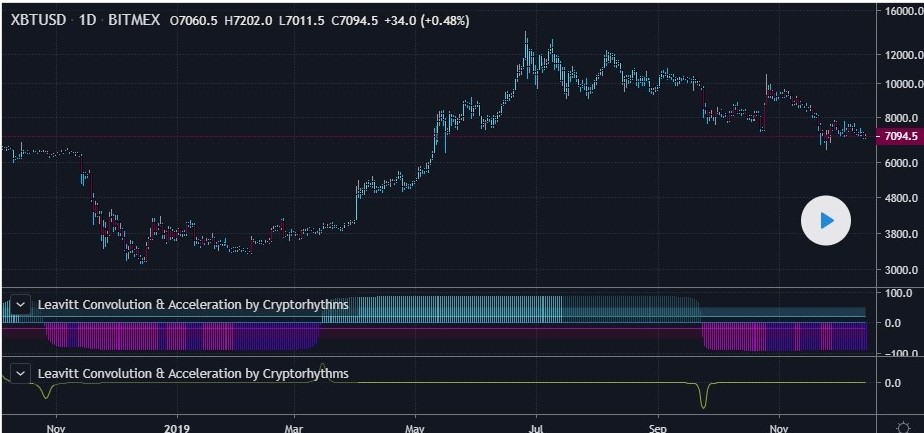
    Buongiorno a Tutti. E’ possibile convertire l’indicatore Leavitt Convolution & Acceleration by Cryptorhythms riportato da Tradingview a questo link:

    https://www.tradingview.com/script/4tdsuPkT-Leavitt-Convolution-Acceleration-by-Cryptorhythms/

    Questo è il codice:

    //@version=4
    // This source code is subject to the terms of the Mozilla Public License 2.0 at https://mozilla.org/MPL/2.0/
    // © theheirophant 12/3/2018
    study(“Leavitt Convolution & Acceleration by Cryptorhythms”)

    //settings
    yes5 = input(title=”Plot Acceleration?”, type=input.bool, defval=false)
    yes1 = input(title=”Enable Bar Color by Trade?”, type=input.bool, defval=true)
    plotInput = input(title=”❓ Divergence Display: Histogram or Columns”, defval=”Histogram”, options=[“Histogram”, “Columns”])
    length = input(61, “Lookback Length”)
    src = input(close, “Source/Series”)
    yes0 = input(title=”Enable Overbought / Oversold Zones?”, type=input.bool, defval=true)
    overBought = input(20, “Overbought Threshold”)
    overSold = input(-20, “Oversold Threshold”)
    mlength = input(3, “Acceleration Lookback”)
    multiplier = input(2.5, “Overbought/Oversold zone area multiplier”)

    //functions
    getSlope(series) =>
    rad2degree = 180 / 3.14159265359
    slopeD = rad2degree * atan((series[0] – nz(series[length])) / length)
    slopeD

    leavittProjection(src, length) =>
    lP = linreg(src, length, -1)
    lP

    leavittConv(src, length) =>
    lenConv = round(sqrt(length))
    leavittConv = linreg(leavittProjection(src, length), lenConv, -1)
    leavittConv

    leavittConvSlope(src, length) =>
    lCS = getSlope(leavittConv(src, length))
    lCS

    LCSlope = leavittConvSlope(src, length)

    //plots

    plotColor = LCSlope < 0 ? LCSlope[1] < LCSlope ? #5900F3 : #ED00FF : LCSlope > 0 ? LCSlope[1] < LCSlope ? #6CDEF1 : #275B6C : color.yellow plotStyle = plotInput == "Columns" ? plot.style_columns : plot.style_histogram p1 = plot(yes0 and not yes5 ? multiplier * overBought : na, color=#51CFEE, transp=100) p2 = plot(yes0 and not yes5 ? multiplier * overSold : na, color=#FF02FF, transp=100) p3 = plot(yes0 and not yes5 ? overBought : na, "OverBought", color=#51CFEE) p4 = plot(yes0 and not yes5 ? overSold : na, "OverSold", color=#FF02FF) fill(p3, p1, color=#51CFEE, transp=80) fill(p4, p2, color=#770043, transp=80) plot(yes5 ? na : LCSlope, style=plotStyle, color=plotColor) mom_1 = mom(LCSlope, mlength) plot(yes5 ? mom_1 : na, color=color.yellow) plot(yes5 ? na : 0) //Long/Short Condition - Something I added, **not** financial advice just an example. DYOR. crossunder_1 = crossunder(LCSlope, overBought) crossunder_2 = crossunder(LCSlope, multiplier * overBought) crossunder_3 = crossunder(LCSlope, 0) long = yes0 ? crossunder_1 or crossunder_2 : crossunder_3 crossover_1 = crossover(LCSlope, overSold) crossover_2 = crossover(LCSlope, multiplier * overSold) crossover_3 = crossover(LCSlope, 0) short = yes0 ? crossover_1 or crossover_2 : crossover_3 //Trade State Bar Coloration - Something I added barssince_1 = barssince(long) barssince_2 = barssince(short) barcolor(yes1 and not yes5 ? barssince_1 > barssince_2 ? #51CFEE : #770043 : na)

    Grazie fin d’ora.

Viewing 1 post (of 1 total)

Create your free account now and post your request to benefit from the help of the community
Register or Login