Indicators use 24hrs and NOT just Trade Hrs Bars > how fix these wrong signals ?

Forums ProRealTime English forum ProBuilder support Indicators use 24hrs and NOT just Trade Hrs Bars > how fix these wrong signals ?

Viewing 15 posts - 1 through 15 (of 28 total)
  • #198461

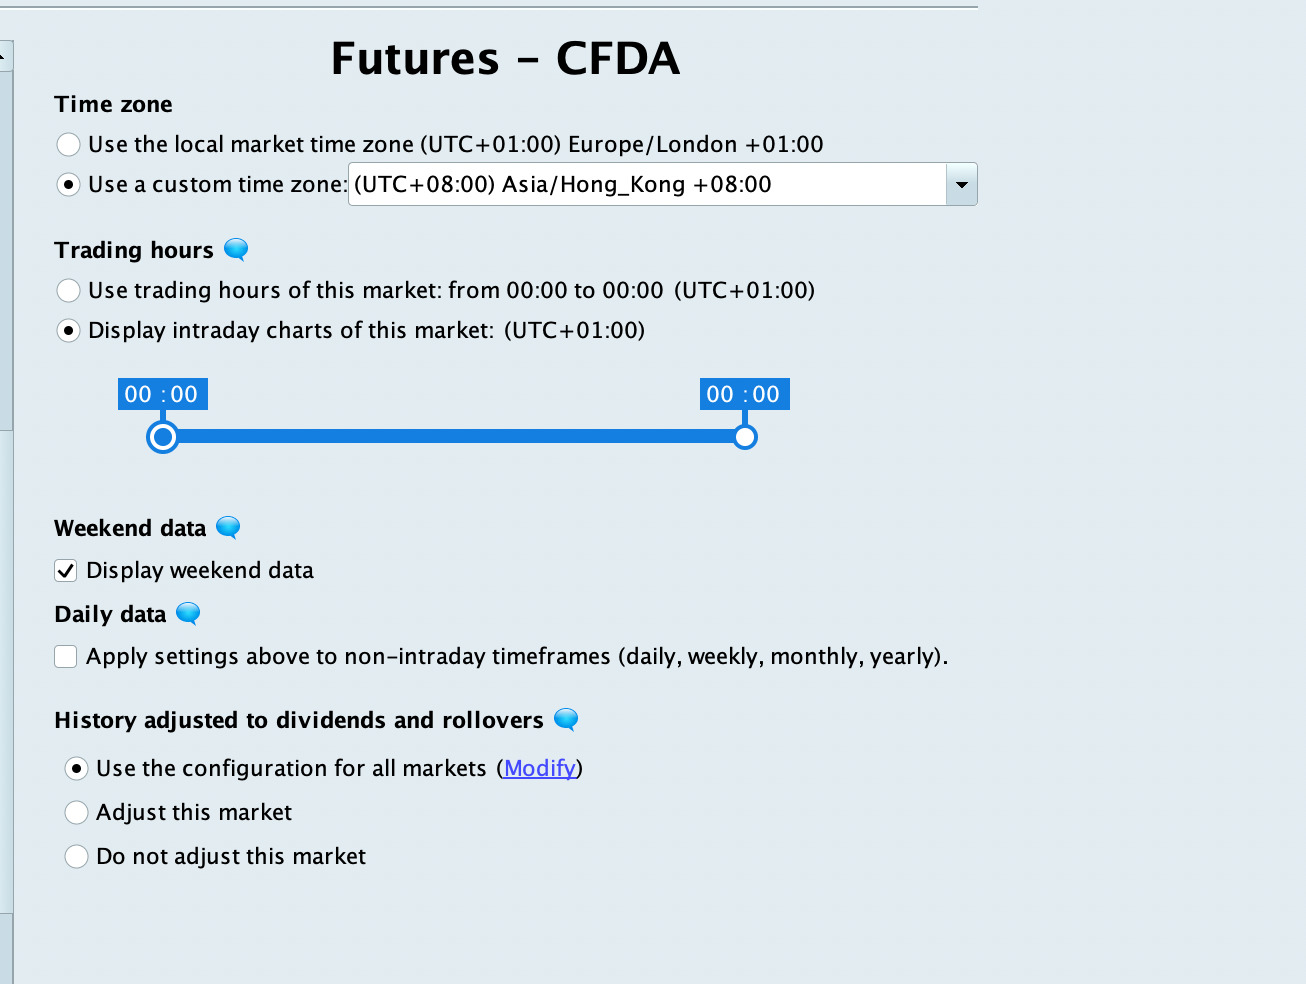
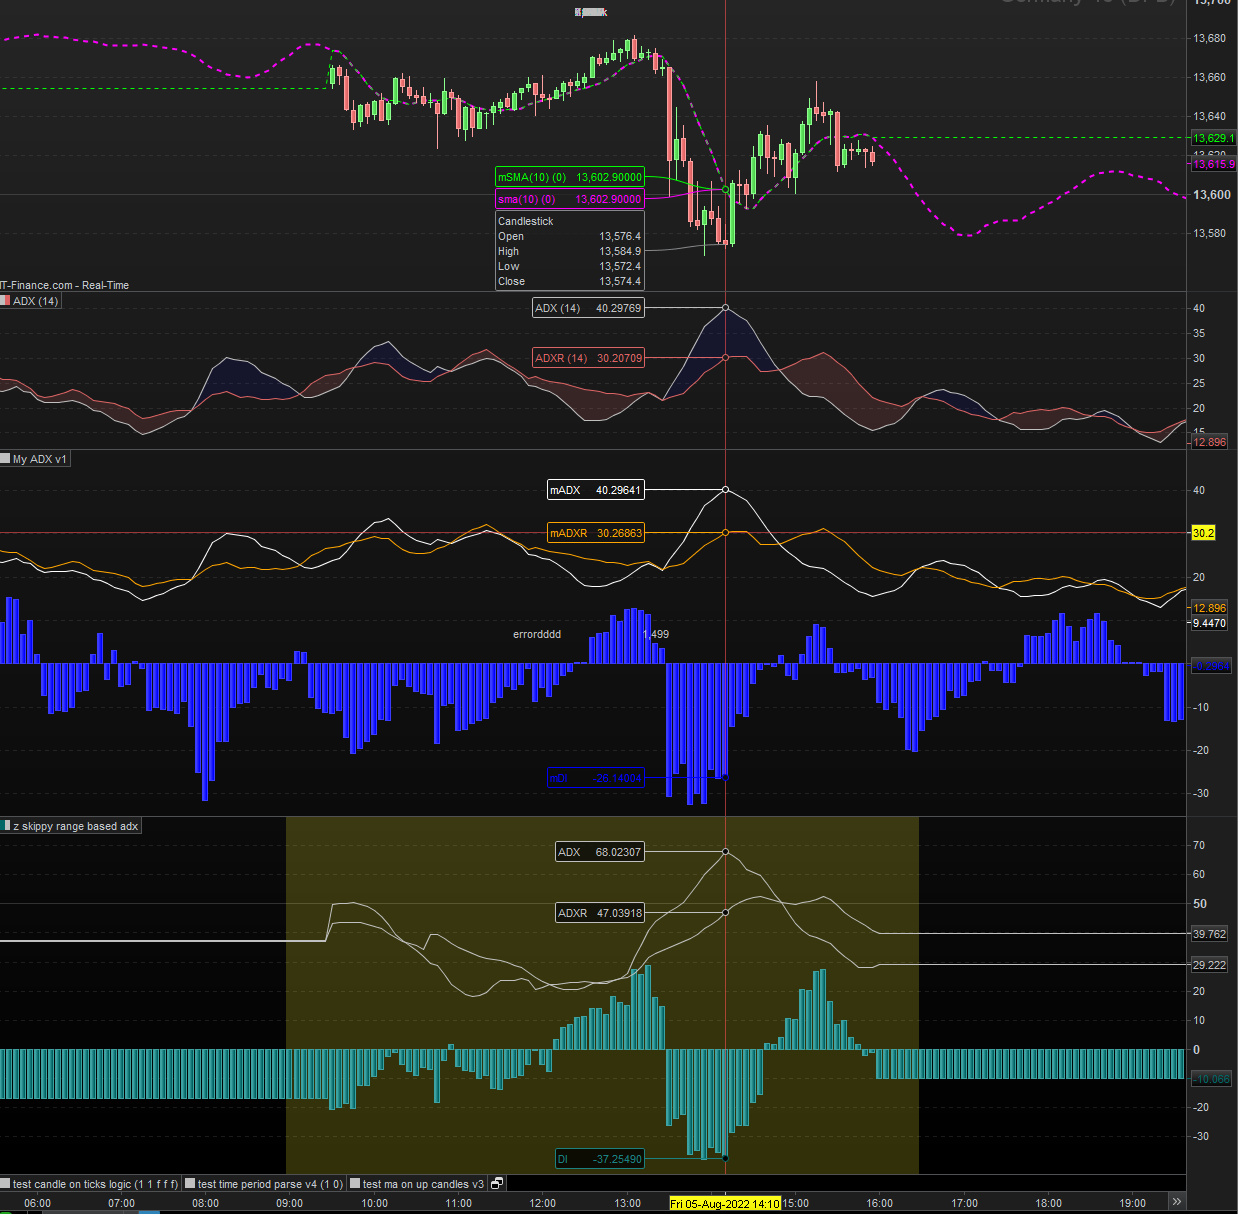
    The indicators when applied to Indices would be using the bars from all the 24 hours to calculate (including the hours when no global equity markets open), and not just the bars from the trade hours (or the trade hours + pre/post market hours). Is there anyway to fix or adjust this for an indicators AND for automatic trading signals?

    As IG keep trading for 24 hours on markets, even if a specific market (+ its pre & post market, and its futures) are not being traded anywhere in globe. Would this be giving incorrect readings & incorrect long/short signals for a lot of indicators for any chart using a timeframe less than the daily?


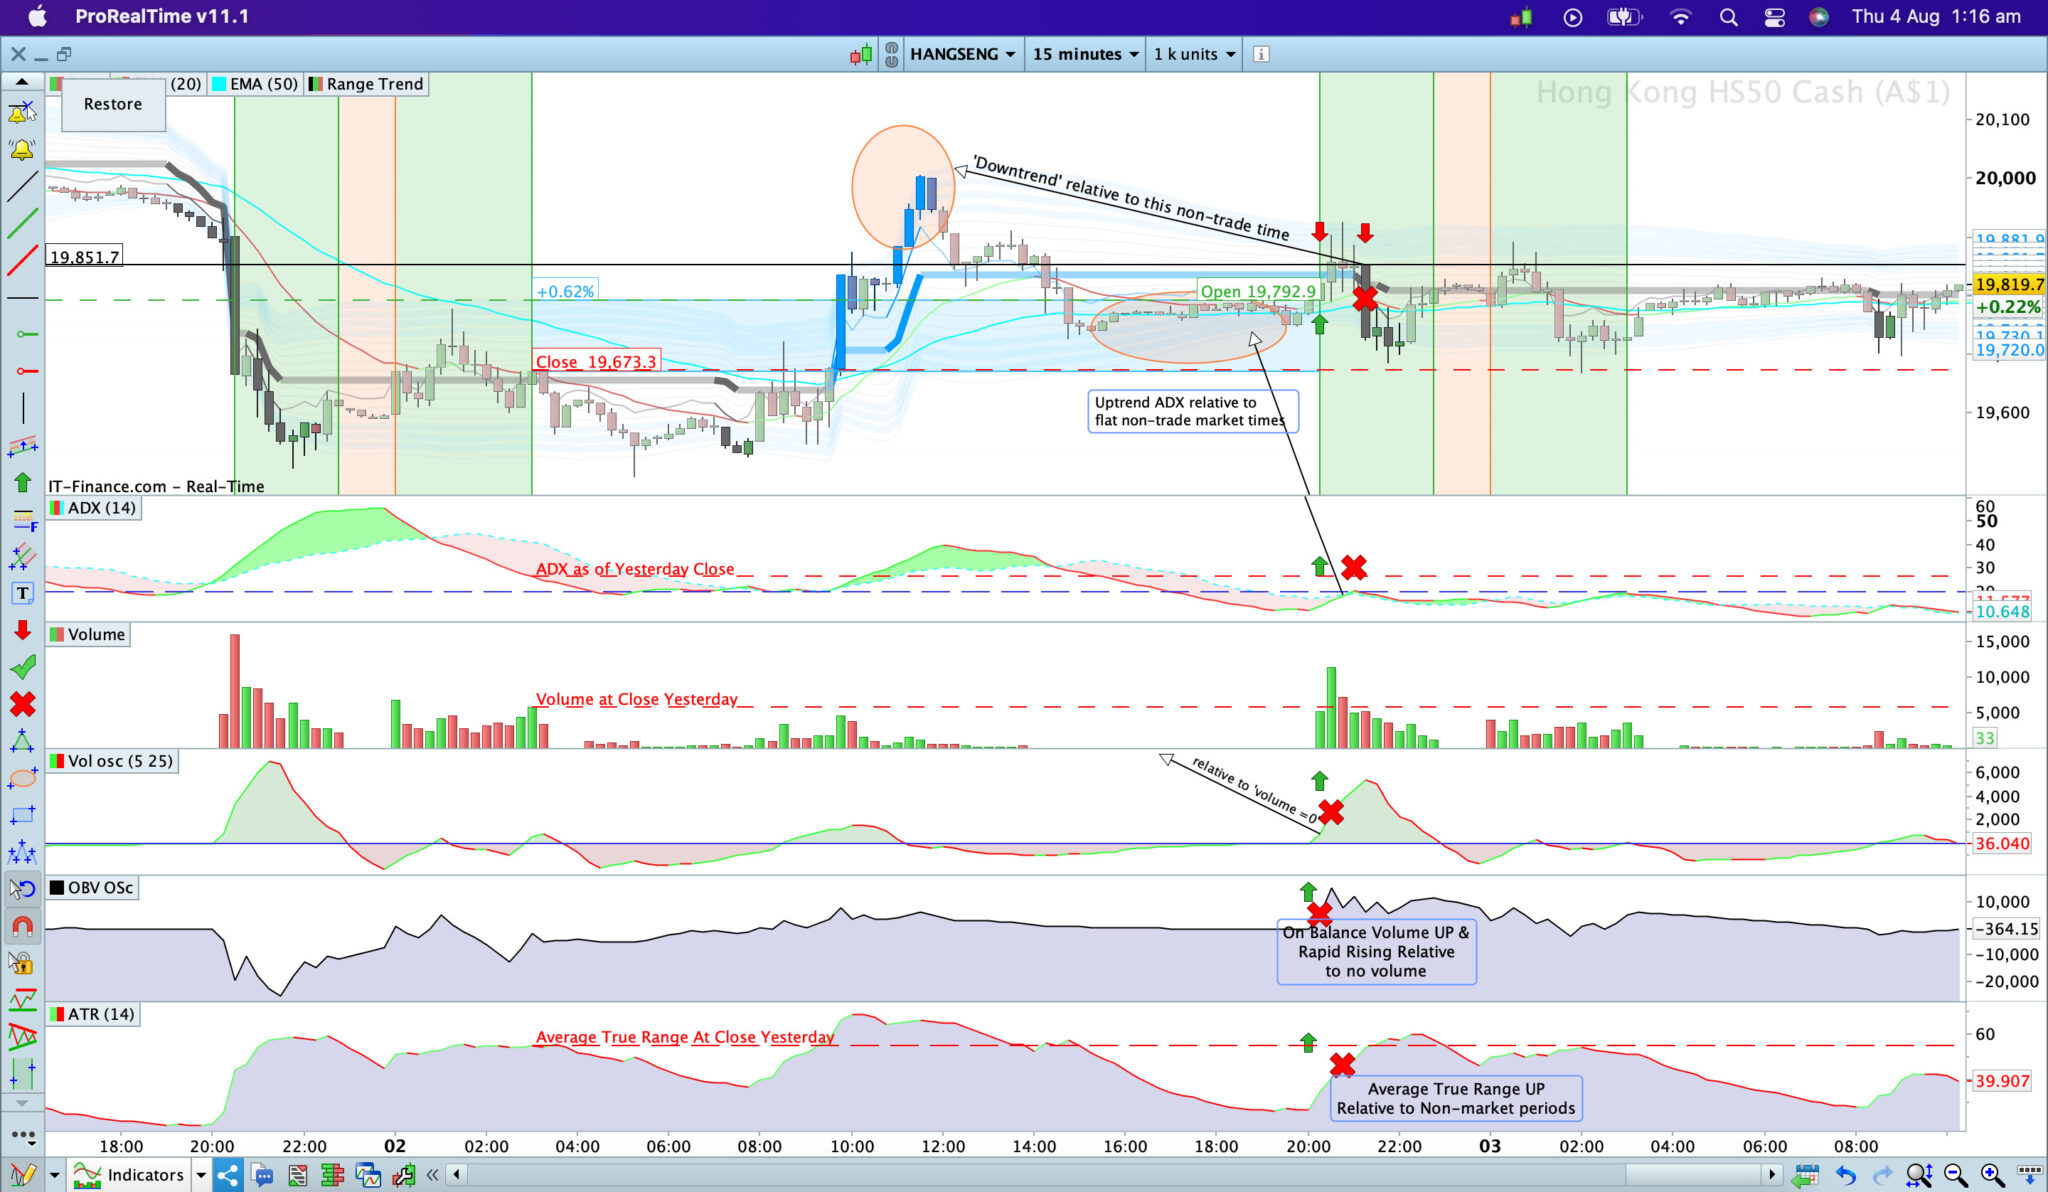
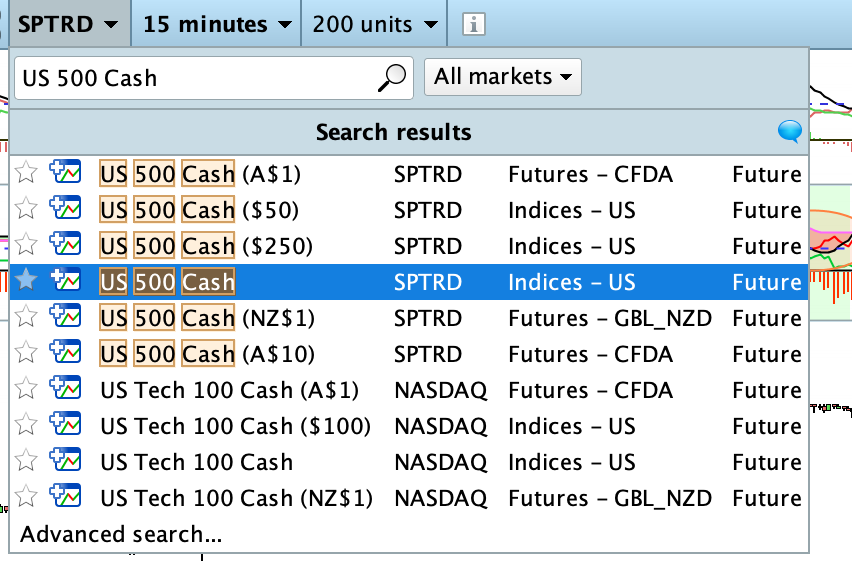
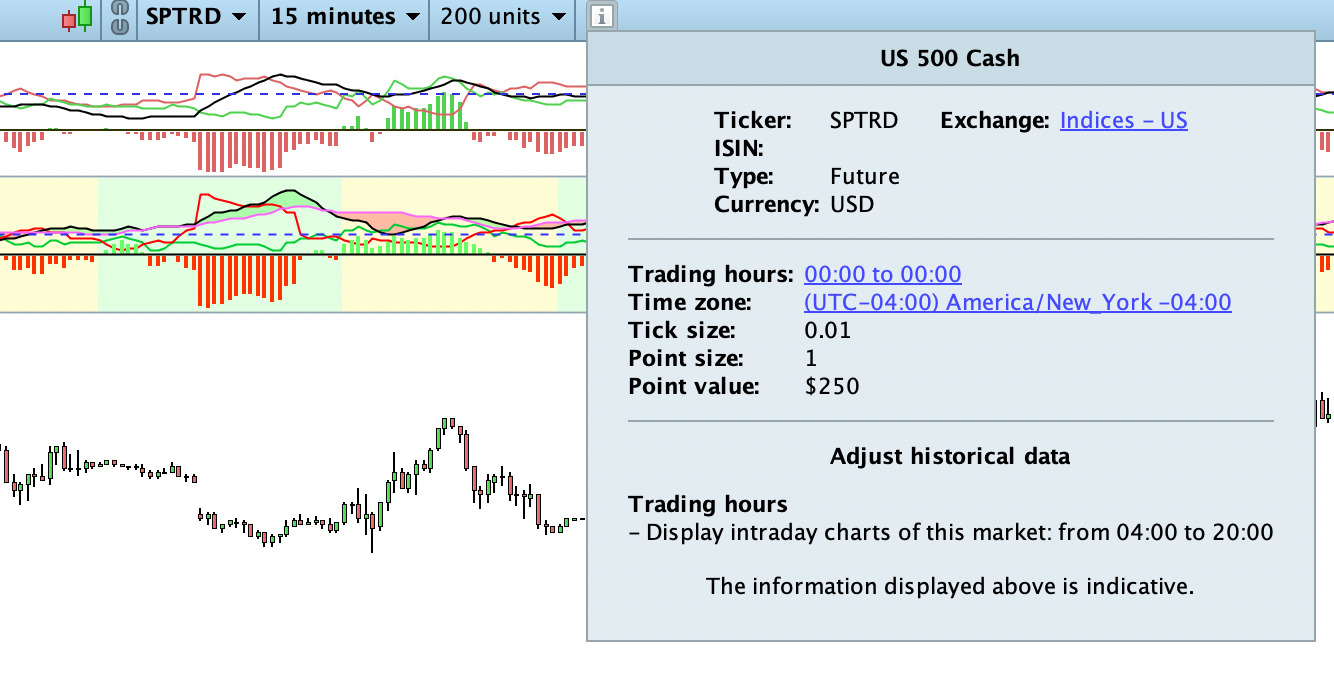
    This would especially be a problem for Asian Markets, for example if we think of the Nikkei (TSE), or the Hang Seng (HKEX) there is 4 to 5 hours of no global equities market open before their respective markets open. The TSE opens at 0900am Tokyo Time, and its pre-market index futures only opens 15 minutes prior to that at 0845am. Meaning from US markets closing to TSE index futures opening in pre-markets there is 3 hours 45 minutes of no global equity markets open. The Hang Seng then opens later on, which does get about  1 hour of Tokyo and Australia markets trading for its calculations, but still those markets is in no way reflective of China’s current markets conditions though? This might only be an issue for IG users as i don’t see my futures or indices charts showing bars outside of open markets on other platforms charts i use.


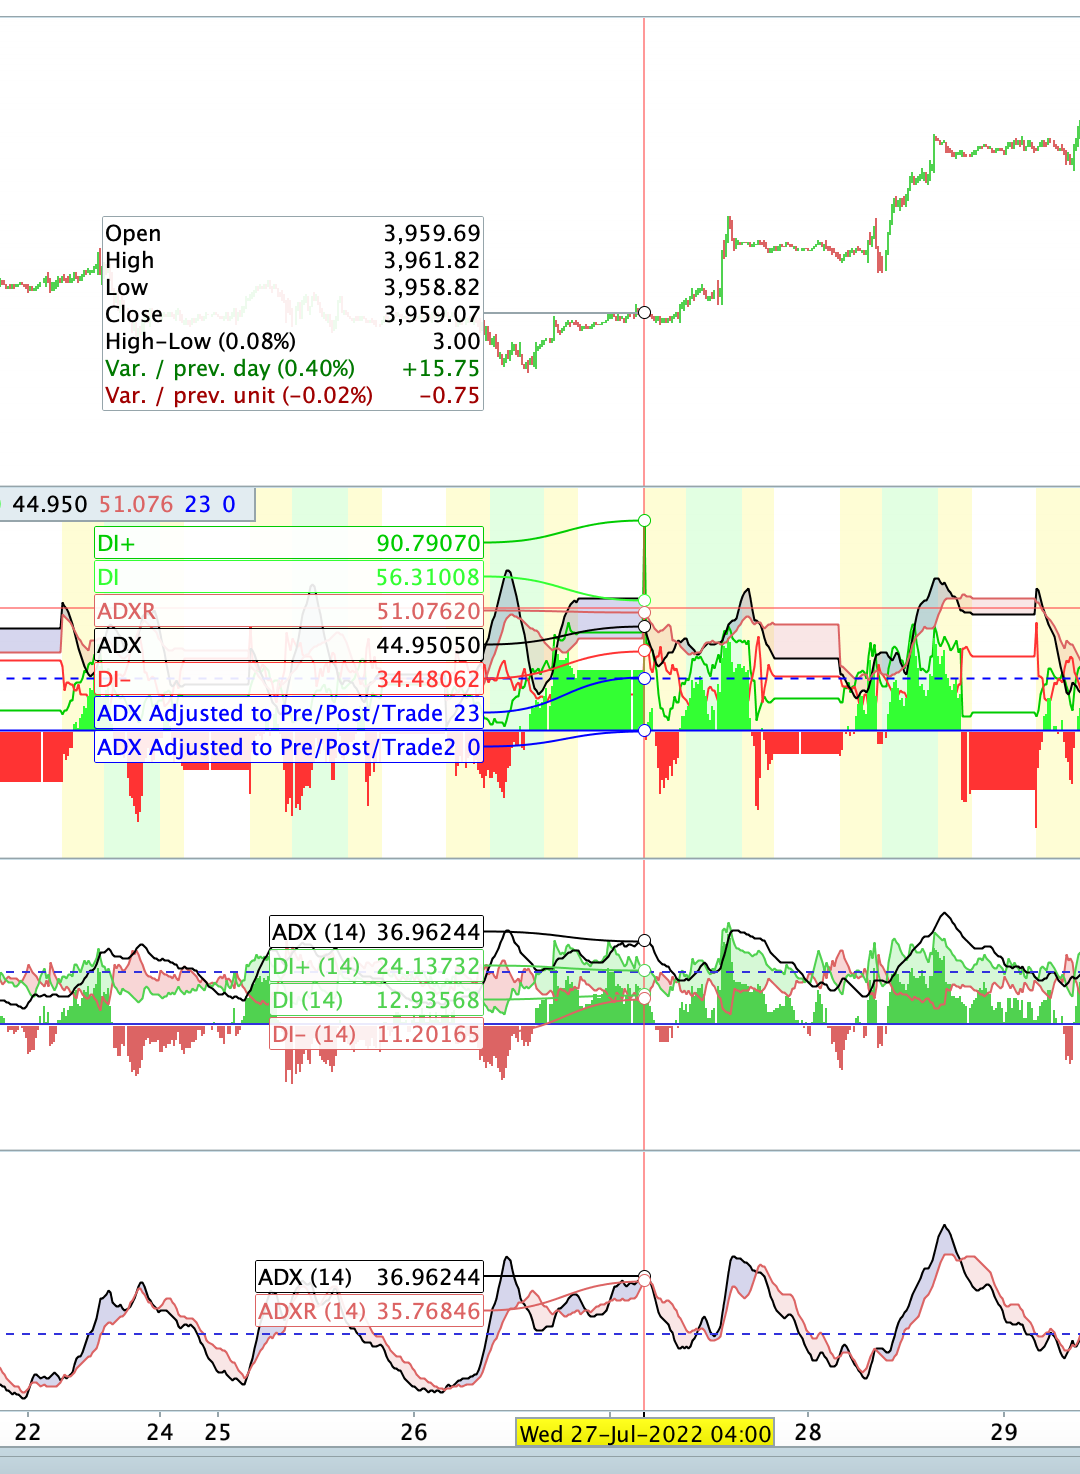
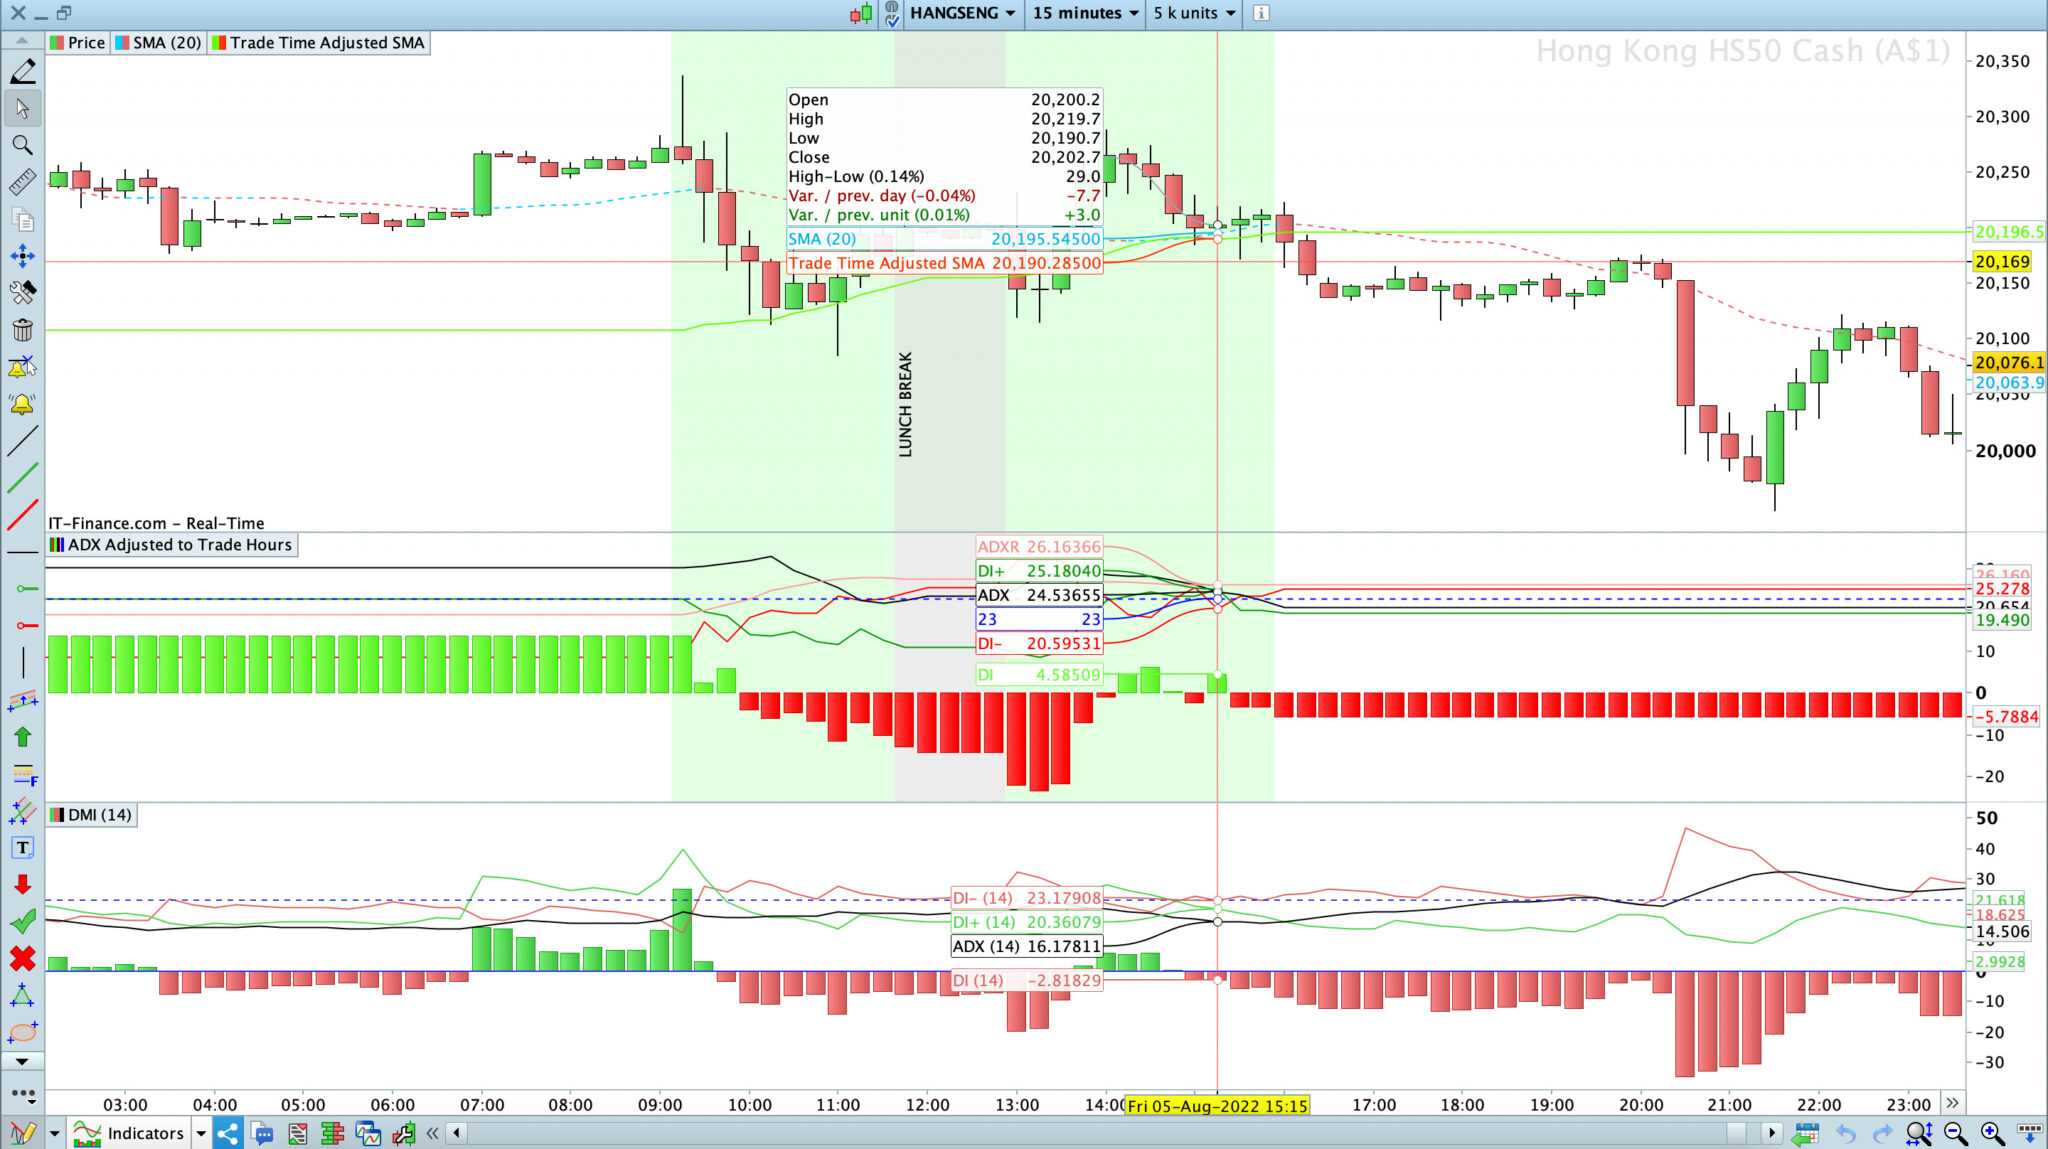
    On this reasoning, if (as attached image) Hang Seng for example (14) on 15 minutes, start calculation 4.5 hours prior at  New York time = 1600 (At market close) = calculations made up mostly of no global equities markets open. Now any calculations on more bar would be taking in futures movement (out of Hong Kong market hours) which is mostly related to USA and Europe markets conditions and not the Hong Kong markets. If used a (14) on a 1 hour chart, means we starting calculation 14 hours earlier, which also means after the Hong Kong markets closed.


    • ADX(14)  = calculates strength and movement relative to a period with no strength, and minimal trading occurring. So wouldn’t it make the start of trade almost everyday appear to be up-trending on the chart?
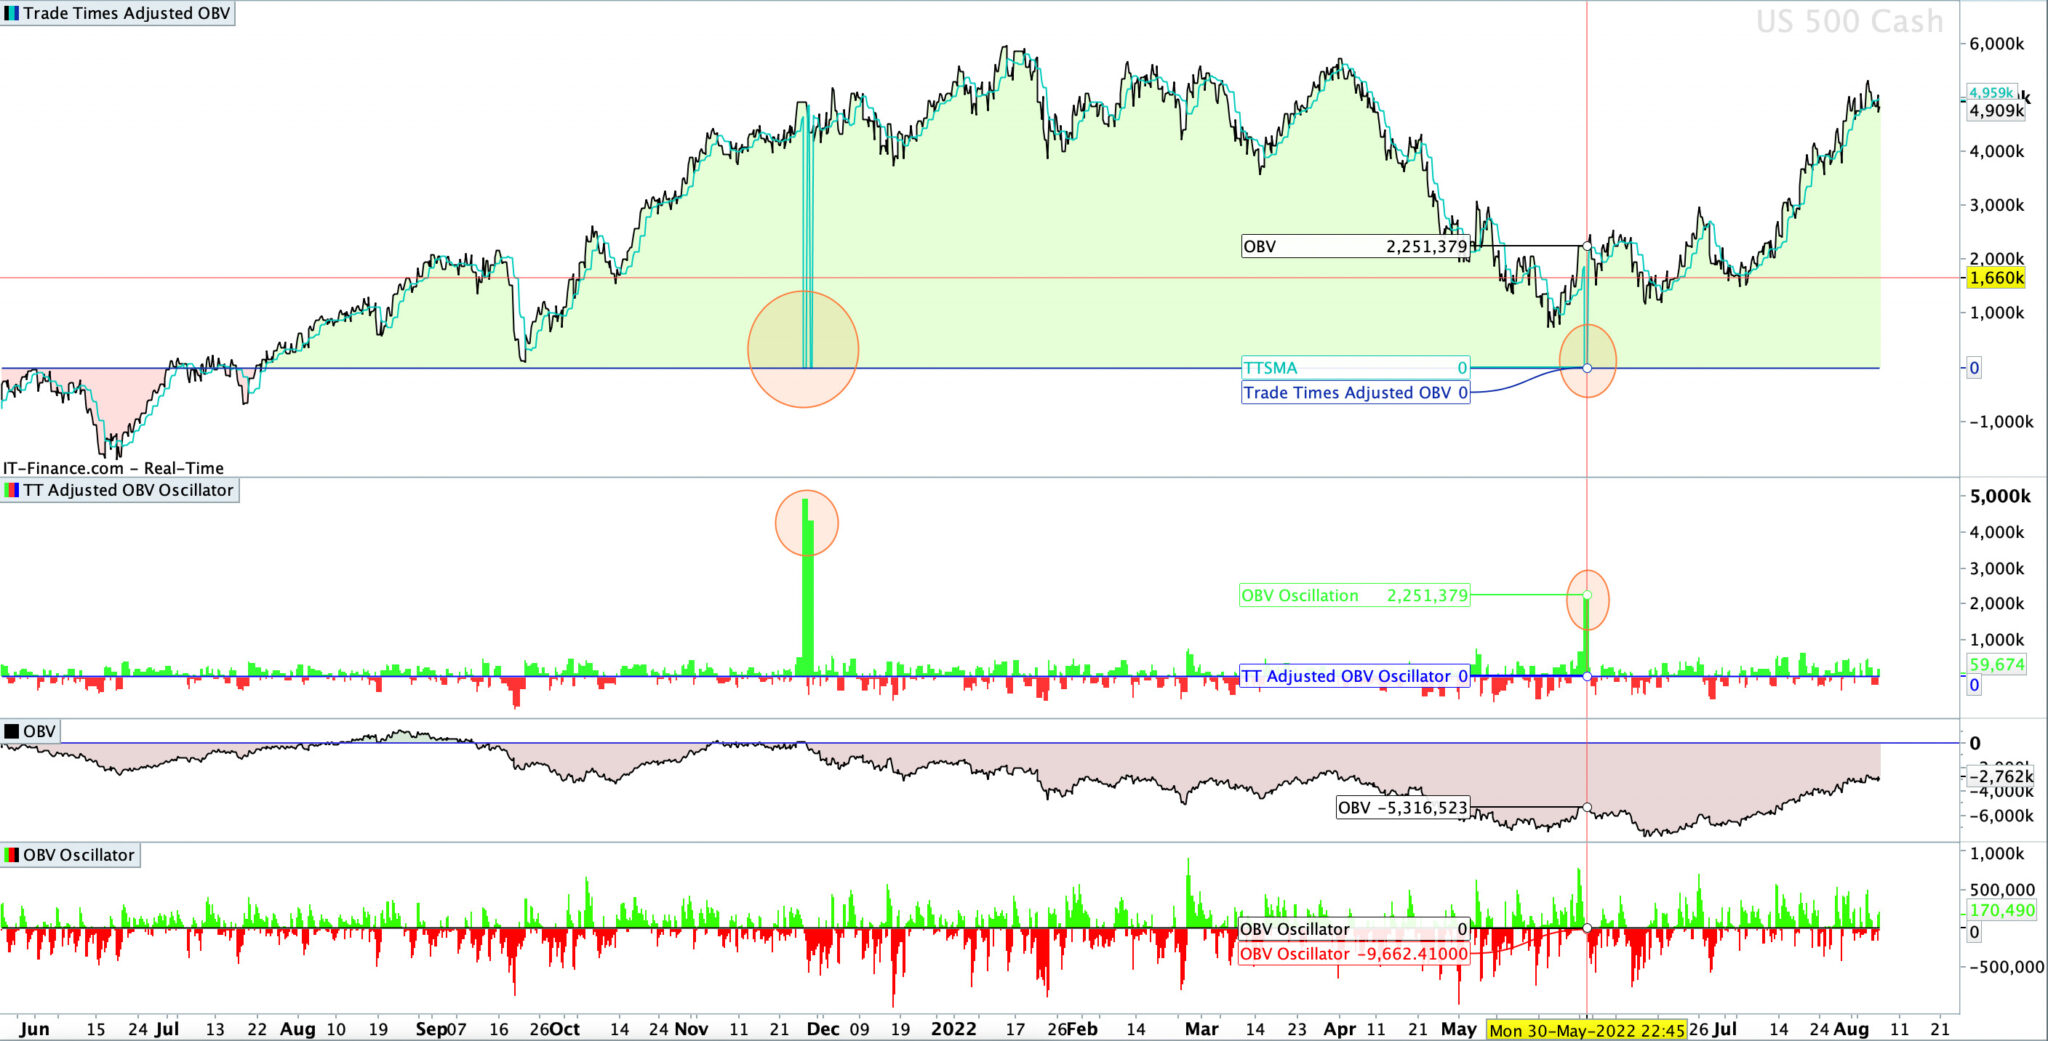
    • Volume Calculations for detecting a trend (eg. Change in volumes, Oscillations, On-Balance Volume etc..) would all be suggesting a spike during trade hours, or a movement above average, or a movement upwards during trade hours relative to volumes occurring (none or minimal) during non-trade hours?
    • Moving Averages, Ranges etc..: this (as you can see in the picture) would also be moving up and down with the out of market trades. So for example at the moment the USA markets have been performing well (for Longs), so generally all the indices futures follow them up during the USA market; but the HK market been more bearish / downwards moving. As such what happens is these averages and ranges moving upwards over the non-trade times, but then ‘relative’ to USA market times fall, so get Downtrends or Bearish/Short signals occurring at the start of the HK market even if the market doesn’t have any trend or is actually up (relative to itself). As is the case, you can see here, HK actually opened up from it’s yesterday close (in green), and was a relative flat market (relative to itself).
    • Average True Range % or Volatility measures etc.. also these would all be suggesting things changes a lot at start of trades too.


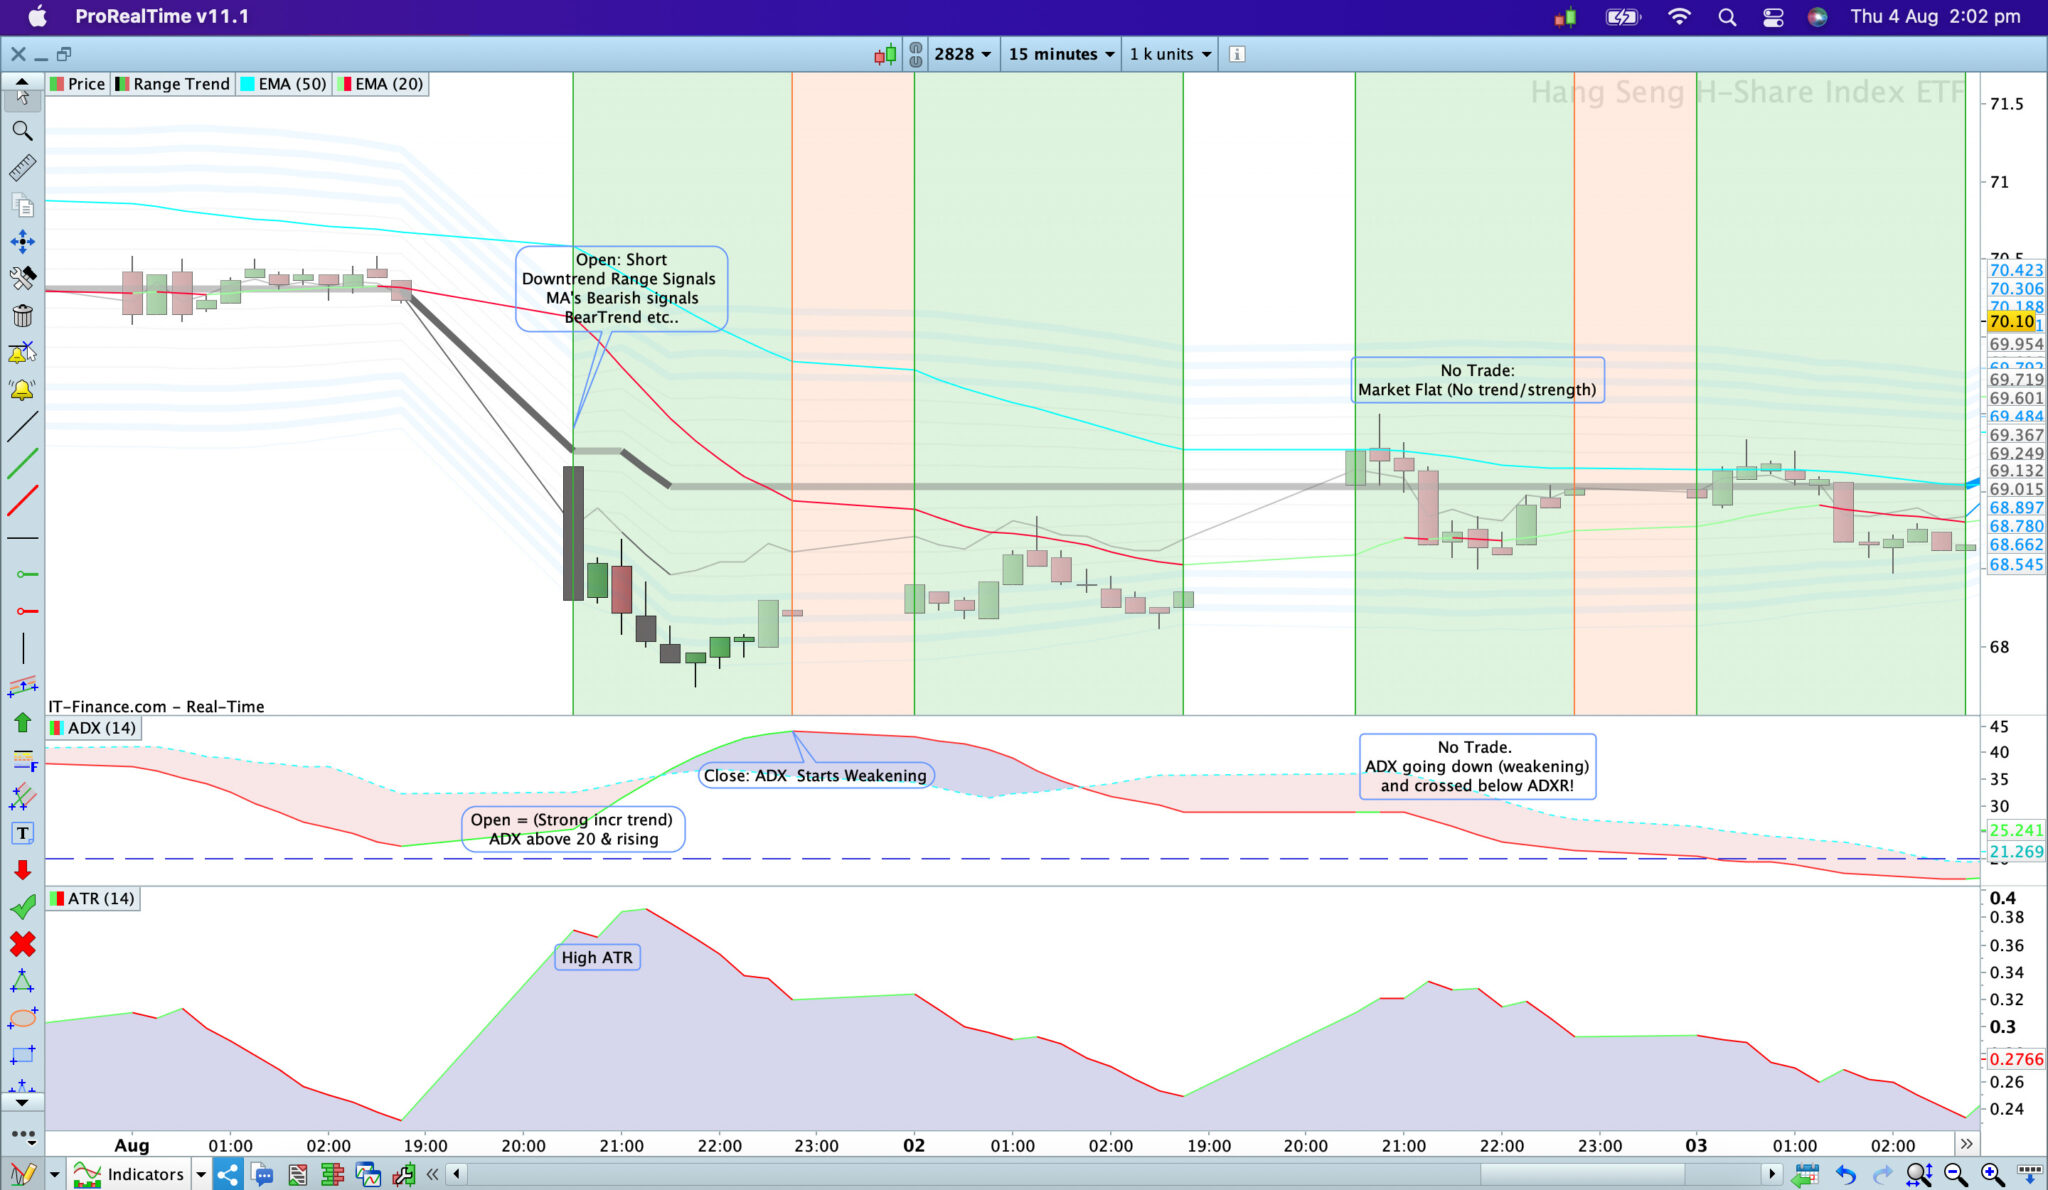
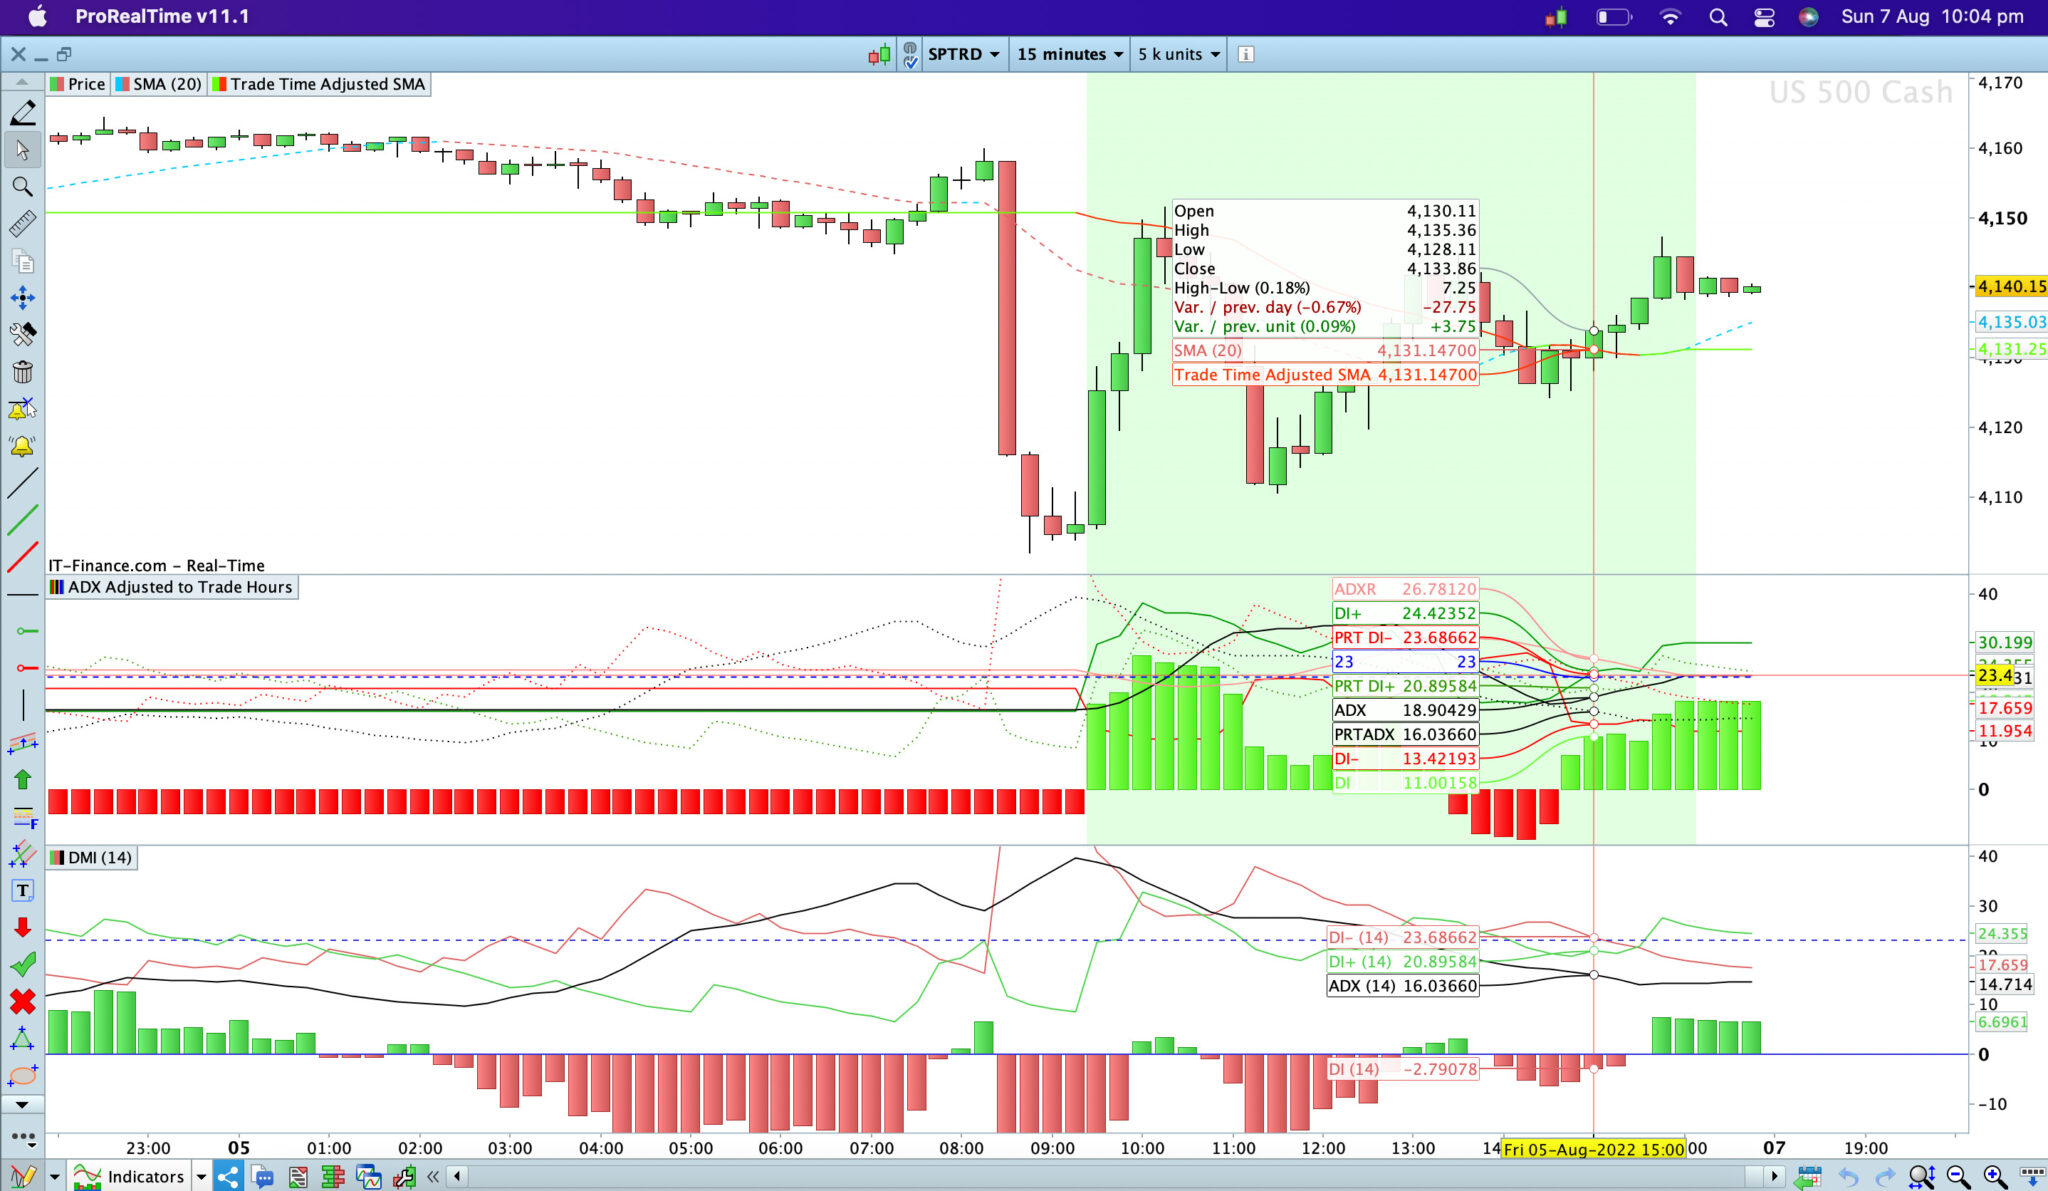
    Now so i did look at the Hang Seng 50 Indices compared to a random Hang Seng 50 ETF traded only during the HK market times (image 2), and i did indeed see there is a big difference in the signals. The ETF as only taking signals from HK markets which on this chart appears to be giving more correct signals for opening a SHORT based on a trend 2 days ago (on the 2nd of August) at start of trade and closing this about 8 bars later just before lunch as the trend weakens. The time period after this however, unlike the indices, it wouldn’t open any trade, as there was no spike up and then back down to give the start of trade downtrend on the 3rd, and the ADX was weakening (not increasing as was the indices), with other flat market signals unlike the indices. If anything the moving average was uptrend (green) at start of trade for the ETF = correct, vs red for the indices = incorrect. Meaning on the 3rd of August it was a lot more correctly giving the signals, compared to the indices chart.


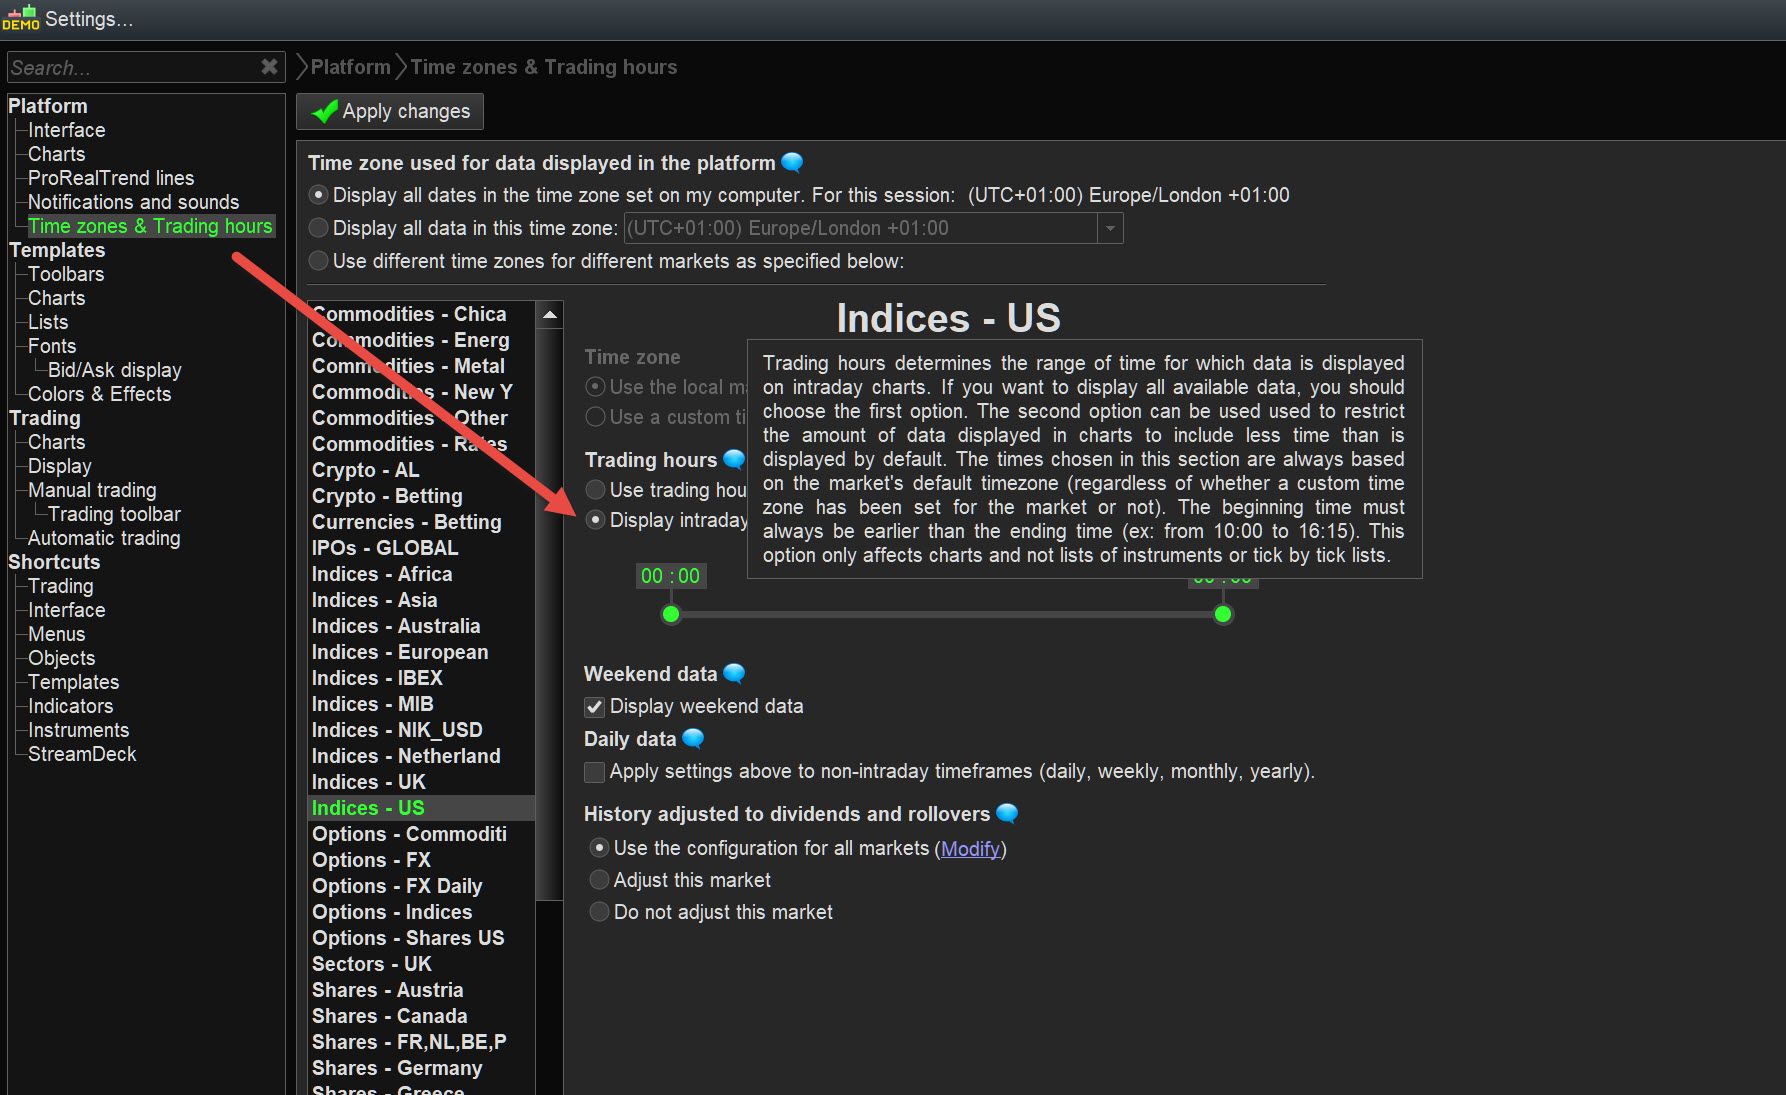
    As such is there any way i can be calculating the indicators for only the bars occurring trade hours of the market and ignoring calculating on the bars outside of market trade? For example [14] at market open means the 14 bars (during markets) before markets closed yesterday, and not the 14 bars (outside of markets) before market opened today. And code this for automatic strategies? So when doing an automatic strategy on the indices i’m getting correct signals (on volumes, trends etc..) related to its market ?

    #198466

    Can this be of help ?
    TRSMA – TREMA – TRWMA

    Hence theoretically you can make all the indicators yourself and filter by time period(s). And you have a few examples at hand now.

    I agree that this 24/7 thing is nothing less than disturbing.

    2 users thanked author for this post.
    #198468

    Even if you could achieve what you ask above … assuming you are trading with IG, will you not get gaps (could be big at times?) at most market open where the price IG have been quoting (while ‘official’ markets closed) has changed from official market close?

    Will these gaps affect your Indicators and / or Reject your Trading Systems?

    Not thought about it deeply … too early, coffee not worked throught yet! 🙂

    #198477

    Can this be of help ? TRSMA – TREMA – TRWMA

    Thanks a tonne (or an entire freight train load), it does look like that might work. I definitely will be able to play around with configuring these to all the indicators i tend to use (might be a long weekend ahead) and see if it matches a more normal market movement for the Asian indices . A nice thing would be for IG/PRT to have some function/selection that allows to chart to use only “real” data aka cash & futures markets trading data, or some CFD instrument on IG for the indices in trade hours only or without pseudo prices (only real prices) instead of a 24hrs market?

    will you not get gaps (could be big at times?) at most market open where the price IG have been quoting (while ‘official’ markets closed) has changed from official market close? Will these gaps affect your Indicators and / or Reject your Trading Systems?


    Hi – well its far past coffee time in this part of the world > past dinner time here.  But yes definitely would get gaps, and i would like them personally (For official markets open) – it would only help and not hinder/reject indicators. Gapping itself (if big eg. 2% up at offical HK market open, from yesterdays close) would make most of the indicators (and various moving averages etc..) all suggest a strong price movement and a Bullish market to open Long on that conditions for day-trading.  This would be how normal markets occur – when you watch any business news on TV they almost always say something like “the market is up 1% today” to suggest the conditions? Instead on a 24hr chart the market for example the market could also be up 2% from yesterday but indicators saying the markets is “bearish conditions” cos of the bigger price movements that come from USA Indices (US market movement) the night prior to Asia markets opening the next morning. The example i shared the screenshot from HK market it did gap up (although small of about 0.5%) from yesterdays close,  so if anything would be to go for a LONG position if Technical Indicators calculated ONLY on trading hours, other indicators like the moving average went up too to also suggest a Bullish market. But however “Movements”/ Trend strength indicators (from the ETF/ only trade hour) like ADX showed the market was weak, so no trade, which appears correct looking at market. BUT when go over to on a 24hr chart with its pseudo price movements then my indicators on that example instead showed a ‘Downward’ trend because the price went up lots during the US markets hours (cos HK closed it just followed US Indices movements) and as such technical indicators calculating from that ‘incorrectly think’ the markets going down at open but its not it’s up (gapped up 0.5%). It also incorrectly thinks it’s “Strong” because compared to “0” trade volumes and “0” movements that occurred when no global markets were open in the prior 4-odd hours the trend is strong (relative).  In hindsight on one example to illustrate the issue i am facing.

    I would assume also that the academic’s, qaunt’s or investment bankers that studied the various technical indicators they created would of done so on normal markets conditions without ’24hr charting extensions’  that IG does ?

    #198529

    For reference the current way i have been getting around this bug/issue with PRT/IG charts in the past is all my strategies don’t open any trades during first 2 hours of Asian* market open, and then i use very low number of bars/periods to calculate my indicators (eg. [4], [6], or [8]) this way they don’t use any of the pseudo (false, or fake IG made-up) data from outside market trading times with-in their calculations, but just the bars since market opened, and thus their subsequent buy/sell signals.

    *I have a less concern this for other markets as they have longer pre-markets periods, and thus use “real data’ & not made-up data in their prices and thus indicators calculations.

    #198531

    There is also the dimension of Settling Times. Best (or most weighing) example is the DAX (Germany40 ? or whatever IG calls it). This settles (like all European Futures) at underlaying stock closing time (17:30 Amterdam) but happily continues itself, drawn by USA. Like yesterday (my) morning, it was at +1% while (underlaying pre-market) USA was at ~0%.
    Normally this is only a visual issue (no issue for Autotrading and what you are dealing with), but when we see that underlaying starts to behave towards that Future (Index for IG) hence stocks really grow towards 1% around opening (09:00 Amsterdam), … then you see how a complex (system as a whole) it all is especially because all the Bloomberg’s of the world keep telling me that Europe does great and USE is so-so (with Asia somewhere in between). But the “great” really springs from last day’s Settling Time which was long before closing so it allowed to grow along with USA and thus starts next opening at 1% (USA resetting to 0% at 22:00 Amsterdam (which also is Settling Time) while happily continuing until 23:00.

    A bit in your street (this would be Dutch I guess) is that the opening of the other European Futures next to the DAX (which opened at 02:15 Amsterdam) can all be predicted, when they open at 08:00, by means of looking at the DAX.

    And then PRT keeps telling us that it is impossible to look at other instruments (yes we know about “Calculated Instruments”) from within the chart we trade (AutoTrading). It would be the best improvement ever as it really really currently lacks.


    #198535

    This is my working progress, i’ve tried adjust for the ADX to base on only ‘real data’ aka when the markets (and/or its pre-markets and post-market) are open. But i’m not sure i’ve got it right? As some of the values appear not right, eg. the DI+ values seem very high and up near 100 ?


    #198536

    without ’24hr charting extensions’  that IG does

    Have you tried using separate data display settings for each Instrument you Trade … see attached at red arrowhead?

    1 user thanked author for this post.
    #198539

    separate data display settings for each Instrument you Trade

    Thanks, that actually would be a lot easier then re-coding every single indicator. BUT will come with an extra cost of 0.5% fee’s when using the US Indices instrument in your example ( aka USD-based chart), instead of  ‘CFDA’ instrument choice (Australian/AUD based CFDs) :

    “CFDs traded in a currency other than your account’s base currency incurs a currency conversion charge of 0.5%” .IG Australia 

    But changing to a USA-denominated Futures Chart does indeed make the technical indicators look more accurate, with both my coded above and the in-built look more similar now (image-1 attached). Although they are still different at some points, unsure why this difference is there if the functions are calculating correctly thus giving the same values ¯\_(ツ)_/¯.


    #198541

    You sure you are correct on this … surely you don’t have to change the default currency on your account just because you are excluding out of hours market data??

    You are simply excluding bars from showing during market-closed times, nothing more?

    Have you tried and what, you get a message saying … Sorry you need to change to US Dollars?? 

    #198542

    ‘CFDA’ instrument choice (Australian/AUD based CFDs) :

    Adjusting times isn’t possible for the CFDA’s instrument neither, because for some odd reason CFDA’s Local market time-zone on PRT is UTC +1:00 (London time) > which in itself is just useless (and creates a big problem) as Australian AEST is 9 hours ahead of London time. So even if i could adjust it, i cant because most of the Asian pre-markets start before the 00:00 (UTC +1:00). Doing this way i could, changing the display/market data to start from 00:00 London time, could probably be the best option?


    #198546

    The US Indicies only has USD Currency option, i cant find any other option using the US Indicies (see attached). All the AUD currency options, are under “CFDA”, as shown. If i can manage a way to as such use a US Indices chart but not change currency ?

    Have you tried and what, you get a message saying


    #198647

    Working through OBV (and other volume-based indicators) it seems i might still be doing something wrong in my computing ?

    Looking at attached image 1 and you can see there was a few random extreme spikes (circled) occurred for the Trade-Times Adjusted OBV Moving Average, and also for the OBV oscillation – mostly appears related to calculations of the ‘TTSMA’. Also attached image 2, can see these occurring for DI+ in my earlier ADX example too on the 27th of July, which that spike is definitely an error because the corresponding price chart above has very little movement so definitely isn’t corresponding to some sudden strong uptrend? In my mind as far as i think whats occurring is something wrong with the very first bars (at StartTime) calculation?


    #198651

    Hi Skippy…

    Been working on a solution using a different way, looks promising, but still in bits.

    I compared the results from your ADX code version to an ADX version I wrote for my code.

    From the image, the top panel shows the session candles and 2 SMA(10) ‘s. The pink uses 24hr data while the green calculates on, in session periods

    Though the green SMA uses out of session values at the beginning of the session, it doesn’t take too much imagination to realise that if these beginning candle values were taken from the end of the prior session their would be some difference, but as the session continues, these sma’s would converge together on the 24hr path. I think in general most indicators would do something similar.

    Below that is the prt-ATR and then , the one I’ve coded, and then yours.

    Your ADX appears to follow the above mentioned beginning difference and later convergence. In comparing the cursor label values, both prt-ADX and mine give very close readings with each other but yours have higher values by some ~ 60%, If these higher value were at the beginning of a session I could understand that  but, later doesn’t compute. It poses the question to me, why?.

    Now either, I’m comparing apples to oranges or theirs an issue somewhere. Since your having an issue with the OBV it could be an error parsing the data up, or integrating the indicators into it. These are some of the problems I’m encountering, apart from just general errors.

    As a suggestion, if you create a version which just uses a simple moving average, it would be easy to calculate the values manual to verify coded results. This would verify the parsing of data between sessions at least. An error there will affect all the indicator you write.

    That’s all I’ve got at the moment, I’ll post when I’ve got anything else.


    #198679

    Hi Druby thanks,

    I added the SMA code as such (attached) and yes it did align along with the PRT’s inbuilt towards end of markets, and did manage get OBV to work (computation was as such not counting correctly > issue was i was doing too many things within the one loop, so broke each step into its own counting loop. The ADX is but still not matching, it looks similar overall general trend but even at some bars it goes opposite way to the inbuilt, eg. downwards vs upwards direction of the DI+ or the ADX lines vs the comparisions.


Viewing 15 posts - 1 through 15 (of 28 total)

Create your free account now and post your request to benefit from the help of the community
Register or Login