Expert Services

No recent search

Indicators use 24hrs and NOT just Trade Hrs Bars > how fix these wrong signals ?
- Forums
- ProRealTime English Forum
- ProBuilder: Indicators & Custom Tools
- Indicators use 24hrs and NOT just Trade Hrs Bars > how fix these wrong signals ?
-
AuthorPosts
-
hi skippy..
Noticed a couple of thing in your ADX code version. Though I don’t think it’s solved, they do make a difference to the results.
On lines 68, 81 you can use the wilder average option in the average function.
AVERAGE[Periods,3) This would fall in line with how the ADX is normally calculated.
On line 68, when calculating the ATR, because this is only calculated in the open session, at the session beginning, the calculation is going to use the out of session values of the TrueRange TTTR . This would require calculating in the ‘FOR’ loop when you lookback to be avoided.
However if this is desired to align with the most recent candles prior to the session opening, note that the TTTR is only calculated in session, meaning these out of session bar values would most probably be ‘0’ or possible the last calculated values, not yet looked!
This would affect the ATR by either, using zero’s would effectively build the ATR from the open session candles but the divide by period would reduce its value considerable, or if their at the last calculated value, make the ATR from a possible wild values taking time to correct.
Moving line 67, to line 16 would make sure each bar has a valid true range value.
One last thing, in the Loop, the value of +/- DI, lines 52,53 are used directly in lines 72,73 without the wilder smoothing average on them. This difference then affects the DI, ADX and ADXR values.
That’s where i’m at…
SkippyTrader thanked this postOn lines 68, 81 you can use the wilder average option in the average function. AVERAGE[Periods,3) This would fall in line with how the ADX is normally calculated.
You referring to the first version of the code? Yeah i noticed actually thats a issue cos its using “average” of the proceeding bars, and not the bars within the actual time range, so is an incorrect average. ?? If i used the AVERAGE[Periods,3), but would this work correct as it would be taking the average of out of the range too and not the within loop?. Instead take the within loop values below would be more correct?
Current most recent version (page 1 of this forum), i have put the initial TTATR = .. above the loop like you suggested, and then i’ve put the “TTATR= TTATR + TTTR[j]” within loop, to give the within time range TTAATR, then divided by the periods after (not in loop) that as such, to be the current TTATR and give a value stuck to the last TTATR from within trade-times during the non-time range period until the next start/open session. As below…
// Set intial values to 0 plusDI = 0 minusDI = 0 i = 0 TTATR = 0 // start counting plusDI and minusDI for [j] during trade times, and the TTATR during the trade times FOR j = 0 TO 3000 // Uncomment the time option used: // IF opentime[j] >= StartTime AND opentime[j]<=EndTime THEN // IF opentime >= FuturesStartTime[j] AND opentime <= FuturesEndTime[j] THEN IF opentime[j] >= StartTime AND opentime[j] <= LunchStartTime OR opentime[j]>=LunchEndTime and opentime[j]<=EndTime THEN plusDI = plusDI + plusDM[j] minusDI = minusDI + minusDM[j] TTATR= TTATR + TTTR[j] i = i + 1 IF i = Periods THEN BREAK ENDIF ENDIF NEXT // Compute the DI's using the periods during the trade hours from earlier TTATR=TTATR/Periods // ?? AVERAGE[Periods,3) > but would this work as a Average would take the average and not the within loop? plusDI = 100*(plusDI / Periods)/TTATR minusDI = 100*(minusDI / Periods)/TTATROne last thing, in the Loop, the value of +/- DI, lines 52,53 are used directly in lines 72,73 without the wilder smoothing average on them. This difference then affects the DI, ADX and ADXR values.
And then on this point ? Ive also put them within the same loop at line 46 and 47, and then averaged out over the TTATR, *100 (as a %) outside of loop at line 64 AND 65 ? :
Line 46 -47 (inside loop in the time range of ‘j’)
plusDI = plusDI + plusDM[j]
minusDI = minusDI + minusDM[j]
Line 64 and 65 (outside loop, as need value always set to end of last sessions time, flowing through to the start of next)? If inside loop this i would then get random numbers during the non-trade times, or a average out when i get to TTADXR (in loop j3) that operates outside of the range? Is my thinking atm:
// Compute the DI's using the periods during the trade hours from earlier

TTATR=TTATR/Periods
plusDI = 100*(plusDI / Periods)/TTATR
minusDI = 100*(minusDI / Periods)/TTATR
Then i go a next loop from this, line 76 – to – line 94, ‘loop j2’ to calculate ADX within time range:
//initial values for the ADX , and using the plusDI and minusDi above, over the trade times [j2] range: TTADX = 0 i2 = 0 // Compute the ADX's using the periods during the trade hours from earlier FOR j2 = 0 TO 3000 // Uncomment the time option used: // IF opentime >= FuturesStartTime[j2] AND opentime <= FuturesEndTime[j2] THEN //IF opentime[j2] >= StartTime AND opentime[j2]<=EndTime THEN IF opentime[j2] >= StartTime AND opentime[j2] <= LunchStartTime OR opentime[j2]>=LunchEndTime and opentime[j2]<=EndTime THEN TTADX = TTADX + (abs(plusDI - minusDI)/(plusDI + minusDI))[j2] i2 = i2 + 1 IF i2 = Periods THEN BREAK ENDIF ENDIF NEXT TTADX=100*(TTADX/Periods)Oh by the way the above code is for Asian Markets, that have a lunch break in trade of about 1 to 1.5 hours of no trade during the middle of the day, BUT the PRT chart shows bars during this no-trading period, so we need to remove those from calculations for certain markets but for all the other (major) Asian markets this needs to be factored in for accurate calculation of indicators (if we want to use real-data) as those respective markets are all CLOSED with NO TRADING in these LUNCHTIME (below). And actually even for market not these markets due to the high liquidity and trade volumes in China and Japanese markets, it actually could be important to consider these times impacts eg. the pre-markets for the European markets.
StartTime  = 090000
EndTime    = 160000

//For markets with lunch breaks
LunchStartTime = 120000
LunchEndTime = 130000

//uncomment below option for all loops
IF opentime[j] >= StartTime AND opentime[j] <= LunchStartTime OR opentime[j]>=LunchEndTime and opentime[j]<=EndTime THEN
Below is as such the trade hours required to use for certain markets. Australia (ASX), Taiwan (TWSE) and South Korea (KRX) do not have lunch breaks and so wouldn’t need code two sessions for those markets.
Name
Global Rank (Liquidity)
Time Zone
Trading Hours
Lunch BreakShanghai Stock Exchange (SSE)
3
CST
9:30 a.m. to 11:30 a.m. and 1:00 p.m. to 3:00 p.m.
11:30 a.m. to 1:00 p.m.Tokyo Stock Exchange (TSE)
4
JST
9:00 a.m. to 11:30 a.m. and 12:30 p.m. to 3:00 p.m.
11:30 a.m. to 12:30 p.m.Shenzhen Stock Exchange (SZSE)
5
CST
9:30 a.m. to 11:30 a.m. and 1:00 p.m. to 2:57 p.m.
11:30 a.m. to 1:00 p.m.Stock Exchange of Hong Kong (HKEX)
6
HKT
9:30 a.m. to 12:00 p.m. and 1:00 p.m. to 4:00 p.m.
12:00 a.m. to 1:00 p.m.Singapore Stock Exchange (SGX)
22
SST
9:00 a.m. to 12.00 p.m. and 1:00pn to 5:00pm
12:00 a.m. to 1:00 p.m.druby thanked this postHi skippy , thanks for your comments and updates.
Regarding Averages , there a rule of thumb that the Wilder average can take over 150 bars to become totally accurate. So having the session chopped up at various times may give constant inaccurate values with not enough time to compensate before the next out of session gap. Using a Simple Average , though may be different compared to a 24hr ADX value, will only take, in this case 14 bars to be totally accurate after the jump from using previous session bars. If your going to exclude dinner times, this will cut the session down even further. This looks even better for the SMA, Good call!
Here’ something else I’ve been pondering on. In the code you have used several versions of this statement:
IF opentime[1] >= StartTime AND opentime <= EndTime THEN
Now I don’t see anything perticularly wrong with this statement but, initially I wondered why you used ‘opentime[1]’, the only thing I could figure was that you wanted the code to run once though before you session code was ran. Possible to reset the loop variable and/or create some previous calculation data.
I then came along this senario.
Consider Midnight hhmmss 000000, on say a 5min Timeframe, with startTime = 090000, endTime 160000
opentime[1] >= StartTime = True………. open[1] 115500, close 000000
115500 is greater than 090000
opentime < = EndTime = True ……….. open 000000 close 000005
000000 is smaller than 160000
It wasn’t obvious at first but there’s a valid session trigger at midnight. This also appears to happen on the bar before midnight with the version in the ‘j’ loop as far as I can tell. The third version with StartTime[1] not yet checked.
As of yet I’ve not proven a change in the output, but logically, if the loop thinks it’s in a session at midnight, this I think would get included in as one of the accumulation values as the loop looks back , and since being the first found would be included until it falls out of scope.
Thought I’d highlight that.
With the dinner times, if everything is working ok, halting the session at dinner times would just the same as out of hours. When the loop looks back, its only going to accumulate from valid open session values. From a code point of view. Good trading advice!
Regards.
I then came along this senario. Consider Midnight hhmmss 000000,
Yes you are correct, i picked this the error the other day when graphing each part of the code one by one to check them, but i couldn’t figure out why that was happening myself and ended up just played around changing things until i got lucky and it disappeared. Thanks for letting me know why.
With the dinner times, if everything is working ok, halting the session at dinner times would just the same as out of hours.
On various checks so far, halting dinner time indeed makes a significance difference > that is 4-to-6 bars if on a 15min chart that show reduced price movement, and no trade volumes, OR rapid volatile movement pre-opening, OR has its price following the ASX200 during this closed time which is an index weighted mostly by non-cyclical stocks (Australia’s gas and mining gaints) with completely unrelated index price movements compared to most of the tech-heavy & volatile Asian markets.
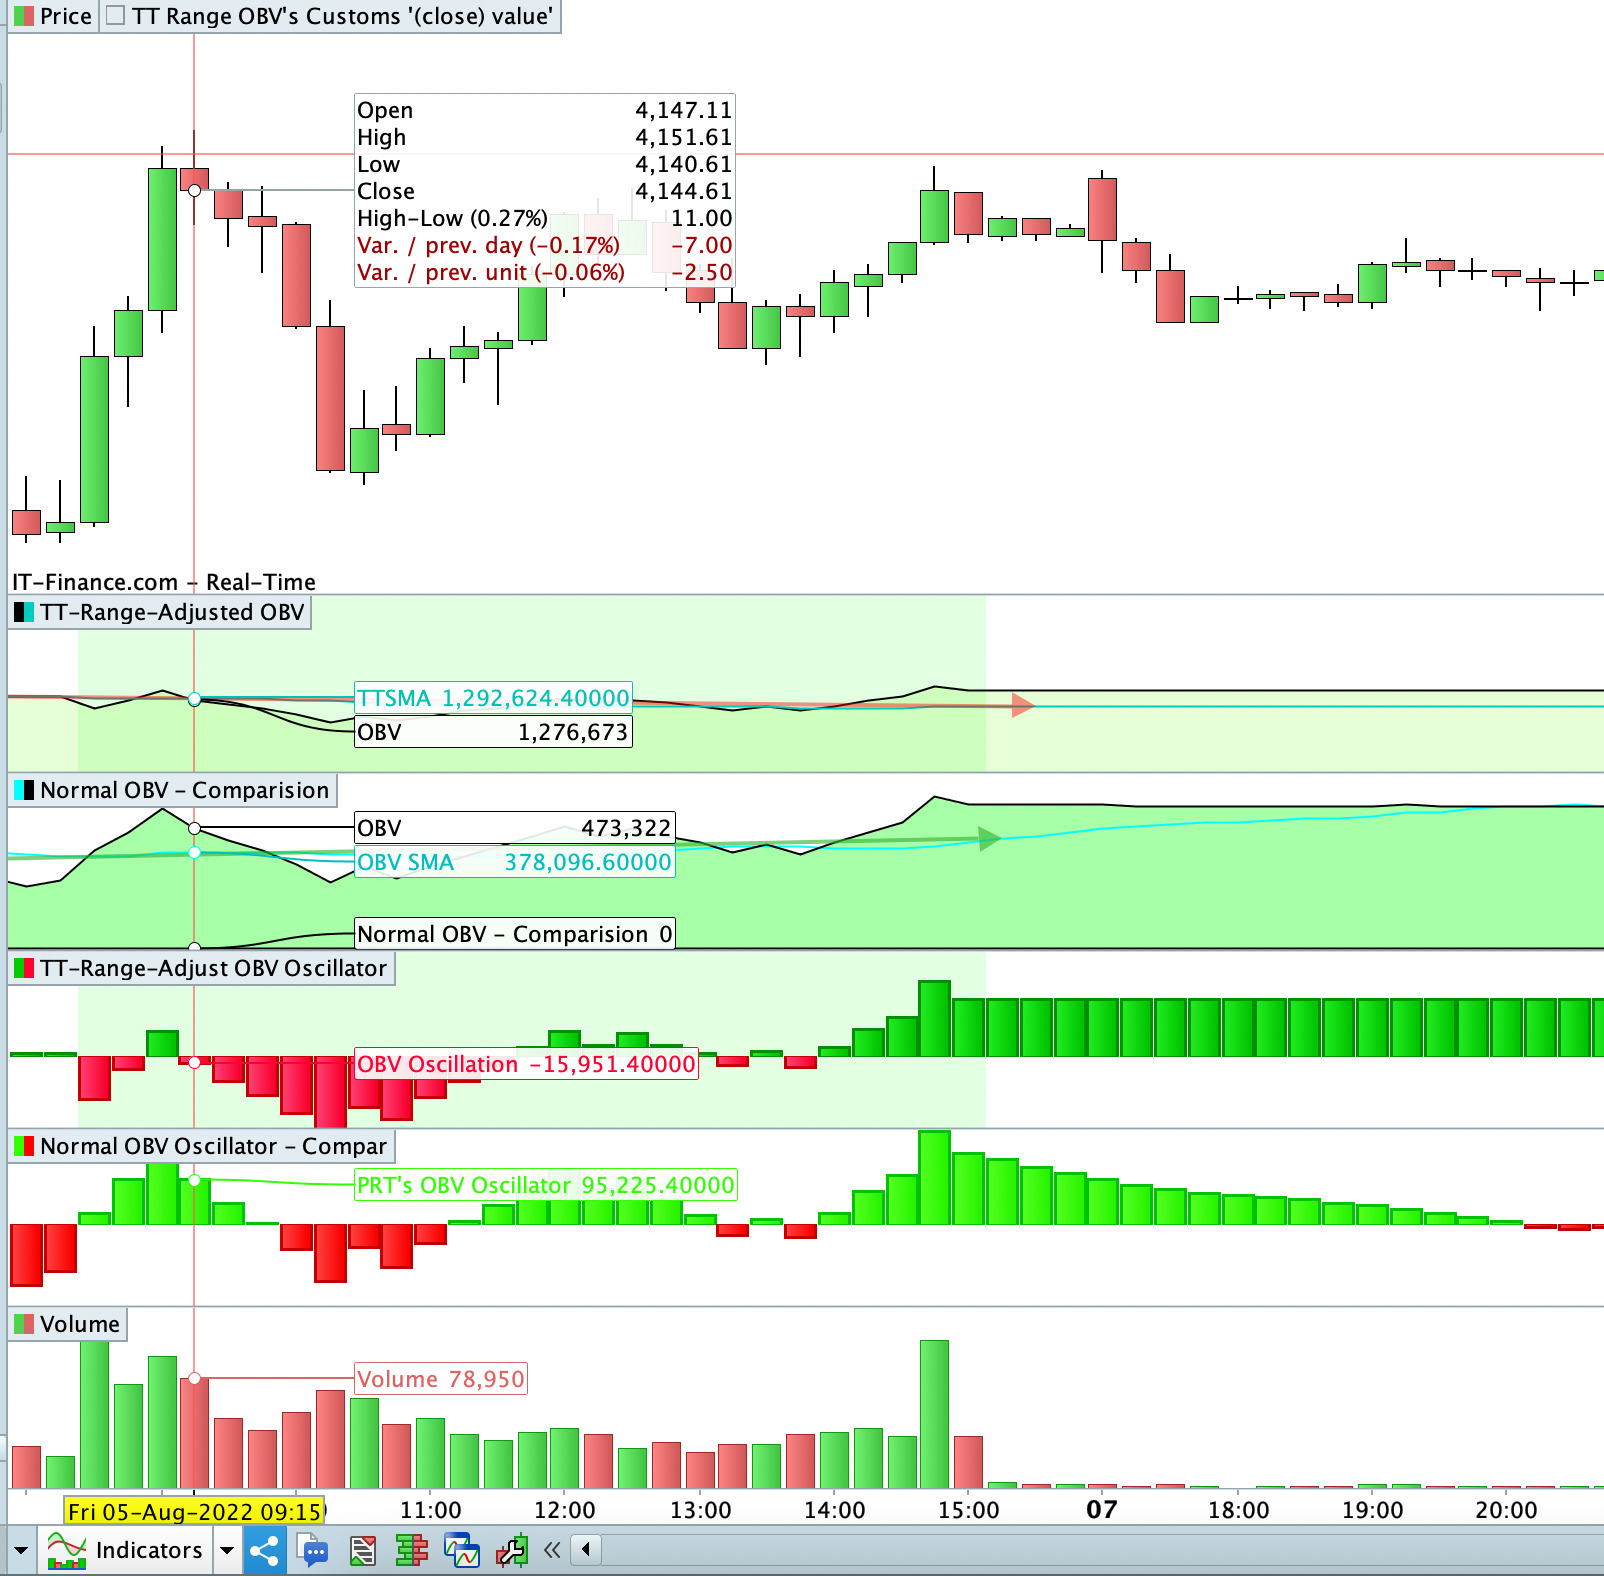
Example picture attached of OBV going completely different directions / trend-wise for the PRT’s 24hr vs trading hours adjusted, cos the PRTs 24hour calculations (Labelled: ‘Normal OBV – comparison’) has volume = 0 (or minimal) when most it’s price movement occurs, and then on opening has a green bar and counts that as a Bullish/Uptrend which is wrong (that should be counted as a red bar, relative to the last official markets close, where it’s gapped down 1%). So it gives a value of OBVol + 100,000, but in the real world it should be OBVol – 100,000 at the opening (as close < close[1] by 1%).
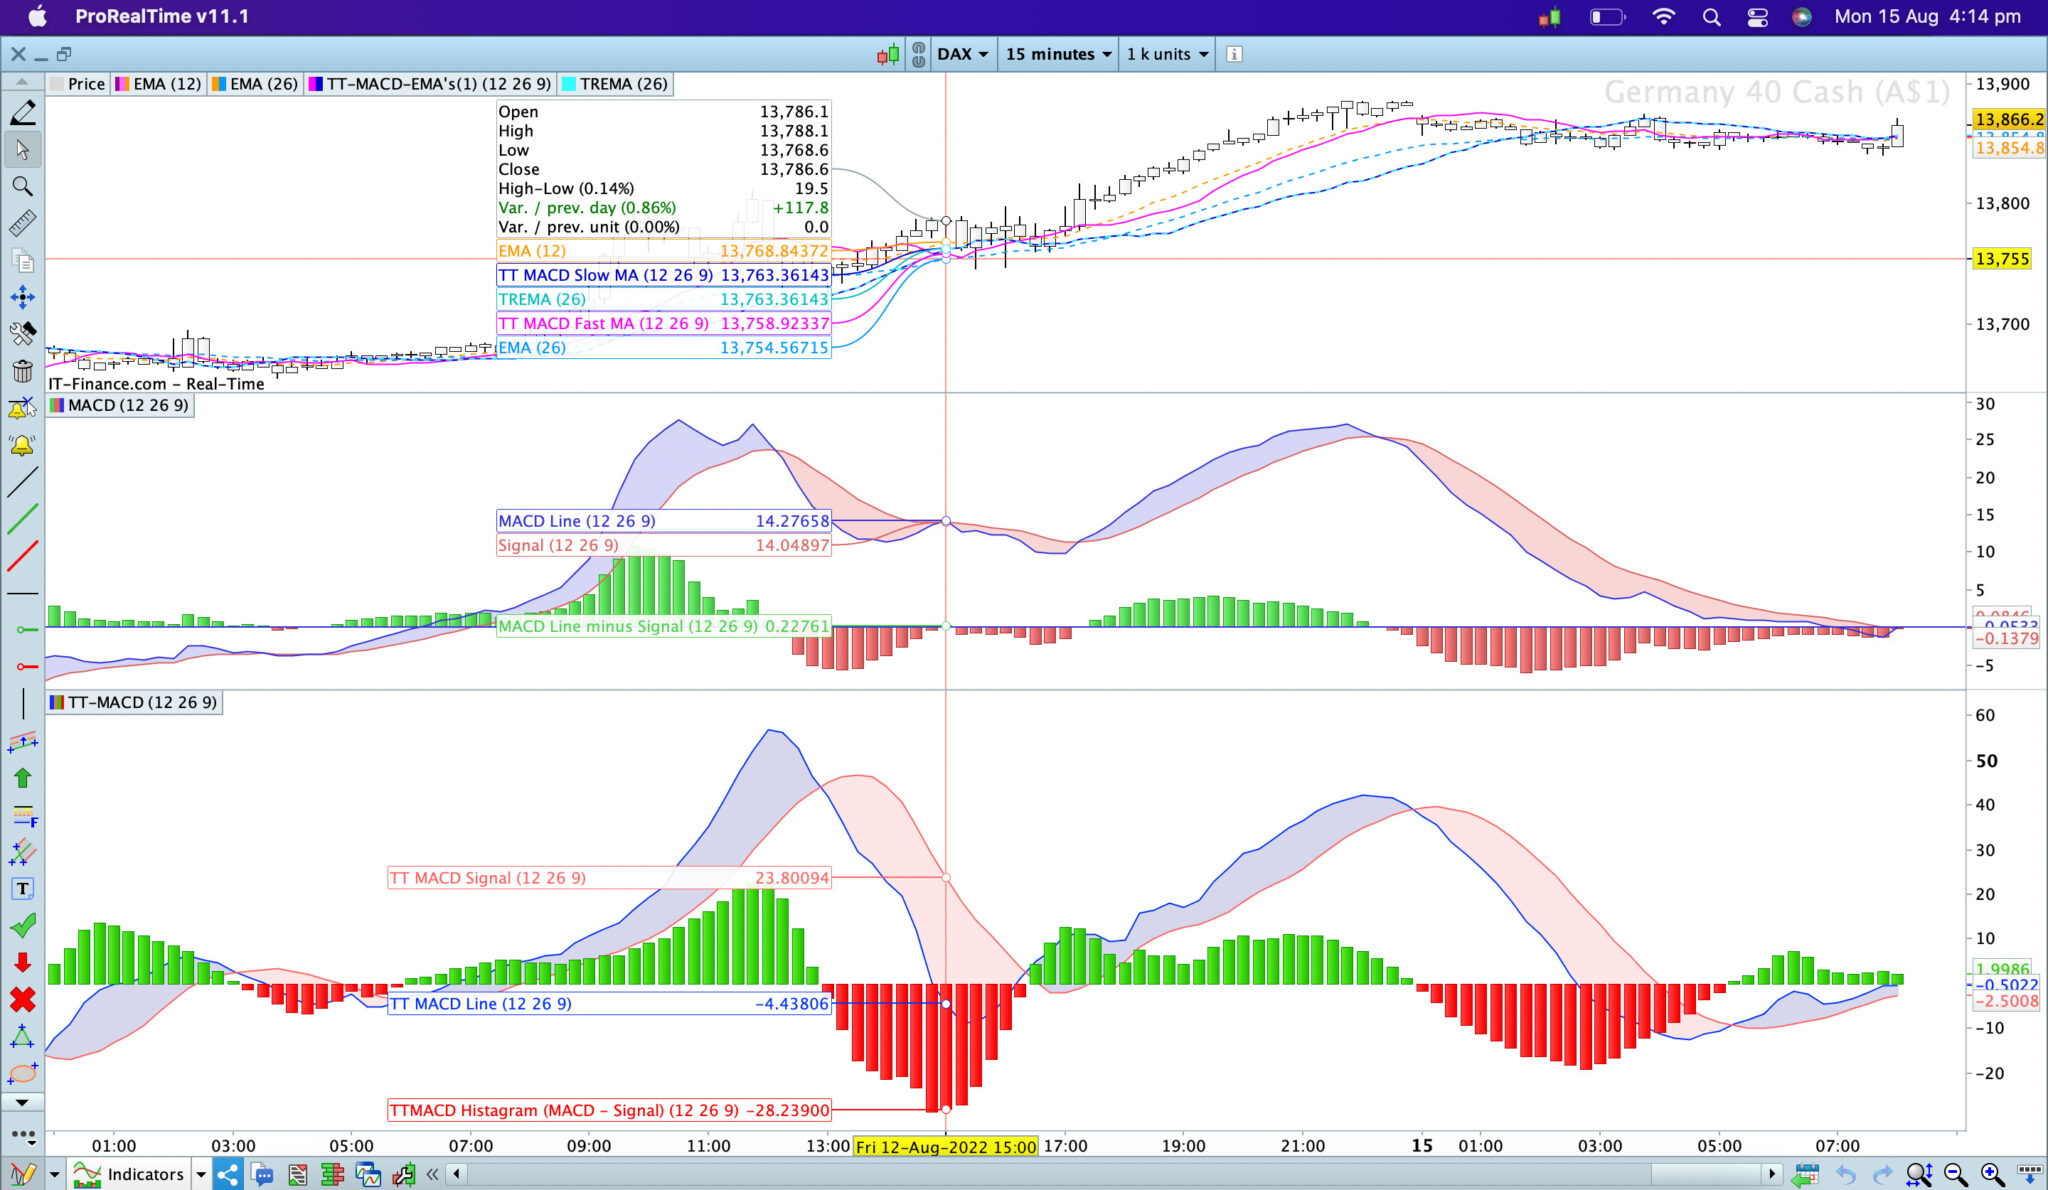
I have been working my way through EMA’s and MACD’s, and appears i have hit an issue. If you see the attached image: plotting the Fast and Slow EMA’s from the MACD calculations using the same way they calculated on the post here: TRSMA – TREMA – TRWMA , there are different values to the PRT inbuilt EMA’s. I have also plotted the TREMA from that post on the price to see, and it’s showing the same line as the calculations below, both being different to inbuilt even when i open all the 24 hours to calculate the same bars.
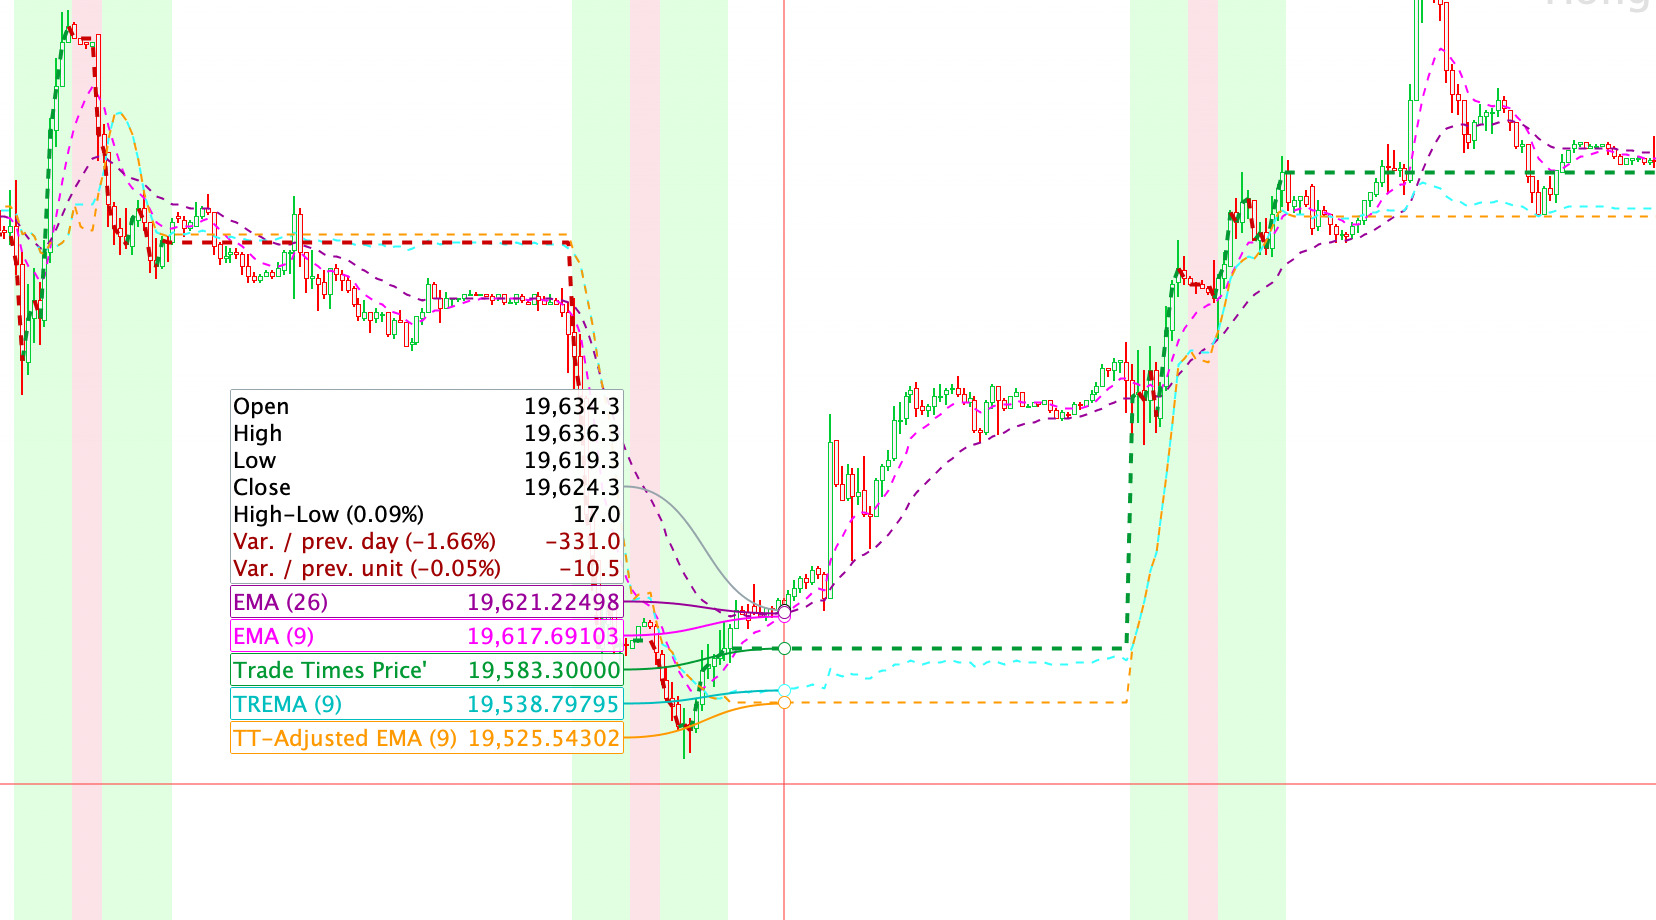
Im not sure what the issue is? I have noticed when plotting TREMA from that post (attached picture 2) it continues to move outside of the time-range both at the lunch break and also outside the market, aka its calculate something or taking some variable from whats occurring outside the range, which it shouldn’t be, as the values calculating the EMA = (close) should be a constant from EndTime (close of market) until StartTime (Start of Market), and the look-back (Periods) shouldn’t be changing neither, which so for Periods = 26 should be EndTime and the proceeding 25 from within market trade times. The Periods should only change at StartTime(Close) when +1 bar gets added to the calculations, that being the last 25 bars from yesterday (+/- days before) and the 1st bar from today.
StartTime = 000000 EndTime = 240000 // For markets with Lunch Breaks (eg HK and Japan) // LunchStartTime = 120000 // LunchEndTime = 120000 //For a standard calculation of the MACD - can be customised for your own liking, or for MACD Zero-lag claculations: //MACDPeriods1 = 12 //MACDPeriods2 = 26 //MACDPeriods3 = 9 // ===== Initial MACD - MA's values for calculate value (close) ONLY from within Time-Range : // IF (opentime >= StartTime AND opentime <= LunchStartTime) OR (opentime>=LunchEndTime and opentime<=EndTime) THEN IF (opentime >= StartTime AND opentime<=EndTime) THEN MACDTREMAT1 = close MACDTREMAT2 = close endif MACDTREMA1 = MACDTREMAT1 MACDTREMA2 = MACDTREMAT2 // ===== Loop 1 for the MACD's Fast Moving Average (EMA) : // EMA Smoothing = 2/(n+1) // For MACD Zero lag - DEMA Smoothing = EMA(EMAn) [DEMA=2×EMA(n) - EMA(EMAn)] MACDSmoothing1 = 2 / (MACDPeriods1 + 1) MACDi = 0 FOR MACDj = 0 TO 3000 IF (opentime[MACDj] >= StartTime AND opentime[MACDj] <= EndTime) THEN // IF (opentime[MACDj] >= StartTime AND opentime[MACDj] <= LunchStartTime) OR (opentime[MACDj]>=LunchEndTime and opentime[MACDj]<=EndTime) THEN MACDi = MACDi + 1 MACDTREMA1 = ((close[MACDj] - MACDTREMA1) * MACDSmoothing1) + MACDTREMA1 IF MACDi = MACDPeriods1 THEN BREAK ENDIF ENDIF NEXT // ===== Loop 2 for the MACD's Slow Moving Average (EMA) : MACDSmoothing2 = (2 / (MACDPeriods2 + 1)) MACDi2 = 0 FOR MACDj2 = 0 TO 3000 IF (opentime[MACDj2] >= StartTime AND opentime[MACDj2] <= EndTime) THEN // IF (opentime[MACDj] >= StartTime AND opentime[MACDj] <= LunchStartTime) OR (opentime[MACDj]>=LunchEndTime and opentime[MACDj]<=EndTime) THEN MACDi2 = MACDi2 + 1 MACDTREMA2 = ((close[MACDj2] - MACDTREMA2) * MACDSmoothing2) + MACDTREMA2 IF MACDi2 = MACDPeriods2 THEN BREAK ENDIF ENDIF NEXT // == The MACD Line's value: TTMACD = (MACDTREMA1 - MACDTREMA2) // === Loop 3 : The Signal Line's EMA: MACDSmoothing3 = 2 / (MACDPeriods3 + 1) MACDi3 = 0 TTSignalLine = TTMACD // Signal Line initial is set to MACD FOR MACDj3 = 0 TO 3000 IF (opentime[MACDj3] >= StartTime AND opentime[MACDj3] <= EndTime) THEN // IF (opentime[MACDj3] >= StartTime AND opentime[MACDj3] <= LunchStartTime) OR (opentime[MACDj3]>=LunchEndTime and opentime[MACDj3]<=EndTime) THEN TTSignalLine = ((TTMACD[MACDj3] - TTSignalLine) * MACDSmoothing3) + TTSignalLine MACDi3 = MACDi3 + 1 IF MACDi3 = MACDPeriods3 THEN BREAK ENDIF ENDIF NEXT // === The MACD: MACD Line - Signal Line: TTHistogram = TTMACD - TTSignalLine RETURN TTMACD AS "TT MACD Line",TTSignalLine AS "TT MACD Signal", TTHistogram AS "TTMACD (MACD - Signal)"Kind of disclaimer : I was the one pointing you to the TREMA and such, of which I knew it existed as some general solution created by Roberto. Now, looking at the content (which I really never did before), maybe I have an “ICT programmers” hunch, that this can’t work – or at least not as easy as I see at a glance from the used loops. But let’s see.
Could you apply the normal Start- and End-dates instead of the 24/7 you currently use (in your last post).
Same for the lunch times ? (not only it is commented out now, but also start end end times are equal at 120000).
And post the code of that ?I only want to be sure we look at the same consistent picture you work on.
SkippyTrader thanked this postHi skippy… here’s something I knocked up based on what I think your after.
The time setting are just to test multiple sessions on 15sec to see what happens.
All calculations are done within the ‘in session’ block. Count keeps track of valid bars. Inside the block:
if(1) and if(2) accumulate values for a 12 and 26 sma.
if(3) calculates the sma’s and these become the default ema values. and the first macd line can now be calculated as well.
if(4) calculates the future 12/26 ema,s after the default one’s, also The macd line values.
if(5) accumulate values for a 9sma of the macd line.
if(6) calculates the macd signal default value and 1st histogram value
if(7) calculates future macd signal values, and histogram values.
I think this is closer to what you want. It creates the standard MACD but only in a valid session. Out of session the MACD freezes till the next session, and then continues. Though it looks back at the bar before the next session starts, the values are the same as the last time they were calculated at the end of the previous session. This because the values are not re-calculated out of a session.
The count ensure that if the beginning setup is over 2 sessions, only session bars count. Watch out for midnight!
It appears to be doing what I expect , but not got time to do detailed testing. Check it against 24h and stock macd.
regards
defparam drawonlastbaronly = true
once count = 0
once ema26 = undefined
once ema12 = undefined


StartTime = 000000 // set times for 1st session test
EndTime = 030000

if opentime > endtime then
StartTime = 030700 // set times for 2nd session test
EndTime = 032000
endif

if opentime > endtime then
StartTime = 040000 // set times for 3rd session test
EndTime = 043000
endif


// period and constants for ema's
period1 = 26
k1 = 0.074074  // = 2/(26+1)  est @ 6 d.p.
period2 = 12
k2 = 0.153846  // = 2/(12+1)  est @ 6 d.p.
//k2 = 2/(period2+1)
period3 = 9
k3 = 0.200000  // = 2/(9+1)  est @ 6 d.p.


// in session block
If (opentime >=  StartTime and opentime <= EndTime) then  // valid session bar
backgroundcolor(120,120,60,120)

count = count + 1  // keep count of valid bars

//(1)
if count <= 26 then  // accumulate 26 values for a sma  1-26
sma26 = sma26 + close
endif
//(2)
if count >14 and count <= 26 then // accumulate 12 values for a sma 15-26
sma12 = sma12 + close
endif
//(3)
if count = 26 then // calculate default ema's (1st)
ema26 = sma26/period1  // calculate the sma as first (previous) 26 ema
ema12 = sma12/period2  // calculate the sma as first (previous) 12 ema

mdLine = ema12 - ema26 // calculate macd with valid ema's
endif
//(4)
if count > 26 then // calculate ema's (2nd,...)
ema26 = (close - ema26[1]) * k1 + ema26[1] // calculate ema's 2nd and onwards
ema12 = (close - ema12[1]) * k2 + ema12[1] // calculate ema's 2nd and onwards

mdLine = ema12 - ema26 // calculate macd with every new  valid ema's
endif
//(5)
if count >=26 and count = 34 then //accumulate 9 values for signal line
sma9 = sma9 + mdline
endif
//(6)
if count = 34 then // default macd signal
mdSignal = sma9/period3

mdHistogram = mdLine - mdSignal
endif
//(7)
if count > 34 then
mdSignal = (mdLine - mdSignal[1]) * k3 + mdSignal[1] // calculate ema's 2nd and onwards

mdHistogram = mdLine - mdSignal
endif

drawHline(0)coloured(0,0,255,150) // zero line
drawtext("Valid bar Count #count#",0,10)anchor(bottom) coloured("pink") // valid bar count
endif
// histogram color change
r=255
g=113
b=113
if mdHistogram >= 0 then
r=68
g=198
b=68
endif

return mdline as"macdLine" coloured(0,0,255,155), mdsignal as"macdSig" coloured(255,0,0,155), mdHistogram as"macdHisto" coloured(r,g,b,210)style(histogram,1)
//return close as"close", ema26 as"ema26", ema12 as"ema12"
/*
//timeline

// valid bar count
1,2,3,4,5,6,7,8,9,10,11,12,13,14,15,16,17,18,19,20,21,22,23,24,25,26,27,28,29,30,31,32,33,34,...
// 26 ema
1,2,3,4,5,6,7,8,9,10,11,12,13,14,15,16,17,18,19,20,21,22,23,24,25,26,...
// 12 ema
#,#,#,#,#,#,#,#,#,##,##,##,##,##,#1,#2,#3,#4,#5,#6,#7,#8,#9,10,11,12,...
//macd Line
#,#,#,#,#,#,#,#,#,##,##,##,##,##,##,##,##,##,##,##,##,##,##,##,##,#1,#2,#3,#4,#5,#6,#7,#8,#9,...
// macd signal
#,#,#,#,#,#,#,#,#,##,##,##,##,##,##,##,##,##,##,##,##,##,##,##,##,#1,#2,#3,#4,#5,#6,#7,#8,#9,...
// macd histogram
#,#,#,#,#,#,#,#,#,##,##,##,##,##,##,##,##,##,##,##,##,##,##,##,##,##,##,##,##,##,##,##,##,#1,...
*/
SkippyTrader thanked this postHi, PeterSt, thanks, yeah name looked familiar > thanks for initial directions still. I only commented those out and made it 24hours so i could compare what the chart looked like compared to the PRT inbuilt to see if it was matching or working as what we would expect.
The MACD version in the last post as such, say if we set to Hong Kong trade (which is what the screenshot my prior post was), then:
// MACD Calculations on Trade Hour Bars Only - Example for HK market below:


Starttime = 093000
EndTime = 160000

// For markets with Lunch Breaks (eg HK and Japan)
LunchStartTime = 120000
LunchEndTime = 130000


//For a standard calculation of the MACD - can be customised for your own liking, or for MACD Zero-lag claculations:

//MACDPeriods1 = 12
//MACDPeriods2 = 26
//MACDPeriods3 = 9

// ===== Initial MACD - MA's values for calculate value (close) ONLY from within Time-Range :

// IF (opentime >= StartTime AND opentime <= LunchStartTime) OR (opentime>=LunchEndTime and opentime<=EndTime) THEN

 IF (opentime >= StartTime AND opentime <= LunchStartTime) OR (opentime >=LunchEndTime and opentime<=EndTime) THEN

MACDTREMAT1 = close
MACDTREMAT2 = close

endif

//====  Setting the values so it continues to chart a straight line after hours:

MACDTREMA1 = MACDTREMAT1
MACDTREMA2 = MACDTREMAT2


// =====  Loop 1 for the MACD's Fast Moving Average (EMA) :

// EMA Smoothing =  2/(n+1)
// For MACD Zero lag - DEMA Smoothing = EMA(EMAn) [DEMA=2×EMA(n) - EMA(EMAn)]

MACDSmoothing1 = 2 / (MACDPeriods1 + 1)


MACDi  = 0

FOR MACDj = 0 TO 3000
// IF (opentime[MACDj] >= StartTime AND opentime[MACDj] <= EndTime) THEN
IF (opentime[MACDj] >= StartTime AND opentime[MACDj] <= LunchStartTime) OR (opentime[MACDj]>=LunchEndTime and opentime[MACDj]<=EndTime) THEN

MACDi = MACDi + 1
MACDTREMA1 = ((close[MACDj] - MACDTREMA1) * MACDSmoothing1) + MACDTREMA1

IF MACDi = MACDPeriods1 THEN
BREAK
ENDIF
ENDIF
NEXT


// =====  Loop 2 for the MACD's Slow Moving Average (EMA) :


MACDSmoothing2 = (2 / (MACDPeriods2 + 1))
MACDi2  = 0

FOR MACDj2 = 0 TO 3000
// IF (opentime[MACDj2] >= StartTime AND opentime[MACDj2] <= EndTime) THEN
 IF (opentime[MACDj2] >= StartTime AND opentime[MACDj2] <= LunchStartTime) OR (opentime[MACDj2]>=LunchEndTime and opentime[MACDj2]<=EndTime) THEN

MACDi2 = MACDi2 + 1
MACDTREMA2 = ((close[MACDj2] - MACDTREMA2) * MACDSmoothing2) + MACDTREMA2

IF MACDi2 = MACDPeriods2 THEN
BREAK
ENDIF
ENDIF
NEXT


// == The MACD Line's value:

TTMACD = (MACDTREMA1 - MACDTREMA2)


// === Loop 3 :  The Signal Line's EMA:

MACDSmoothing3 = 2 / (MACDPeriods3 + 1)
MACDi3  = 0
TTSignalLine = TTMACD // Signal Line initial is set to MACD

FOR MACDj3 = 0 TO 3000
// IF (opentime[MACDj3] >= StartTime AND opentime[MACDj3] <= EndTime) THEN
 IF (opentime[MACDj3] >= StartTime AND opentime[MACDj3] <= LunchStartTime) OR (opentime[MACDj3]>=LunchEndTime and opentime[MACDj3]<=EndTime) THEN

TTSignalLine = ((TTMACD[MACDj3] - TTSignalLine) * MACDSmoothing3) + TTSignalLine
MACDi3 = MACDi3 + 1

IF MACDi3 = MACDPeriods3 THEN
BREAK
ENDIF
ENDIF
NEXT

// === The MACD Histogram = MACD Line - Singal Line:

TTHistogram  = TTMACD - TTSignalLine

//==== Graph Trade Hours:

If (opentime>=StartTime and opentime<=LunchStartTime) OR (opentime>=LunchEndTime and opentime<=EndTime) then
backgroundcolor(10,255,10, 30)
endif

RETURN TTMACD AS "TT MACD Line",TTSignalLine AS "TT MACD Signal", TTHistogram AS "TTMACD (MACD - Signal)"
The ones i definitely know works, is the one on that other post for the SMA, and the i made for OBV (On Balance Volume) => as i can calculate on paper what the numbers should actually be and compare as such. So ive attached the Code File for the OBV below. The issues in calculations getting stuck with i think occur when we try add some some further calculations to it, eg. the ‘smoothing’ of a EMA, or a Wilder etc within a loop .. Ive attached other indicators i’ve worked out so far in files attached if your interested to check they work :
1. OBV Oscillator (+/- OBV Percentage Indicator) > and the OBV Value Indicator ( basically just the first 1/2 of this indicator) > and a OBV divergence indicators also just this with a few extra lines and which appears (on my visual observations, and on backtesting) to be more accurate at picking divergences then just using the PRT 24hr one.
2. Trend-Range Filter (something similar to PRT Bands or really any other Trend-range breakout based indicators) > undetermined if more accurate, backtesting showing me very similar results vs PRT’s 24hr chart
3. Average True Range (ATR) > which can then be modified / used in the various other indicators that use a ATR in their calculations > appears on backtesting to be more accurate at determining the right entry and exits compared to using the PRT inbuilt ATR, BUT doesn’t look right relative to the inbuilt ATR [big differences when i take it out to a 24hr window for both, similar to the MACD’s calculations].
4. ADX and DMI > also doesn’t look right but im not using a wilder but a standard MA here > depending the market-conditions backtesting is more accurate or less accurate compared to the PRT’s. Appears to be better results / more accurate in bad (range or bearish) markets, less profitable in good (trending) markets > possible because if move range to only trade time bars makes the ADX and DMI measures more sensitive to changes and thus for filtering out trades ?PeterSt thanked this postIt appears to be doing what I expect , but not got time to do detailed testing. Check it against 24h and stock macd.
Thanks Druby, I will run some testing and backtesting on this later today (?tomorrow your time) to see if it’s working as we would expect. Will let you know. Strangely some the things i’ve done don’t look like they doing what should (very different to inbuilt) BUT have produced significantly better results on backtests > bringing in my pre-existing bias in an uncontrolled and unblinded research methodology ? > as the saying goes in my own industry (medical) you can always find something or manipulate any data-set to match your hypothesis if you try hard enough.
It appears to be doing what I expect
Hi Druby, i am my way through analysis of it now, but at a short-term time frame (visual observation) it appears more accurate signals relative to the markets subsequent movements compared to the PRT inbuilt MACD.
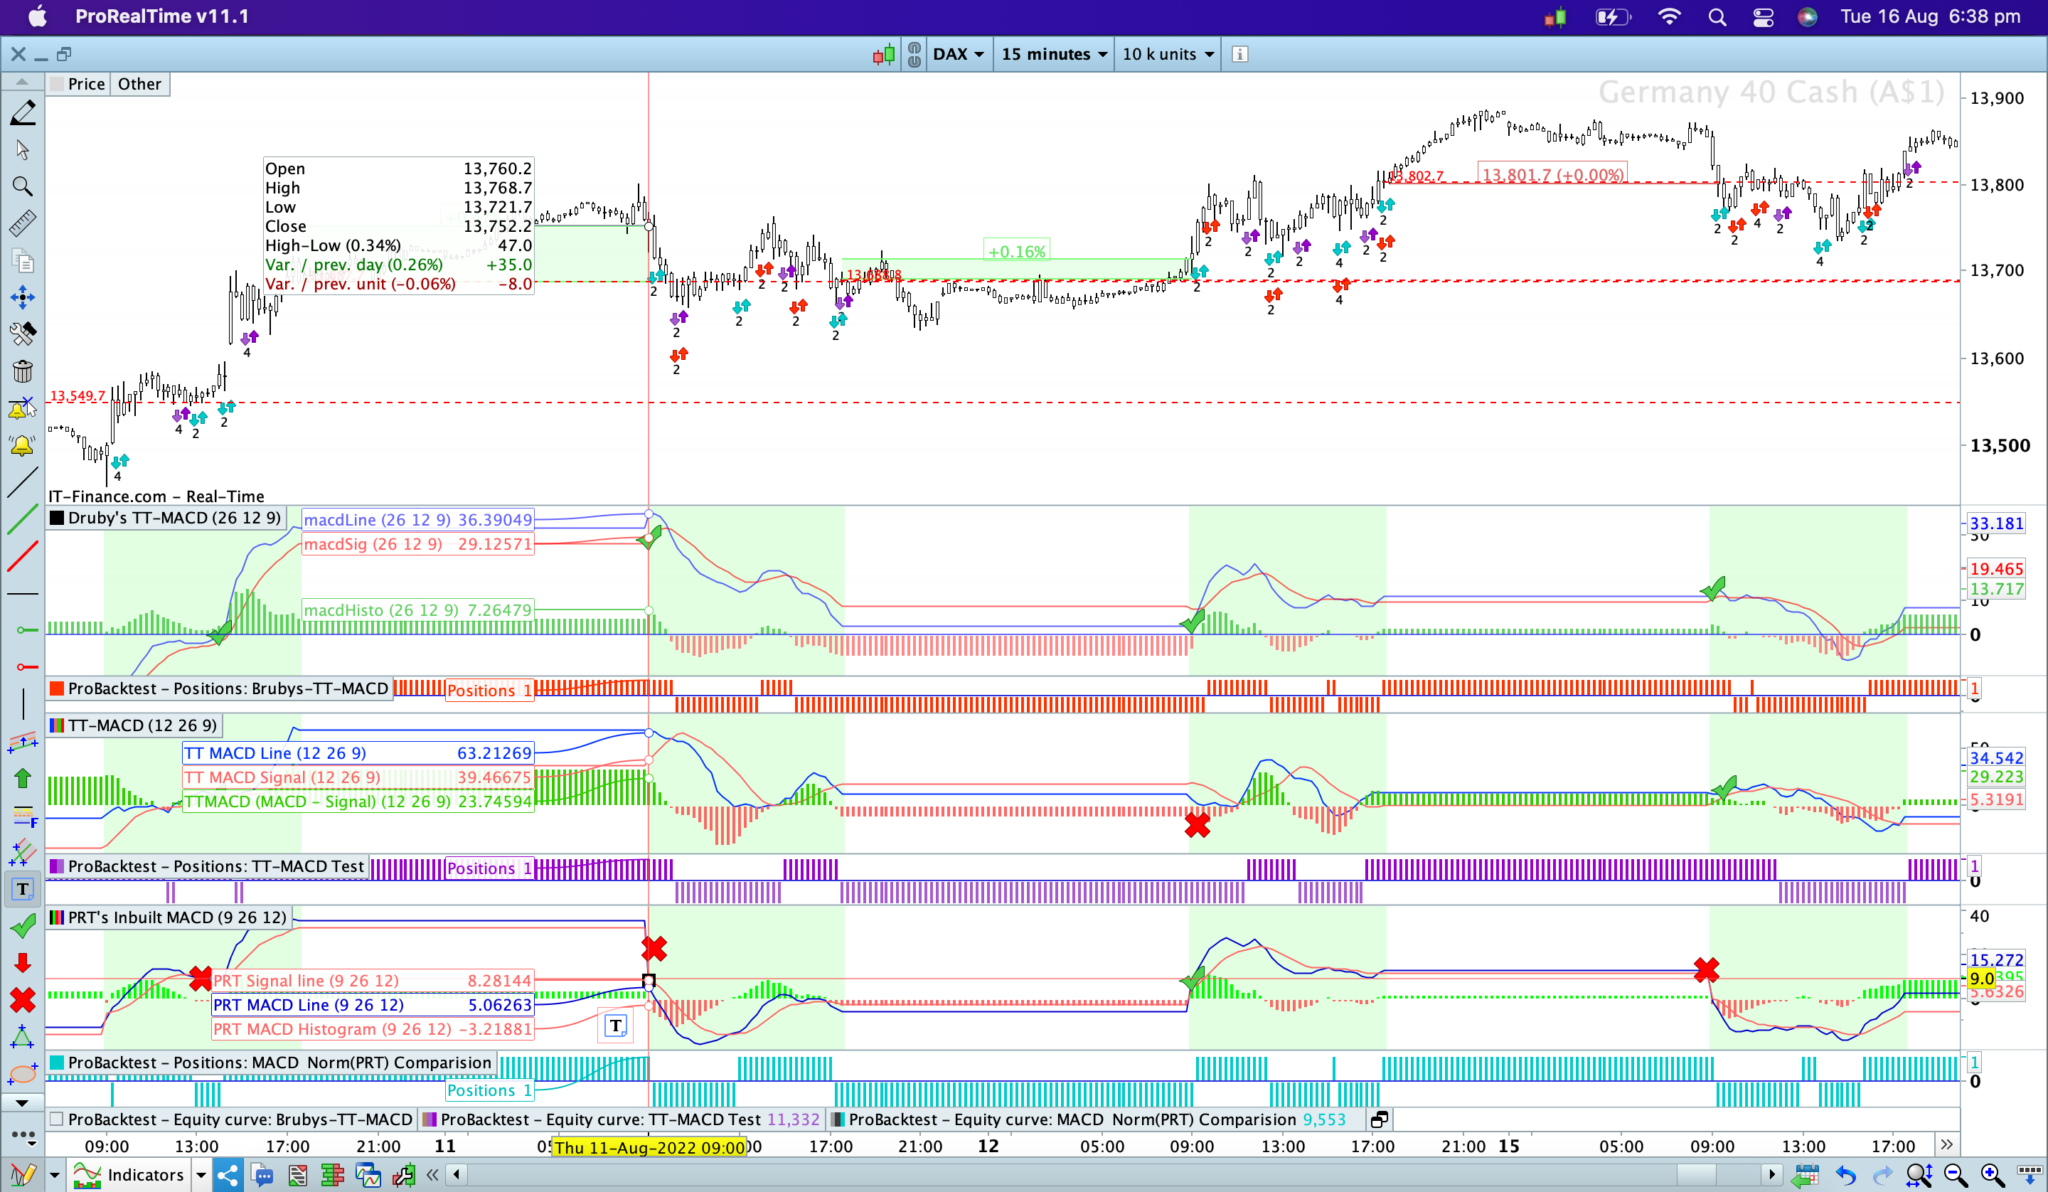
1. One session, i tested on the DAX example here, it was indeed picking up the correct movements with less errors compared to the inbuilt (see the ticks and crosses).
[attachment file=”199116″]
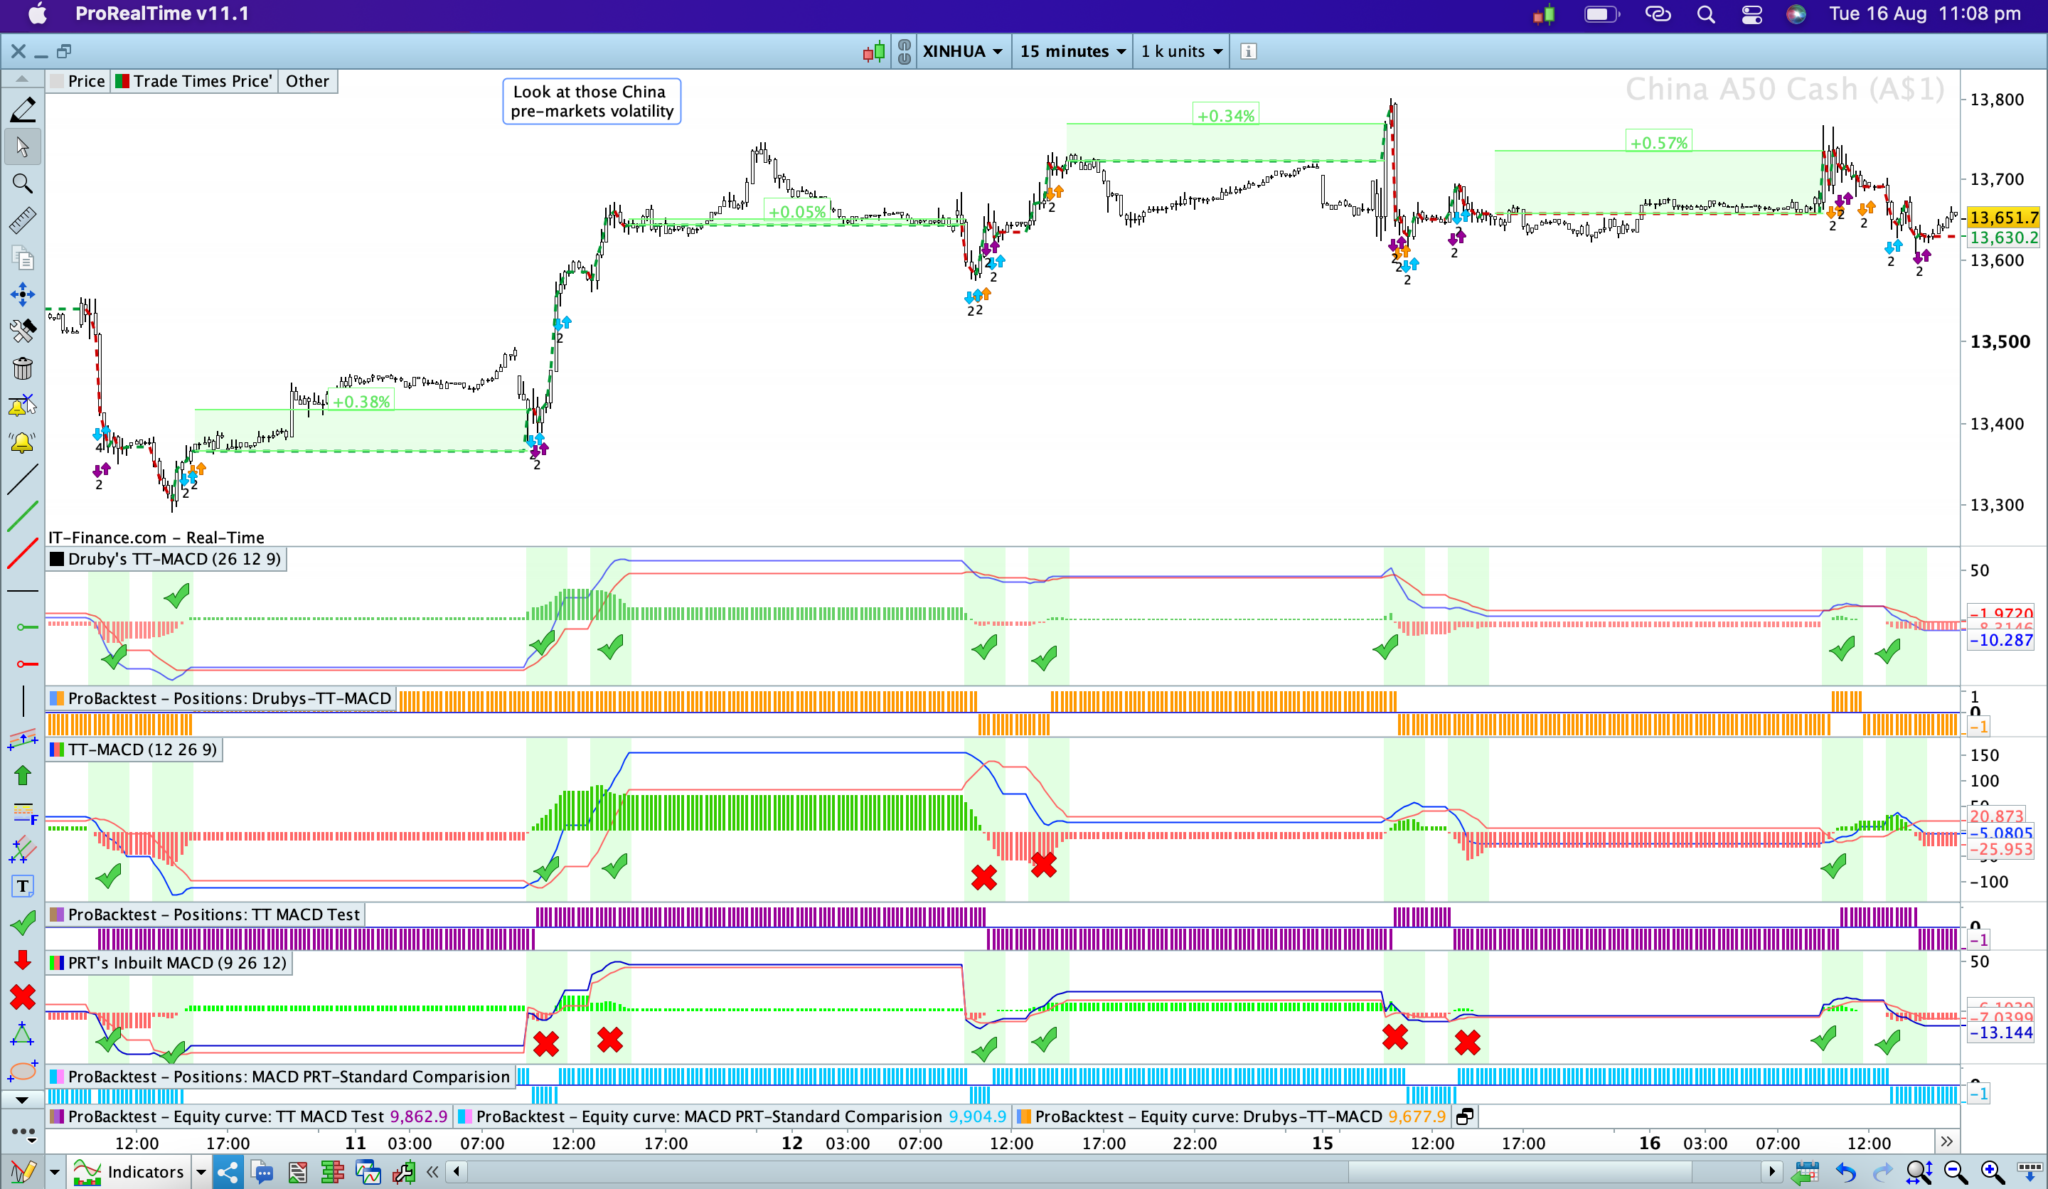
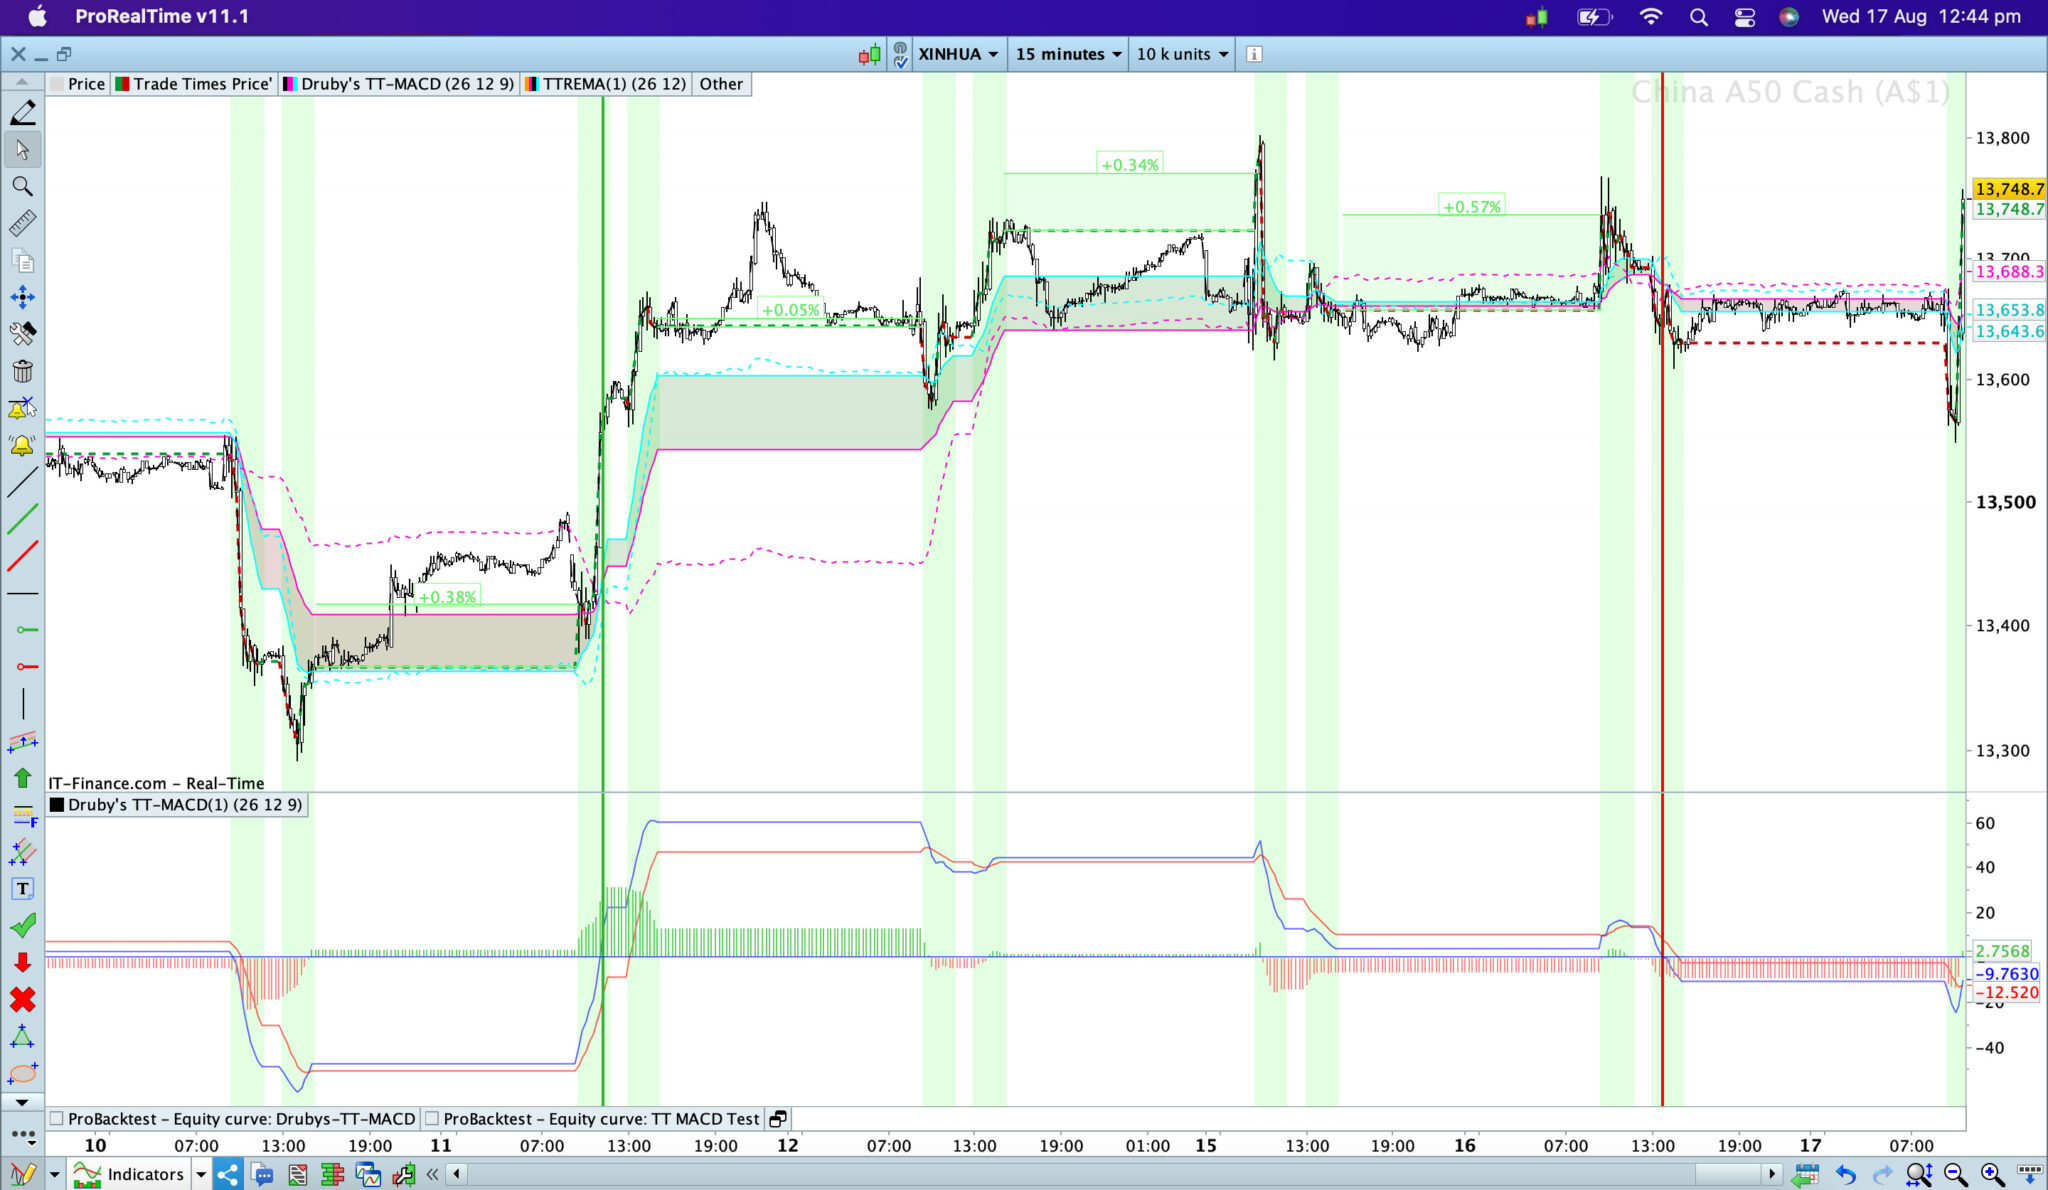
2. Two session markets: i used Shanghai Stock Exchange (ChinaA50 Index) here as one of the shortest trade windows in world with only 4 hours total markets open during a regular trade day with 2 x 2 hour sessions (9.30 am to 11.30am, and 1pm to 3pm) and a 1.5 hour lunch between the two sessions.Looking at the PRT stock/inbuilt standard MACD, the bottom one, you see so many false signals relative to the movement > with 40% of the sessions or their MACD crossovers being wrong direction. No surprise if you look at that graph for the last week, and some big volatile bar movements outside of markets especially on the 4 bars (on a 15min timeframe) before the market opened on the 15th when it shot down about 0.5% and back up 1% over a couple of bars, before opening up just 0.34% from yesterday (day before) close. Moving up, to the one i attempted is a bit better, but was slow on the 12th of Aug > appears to be slower in general when look at the DAX example too. Then the top one being what you coded, what i can see is almost all the crossover signal being correct (for making trade decisions) from this last week, and the movements at the start of each session being correct. Ive tested HK (Hang Seng Index), similar results too.
[attachment file=”199115″]
I am still testing (and running backtests) over it across other Asian markets, will give more details on a thorough check soon.
Hi Druby,
So ‘paper- based’ calculations, your code appears to be calculating right. So in the picture below i charted and compared the EMA’s and the values, vs the TREMA (the dashed lines on the price are TREMA’s EMA’s) from this post Time Range Moving Averages (Simple-Exponential-Weighted): TRSMA – TREMA – TRWMA.
[attachment file=”199141″]
Paper/Human Calculated to Check Values of the Range Coding
All these random notes might make no sense, but they are just random numbers from my paper-based calculations and checking each part of the MACD calculations as i go through the MACD.
* TREMA (Other Post) Calculations for EMA12 = WRONG! > STOP HERE!
Druby’s TT MACD:
* EMA 12 values calculating average right:
(close values) … 13556.5, 13585.5, 13576, 13607, 13623, 13652, 13656, 13661, 13647, 13643, 13644, 13607.3…
(EMA Values) 13427.6, 13470.5, 13486.7, 13505.3, 13,523.4, 13543.2, 13560.6, 13576.1, 13587, 13643, 13606, 13602.3 …
= YES
* EMA 12 following its trend correctly = YES
* EMA12-EMA26 calculation right:
470.5-447.8, 470.5-447.8, 505.3-468.4, 523.4-479.9, 543.2-425.7, 560.6-504.8,
= 22.7, 22.7, 36.9, 43.5 … (= YES)
* MACDLine Values Correct? Corresponding with the EMA12-EMA26 = YES:
.. 22.7, 22.7, 36.86, 43.5, 50.6, 55.85, 59.7, 61, 61, 60.3, 50.43, 50.19, 45.12, 47.2, 23..
* MACDLine should be reducing at start trade on 12th, as EMA12-EMA26 narrows = YES
* MACDLine should cross-up of zero-line at EMA12/EMA26 Bullish crossover at 11.15am on 11th = YES, and down at Bearish Crossover on 26th = YES
* MACSig [9] on above MACDLine Values – calculating correct?
22.7, 22.7, 36.86, 43.5, 50.6[9], 55.85[8], 59.7[7], 61[6], 61[5], 60.3[4], 50.43[3], 50.19[2], 45.12[1], 47.2, 23..
* Should be rising until most recent closed bar is 45.12 [1] = as prior to this the recent bars [1-4] are all greater then the older bars still [5-9] , but at 10.00am on 12th, when hits the 45.12 MACD this changes, and the [1-4] values are less then the [5-9] values in the order train, so this bar or the next bar the MACDSignal line should turn down = YES it does!Accuracy Backtesting vs PRT’s Inbuilt MACD (200K Bars on a 15min)
Disclaimer: this is not a trading strategy, i am only doing this to check this indicators giving the right Entry and Exit signals and what it’s accuracy vs the inbuilt PRT MACD might be.
This backtest is only using MACDLine> MACDSignalLine crossovers as Entry and Exit criteria, nothing else. The divergence tests was simply based on PRTs code posts elsewhere, and closing them after 5 bars have past. The MACD ProRealTime inbuilt indicator running over a 24hr chart. ALL trading (open/close) is only occurring in trade hours even if the PRT inbuilt MACD was used. To try make testing ‘ Valid’ ands ‘Reliable’ without false bias, ALL Charts and strategy type were as such blinded to me, even the PRT inbuilt chart blocked out outside trade hours too so not possible to see which MACD was which > random encrypted names used until after the results recorded on paper and analysed! Checking mostly the % right (aka the winning %), don’t worry what the profit/lose as this isn’t a trading strategy but purely done as an accuracy test.Two session Markets:
* China A50 Index (Shanghai & Shenzhen Stock Exchanges) > backtesting only possible for China up to March 2021 (so not possible to do a 200K bars backtest on China markets).
MACD Crossovers
– Druby’s TT MACD: 42%
– Skippy’s TT MACD: 41%
– PRT’s Inbuilt MACD: 39%Divergence Signals:
– Druby’s TT MACD: 62.5%
– Skippy’s TT MACD: 53%
– PRT’s Inbuilt MACD: 53%* HangSeng Index (Hong Kong Stock Exchange):
MACD Crossovers
– Druby’s TT MACD: 37%
– Skippy’s TT MACD: 47%
– PRT’s Inbuilt MACD: 38.2%Divergence Signals:
– Druby’s TT MACD: 56%
– Skippy’s TT MACD: 51%
– PRT’s Inbuilt MACD: 49%* Nikkei 225 (Tokyo Stock Exchange):
MACD Crossovers
– Druby’s TT MACD: 35%
– Skippy’s TT MACD: 45%
– PRT’s Inbuilt MACD: 35%Divergence Signals:
– Druby’s TT MACD: 43.2%
– Skippy’s TT MACD: — Parsing Error —
– PRT’s Inbuilt MACD: 51%One session market:
* Germany/DAX
MACD Crossovers
– Druby’s TT: 35.19%
– Skippy’s TT: 45.89%
– PRT Inbuilt MACD: 34.7%Divergence Signals:
– Druby’s TT: 65.3%
– Skippy’s TT: 59.4%
– PRT Inbuilt MACD: 55.56%On all tests above, interesting fact is the PRT inbuilt MACD always had the most trades, on average it had about 2x as many trades as the Druby’s tests. > my hypothesis is ? the is more crossovers or swings with the inbuilt due to it taking prices from the 24hrs and the pre-market volatility swings.
Analysis: On backtesting on a ‘correct signal’ perspective, for the MACD crossovers there wasn’t too much difference between the Druby’s TT MACD and PRT’s inbuilt 24hrs MACD, on pure %winning as per above. In terms of detecting correct divergence signals (with price movement occurring within 5 bars after the signal), Druby’s code was far superior in all markets except the Nikkei. Although analysis i was only looking at how accurate, aka % right, what a deeper analysis does show though is what the equity line looks like aka how stable/reliable in different markets. Druby’s looked more accurate and better within choppy markets at detecting the right movement, but MACD looked better in Bullish steady trending markets (but then spinning around blindfolded whilst drunk at a pub throwing darts to determine your trade entries/exit would produce winning results in a strong bull market). Again probably not relevant to the purpose of backtesting here, but the profits were superior in all backtests of the Druby version (MACD crossover and Divergences) vs the MACD inbuilt version for Asian markets. Except for the DAX the profits were better for PRT Inbuilt MACD, the DAX/Germany is a one session market that has extended market hours for securities trading too (has a pre and has a post market trading), where out of market trading data might be more correct? Most of the Asian markets don’t have such extended hours for securities trading, the ones that do its only +/- 30min from the regular market.
-
AuthorPosts
- You must be logged in to reply to this topic.
Indicators use 24hrs and NOT just Trade Hrs Bars > how fix these wrong signals ?
ProBuilder: Indicators & Custom Tools
Author
Summary
This topic contains 27 replies,
has 4 voices, and was last updated by ![]() SkippyTrader
SkippyTrader
3 years, 11 months ago.
Topic Details
| Forum: | ProBuilder: Indicators & Custom Tools |
| Language: | English |
| Started: | 08/04/2022 |
| Status: | Active |
| Attachments: | 21 files |
About personal data collected
The information collected on this form is stored in a computer file by ProRealCode to create and access your ProRealCode profile. This data is kept in a secure database for the duration of the member's membership. They will be kept as long as you use our services and will be automatically deleted after 3 years of inactivity. Your personal data is used to create your private profile on ProRealCode. This data is maintained by SAS ProRealCode, 407 rue Freycinet, 59151 Arleux, France. If you subscribe to our newsletters, your email address is provided to our service provider "MailChimp" located in the United States, with whom we have signed a confidentiality agreement. This company is also compliant with the EU/Swiss Privacy Shield, and the GDPR. For any request for correction or deletion concerning your data, you can directly contact the ProRealCode team by email at privacy@prorealcode.com If you would like to lodge a complaint regarding the use of your personal data, you can contact your data protection supervisory authority.