Hi
@JS,
Thank you very much for taking the time to explain the probabilities further, it’s much appreciated!
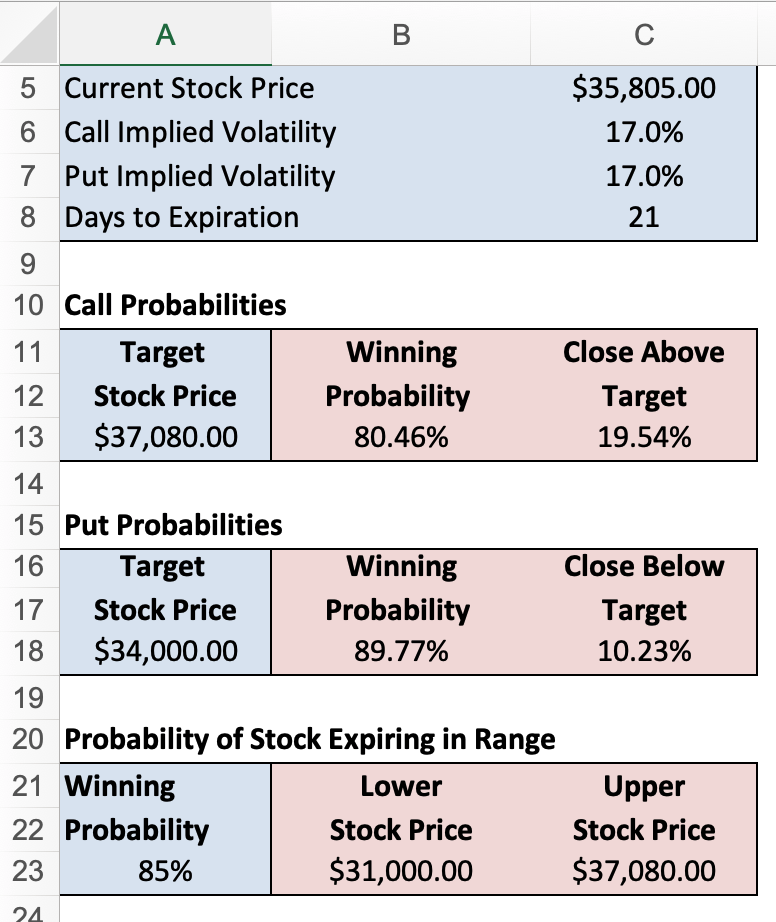
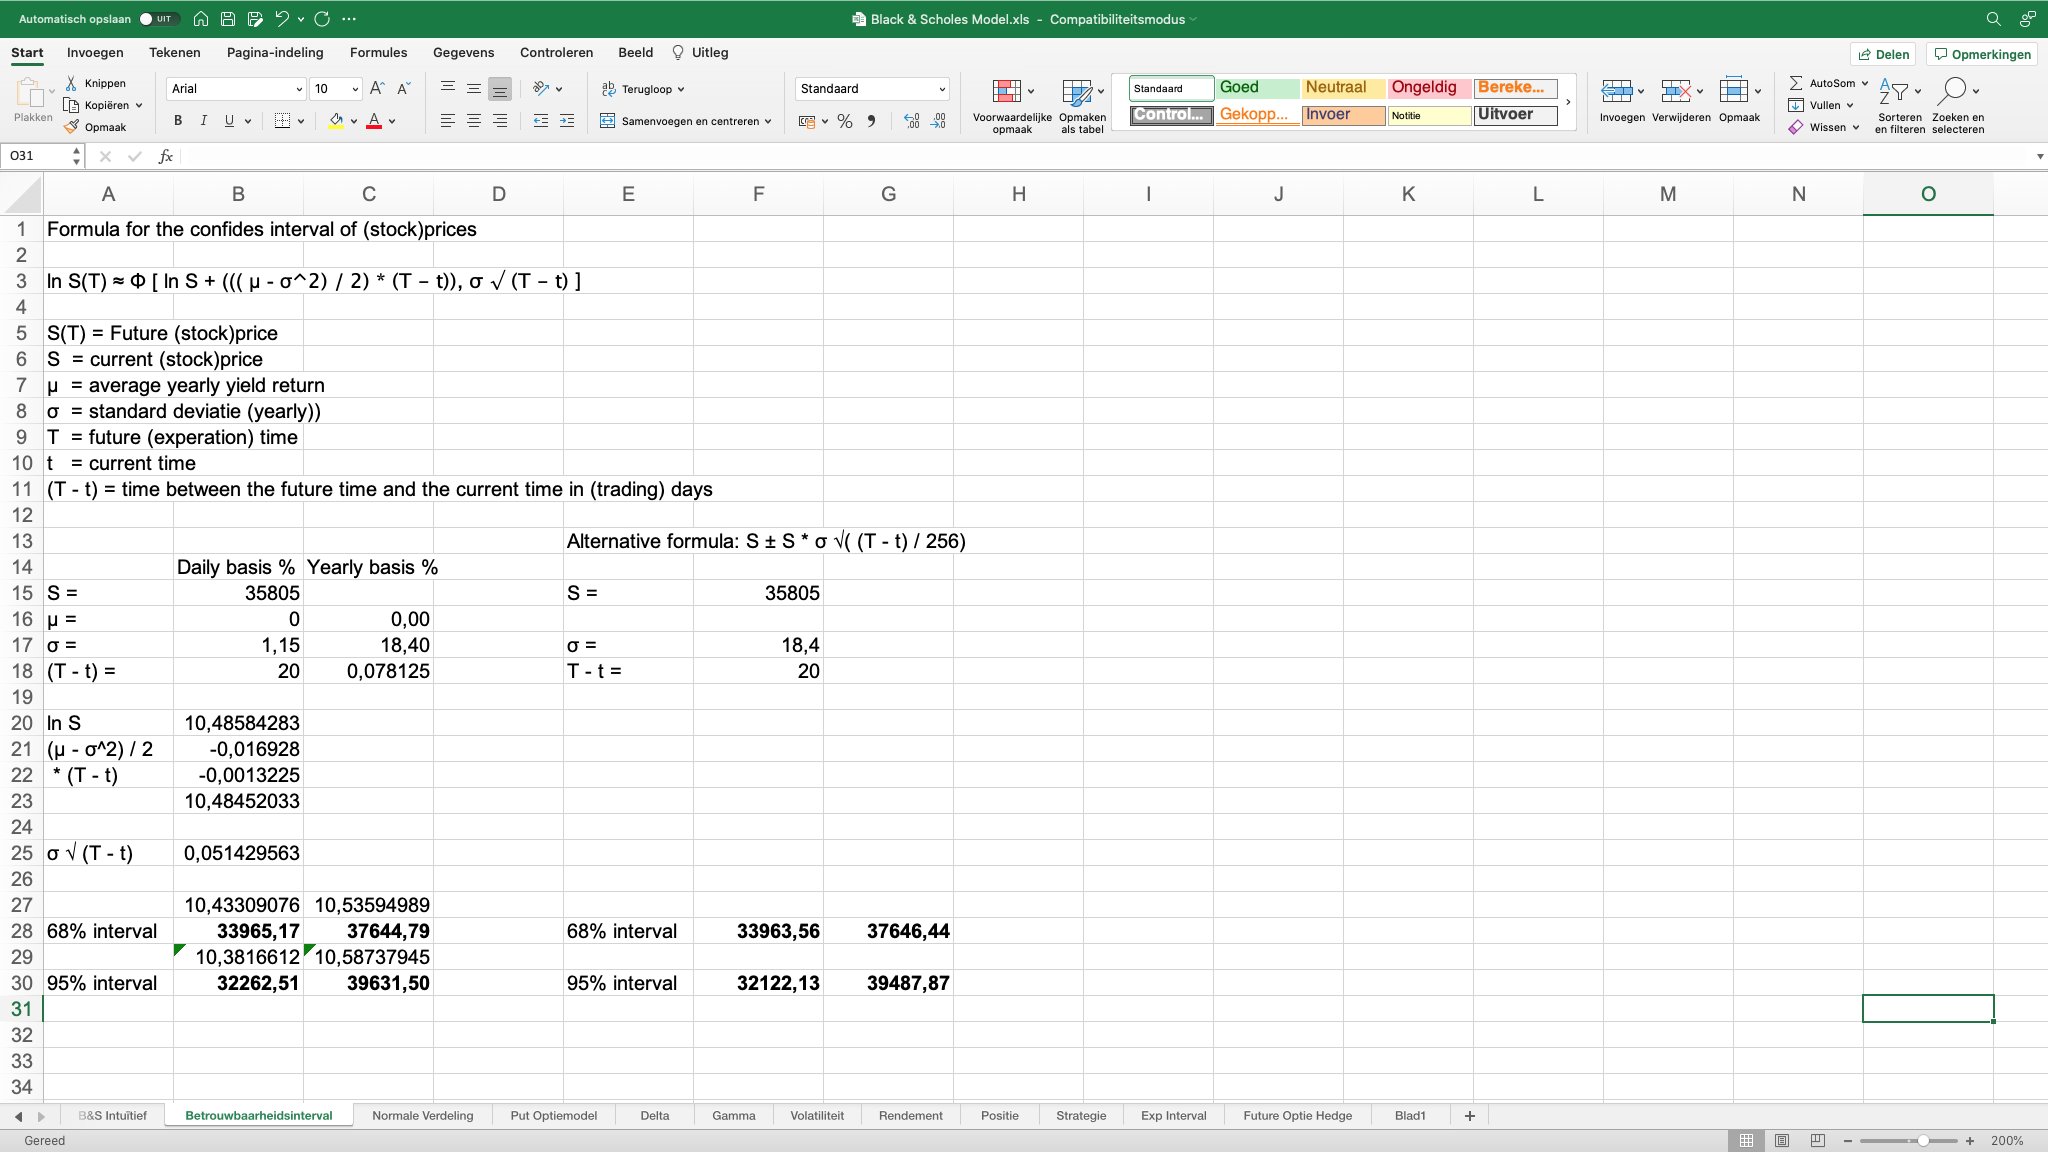
This confirms what I have been reading about and of course there’s no need to expand upon the BS model because the standard deviation formula for calculating the future price is given by:
Price x Volatility x Sq Root (21/365) and multiplying this result by 2 or 3 will give the 2 and 3 standard deviation move amounts and probabilities, (pls see post
#180611 above).
This comment from Quora also gives a little bit more detail about probabilities and option delta values:
“The rule of thumb is that the Delta of an option approximates the likelihood that the option will expire in-the-money. Since 2 Standard Deviations is the upper and lower bounds of where the stock will close 95% of the time, in only 2.5% of the cases will the stock be below 2 SDs — so the Delta should be in the range of .975 for a call, or -.025 for a put.
Standard deviation tells us the range of expected future values based on past price history. By definition, 68% of results (in this case, stock prices as of option expiration) will fall within + or – one standard deviation, meaning 32% are expected to fall outside the (+/-) range — 16% above one standard deviation, and 16% below one standard deviation. (btw, I have never seen any research that validates the actual predictive value of standard deviation: I suspect it’s purely theoretical.)
If you expand the +/- range to two standard deviations, by definition 95% of future events are expected to fall within that range, with 2.5% ending above and 2.5% below the range. Therefore, a call option 2 SDs below strike has a 97.5% chance of expiring in-the-money (ITM) — as of the moment the analysis is done, and holding all other factors equal. (The delta will change as market moves the stock price.) The equivalent put option has a 2.5% likelihood of closing ITM. (Three standard deviations predicts the range that 99.7% of future events should fall within — with a Black Swan being the curve-breaker.)
The Delta of an option tells us its sensitivity to moves in the underlying stock price — literally how much the market price of an option can be expected to increase should the stock price increase by $1. (For this reason, puts always have negative deltas, since an increase in the stock price should NEVER cause a put’s value to increase.)
Option deltas are said to approximate the probability that the option will expire in-the-money. An at-the-money call or put has a delta around .5, which means both that it is likely to increase/decrease by 50 cents given a $1 price move — but also that it has a 50% chance of expiring ITM.
Using this logic, a call two SDs below current ATM strike is deeply ITM, and can be expected to have a delta near 1, given that it has a 97.5% probability of expiring ITM. Actual option price moves are subject to market bid/ask/demand, so the exact move will be more or less than $1.
A put at the same strike, 2 SDs below market is far OTM, with a 2.5% likelihood of payout at exp. The put delta is likely around -.02 — an expected 2 cent bump if the stock drops a dollar, though this is debatable given that there may be no open interest at that price point, and the Bid/Ask may be negligible. ie: There is no market action that can demonstrate the specificity of the equation.
A look at some option chains suggests that very close to expiration, the delta is very close to the 2 SD probability, but as expiration gets further away, a 2 SD ITM call will have a delta more in the range of .80 to .90, and puts -.10 to -.20. So much for “Rules of thumb.”
https://www.quora.com/What-is-the-delta-of-a-2-standard-deviation-below-the-strike-price
Naturally markets don’t follow a normal distribution and under account for tail risk Black Swan events.
Thanks once again for your help.