Bard
BardParticipant
Master
Gladly done, it was a bit of digging into my memory because I have not done anything with options for a while. Long story…
Did you used to trade them, what kind of strategies did you prefer?
Options theory had definitely given me a new insight into volatility, std deviations and price projections. Specifically, POP calculators, Moneyness %’s, Delta, Put-Call Ratios, 25 Delta Reversals and IV Rank (all subjects I’ve posted about on PRC). A good resource is HSBC’s forex options data, here: https://www.home.saxo/en-gb/insights/tools/fx-options-risk-tool/tool-details
Did you ever use something like a Probability Cone? (which Nicolas kindly coded here): #118818
I’d be appreciated if you could post the Excel file only as I’d like to customise it to make it display up to 4 different assets, the 68%, 95%, 99% intervals and the % probabilities and also make it display daily, weekly and monthly %’s. Here’s a screenshot of two Excel calculators I’ve been using that could be a basis for a new customised calculator?
Again, thanks for all your help and input! 🙂
 JS
JSParticipant
Veteran
Hi Bard
Thanks for the info.
About the spreadsheet, I do want to send it, but personal information is forbidden on the platform!
I traded options for a while and mostly spreads.
If you are good at determining the direction of the market, you can choose Spreads. For example, if you expect the market to rise to a certain level, you can set up a Long Call ATM + Short Call OTM strategy.
If you would only buy a Long Call ATM, you can compare it to buying a train ticket “Rotterdam – Paris” while you probably get off in Antwerp.
You use the Short Call OTM to limit your investment (risk).
Of course, you can also use the same strategy when you expect the market to fall,
Long Put ATM + Short Put OTM.
I also used volatility strategies like Straddles/Strangles/Butterflies.
The appendix gives the “right strategy” at certain market conditions.
The Probability Cone is the “graphical version” of the formula S ± S * σ √( (T – t) / 256)
(where I use 256 trading days instead of the 365 per year)
You can therefore use this formula well when you want to determine to what extent the price can rise or fall within a future period (as discussed before).
Hope you can do something with this 🙂
Cheers
JS
JSParticipant
Veteran
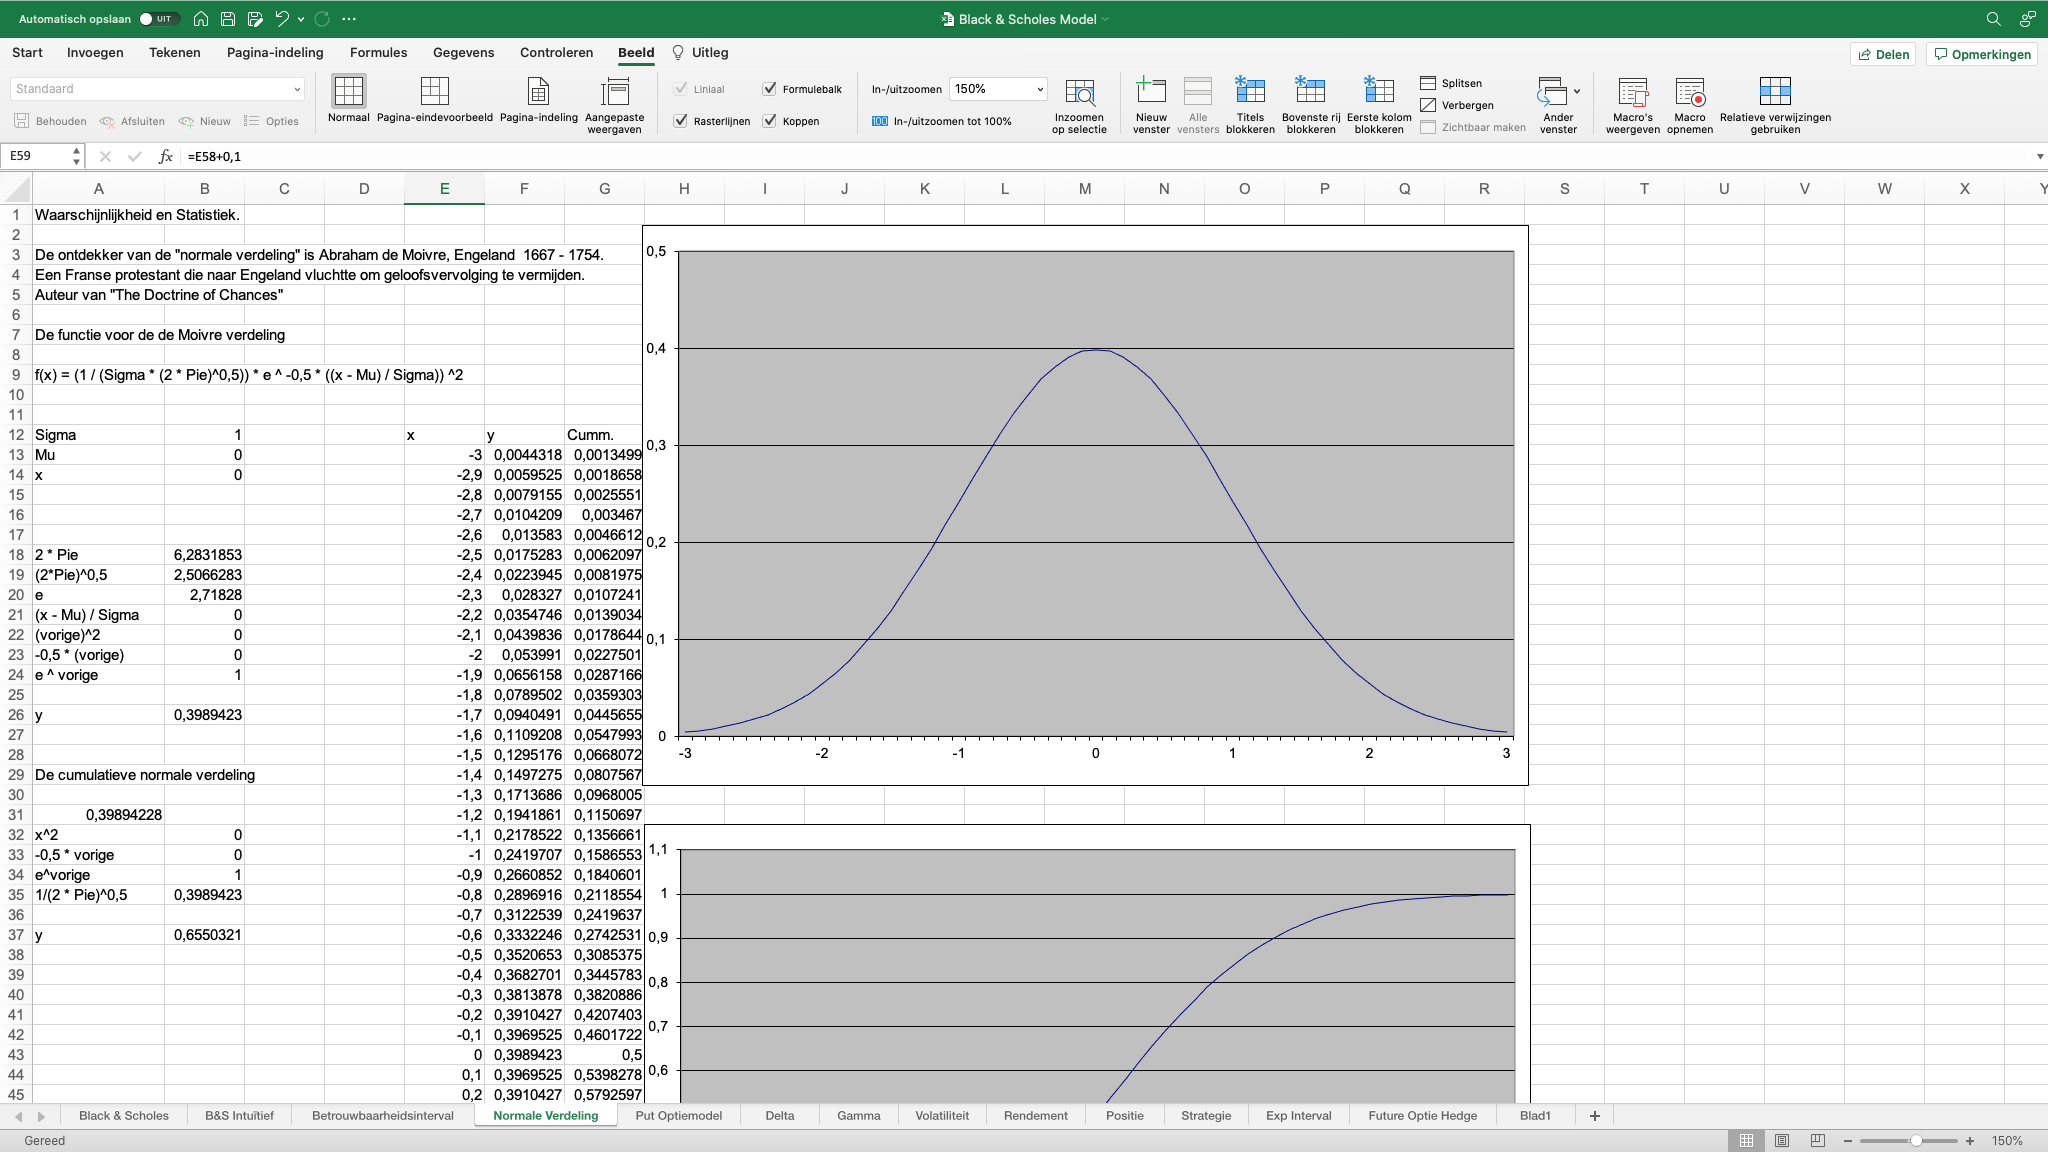
Perhaps also interesting for you is the formula of the Moivre distribution (normal distribution).
The normal distribution is the basis of the Black & Scholes model.
Only random (stochastic) processes have a normal distribution.
BardParticipant
Master
Hi @JS
Thanks very much again for the extra options information!
Which strategies did you figure out had the best risk/reward (r/r)? I think Strangles offer a good r/r if you want to not have naked positions. OptionStrat do a good mobile app with graphs showing this.
It would be appreciated if you could post the Excel file
Did you know that you can attach the file here below without having to share personal info, but if you don’t wish to that’s cool?
Cheers,
Bard
JSParticipant
Veteran
Hi @Bard,
I have done a “study” on the risk /reward of various strategies and it came out that strategies that use OTM options have the best risk / reward, so for example the strangles and straddles strategies, with the caveat that the OTM options should not be too far “out of the money” because otherwise the transaction costs will play too big a role.
About the Excel file, I don’t want to send it in the suggested way because there is too much personal information in it.
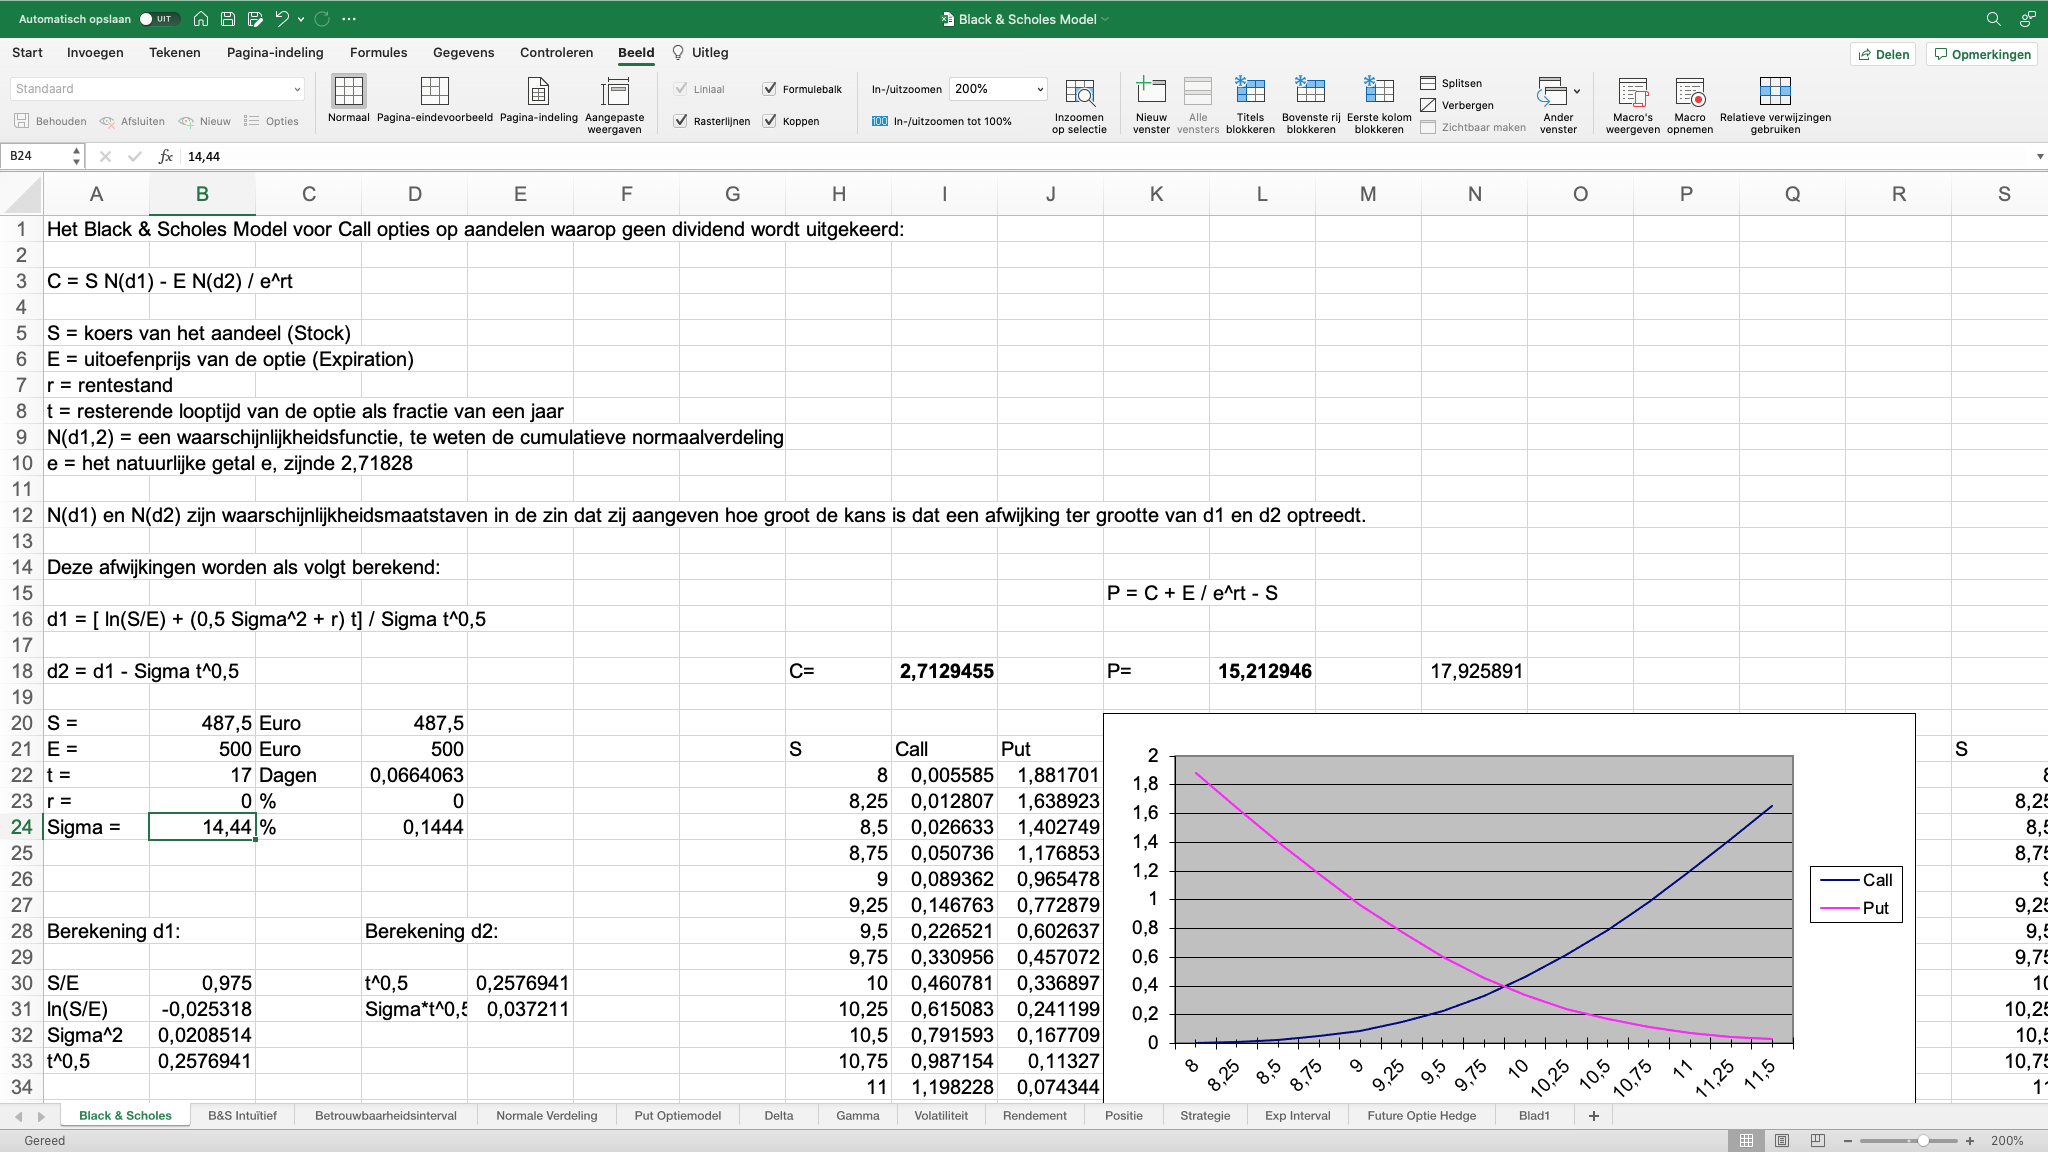
I did add the sheet with the Black & Scholes formula as an attachment.
Regards JS
BardParticipant
Master
Hi @JS, thanks, I saw similar online feedback about Strangles and Straddles, I prefer the former as I use the Vix Fix and Implied volatility indicators that Vonasi kindly coded and which give great tops and bottoms market signals, (I’ll initiate the two legs in stages at hopefully top (short Call) and bottom (short Put) turning points).
I understand about the personal data, I just had a thought however as I was writing this, is is possible that Sheet 2 in your screen shot: #180647
is free of personal data, as a copy and paste into a blank Excel might work? Again, no worries or reply necessary if it’s not possible!
Again, thank you for all your valuable input here. 🙂
Best,
Bard
JSParticipant
Veteran
Hi @Bard,
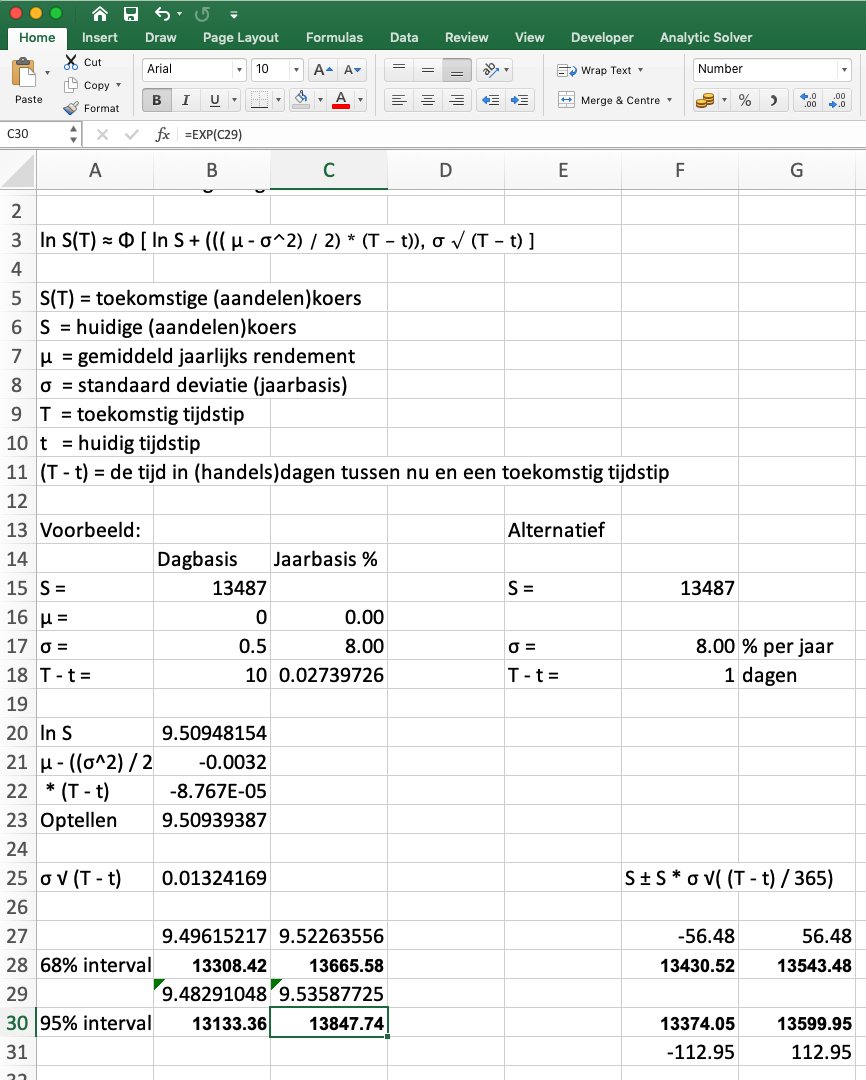
Hereby the requested Excel sheet with the formula for the behavior of stock quotes (sounds good 🙂 ).
Right, there are a lot of useful indicators on PRT.
I’m currently only working with DSP, maybe you’ve read something about it on the forum, for me it’s a whole new and great way to deal with signals.
Hope for you that the option strategies work out well, good luck.
Regards JS
JSParticipant
Veteran
If you are looking for more information about the background of “a model for the behavior of stock prices” then the keywords are:
Wiener process and Ito’s lemma
BardParticipant
Master
Hi @JS,
Thanks so much for posting the Excel file, that’s really helpful. Just a quick thing, I renamed it and Google translated it to English, but after a short time when I change the SD number on a daily basis all functionality stops and the 68/95 limits on the left (not the alt version) stop updating when you change that daily SD values? Have you ever experienced this or a script that stops working for no reason?
DSP: Yes I read “Rocket Science for Traders” by John Ehlers and Nicolas has very generously spent a lot of time converting them for me, if you search for John Ehler’s indicators within this site you’ll find many that have been converted for PRT use.
Thank you for this valuable tool and thanks for the Wiener Process suggestion, something for the weekend!
Best,
Bard
JSParticipant
Veteran
Hi @Bard,
Gladly done, annoying that the file is stuck, maybe something happens with the translation? Don’t worry I’ll send it again.
Sounds good that book, didn’t know that there was such a kind of book on the market, I will definitely read and I will certainly look at those indicators too, thanks.
Best,
JS
BardParticipant
Master
Hi @JS, Thanks for reattaching the file.
Re: Dagbasis and Jaarbasis (B17 & B18) “freezing,” I think the “trick” is to calculate the daily σ, (SD) first in Excel and just let it naturally populate the yearly field. 🙂
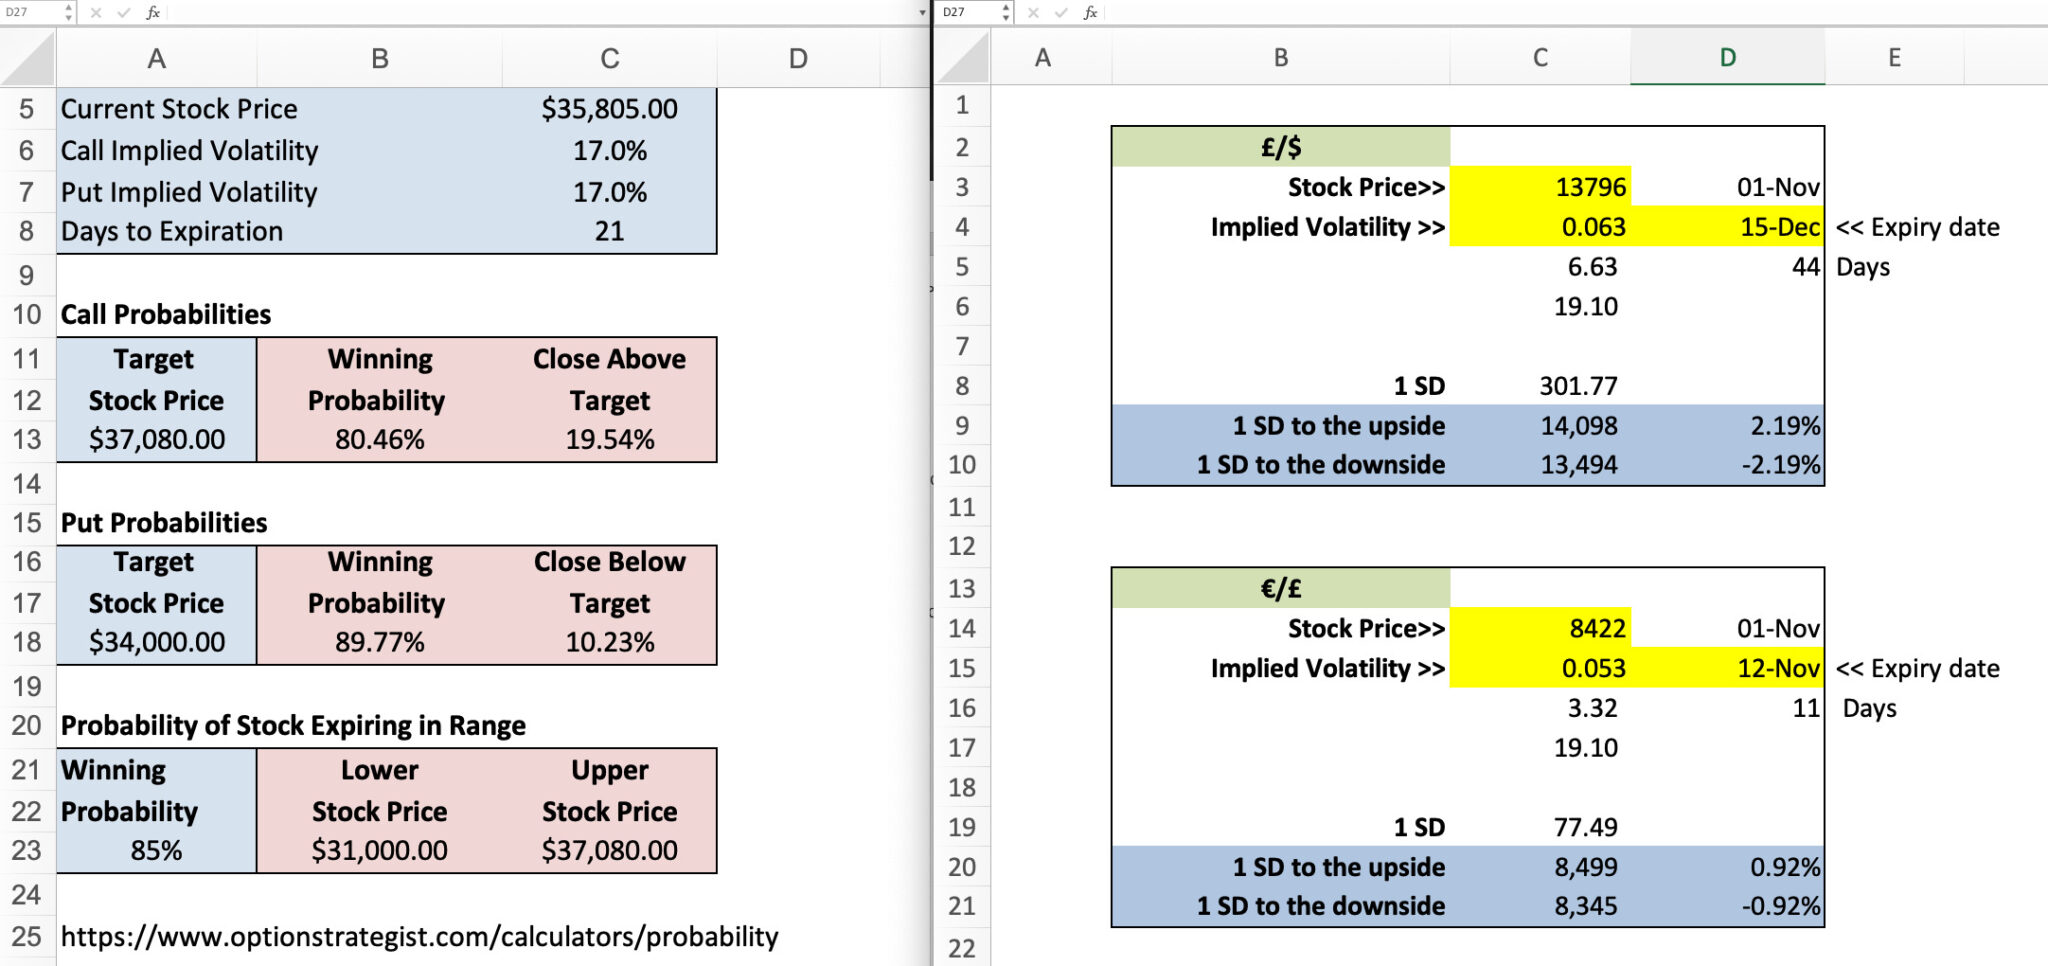
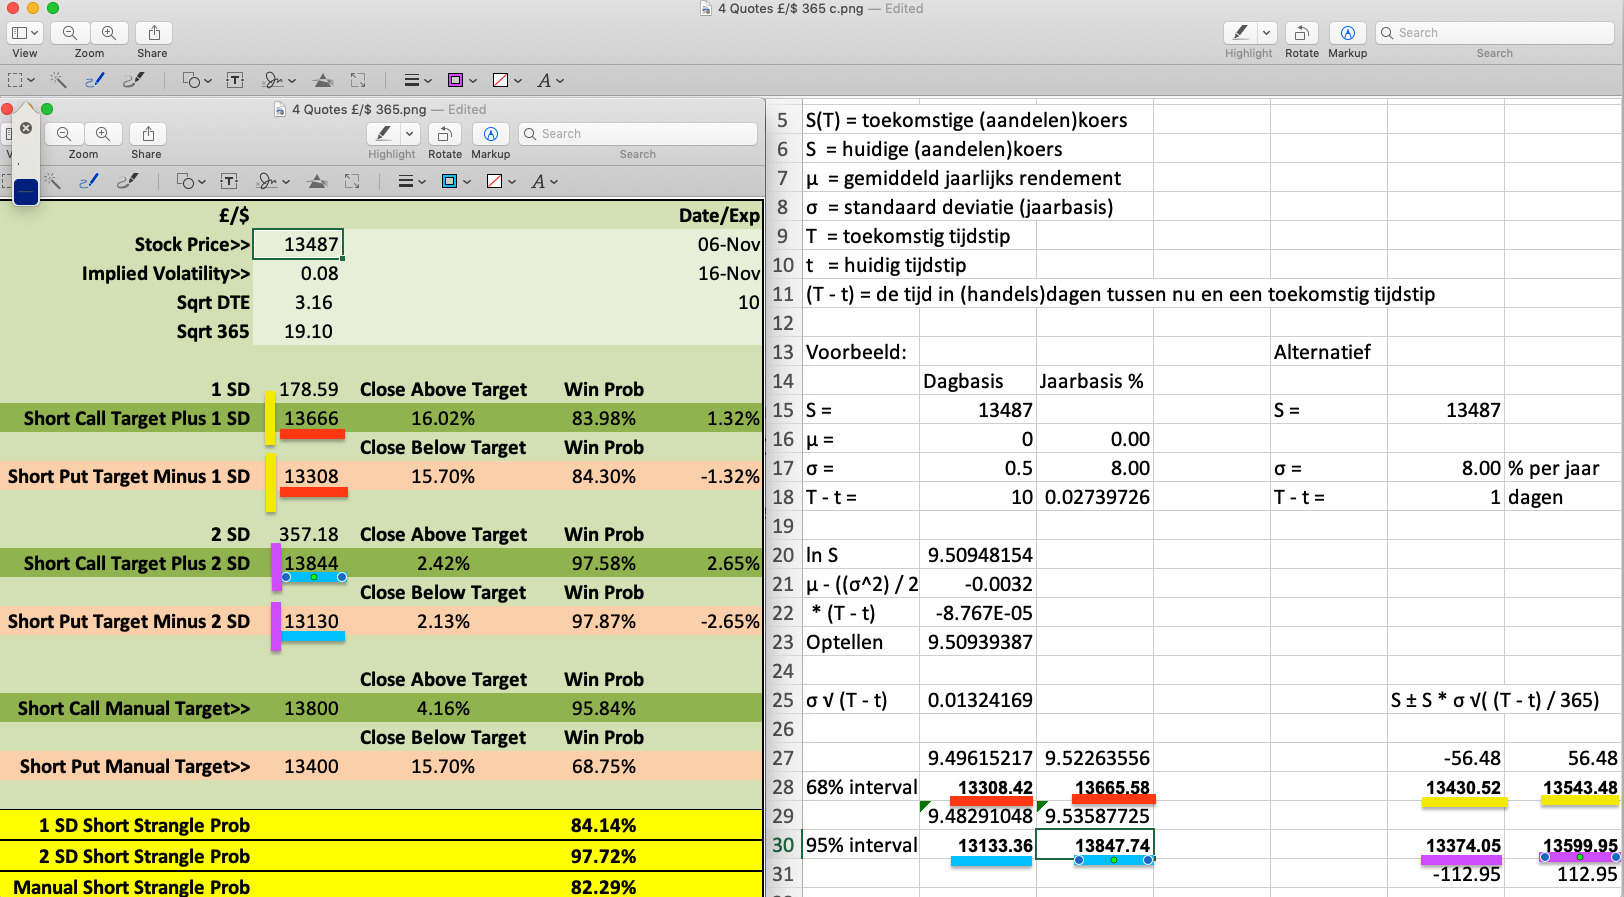
I was going to input your formulas in to a probability calculator I posted earlier but notice there is a lot of difference between your 1SD and 2SD values and those I am getting if I use the conventional calculation (Price x Volatility x SQRT 10/365 (I changed yours from 252 to 365)) in my own sheet it gives different 1SD and 2SD values (by 200 ticks) to those values in your right hand bottom side formula in your sheet? Pls see screenshot of your file with £/$ values below.
I have attached my “4 Quote” probability calculator here in the hope that you or someone else may see the error in my file?:
Its the top left cell £/$ that I have matched DTE (10 days), and volatility (8%) for.
Cheers,
Best
Ian
JSParticipant
Veteran
Hi @Bard,
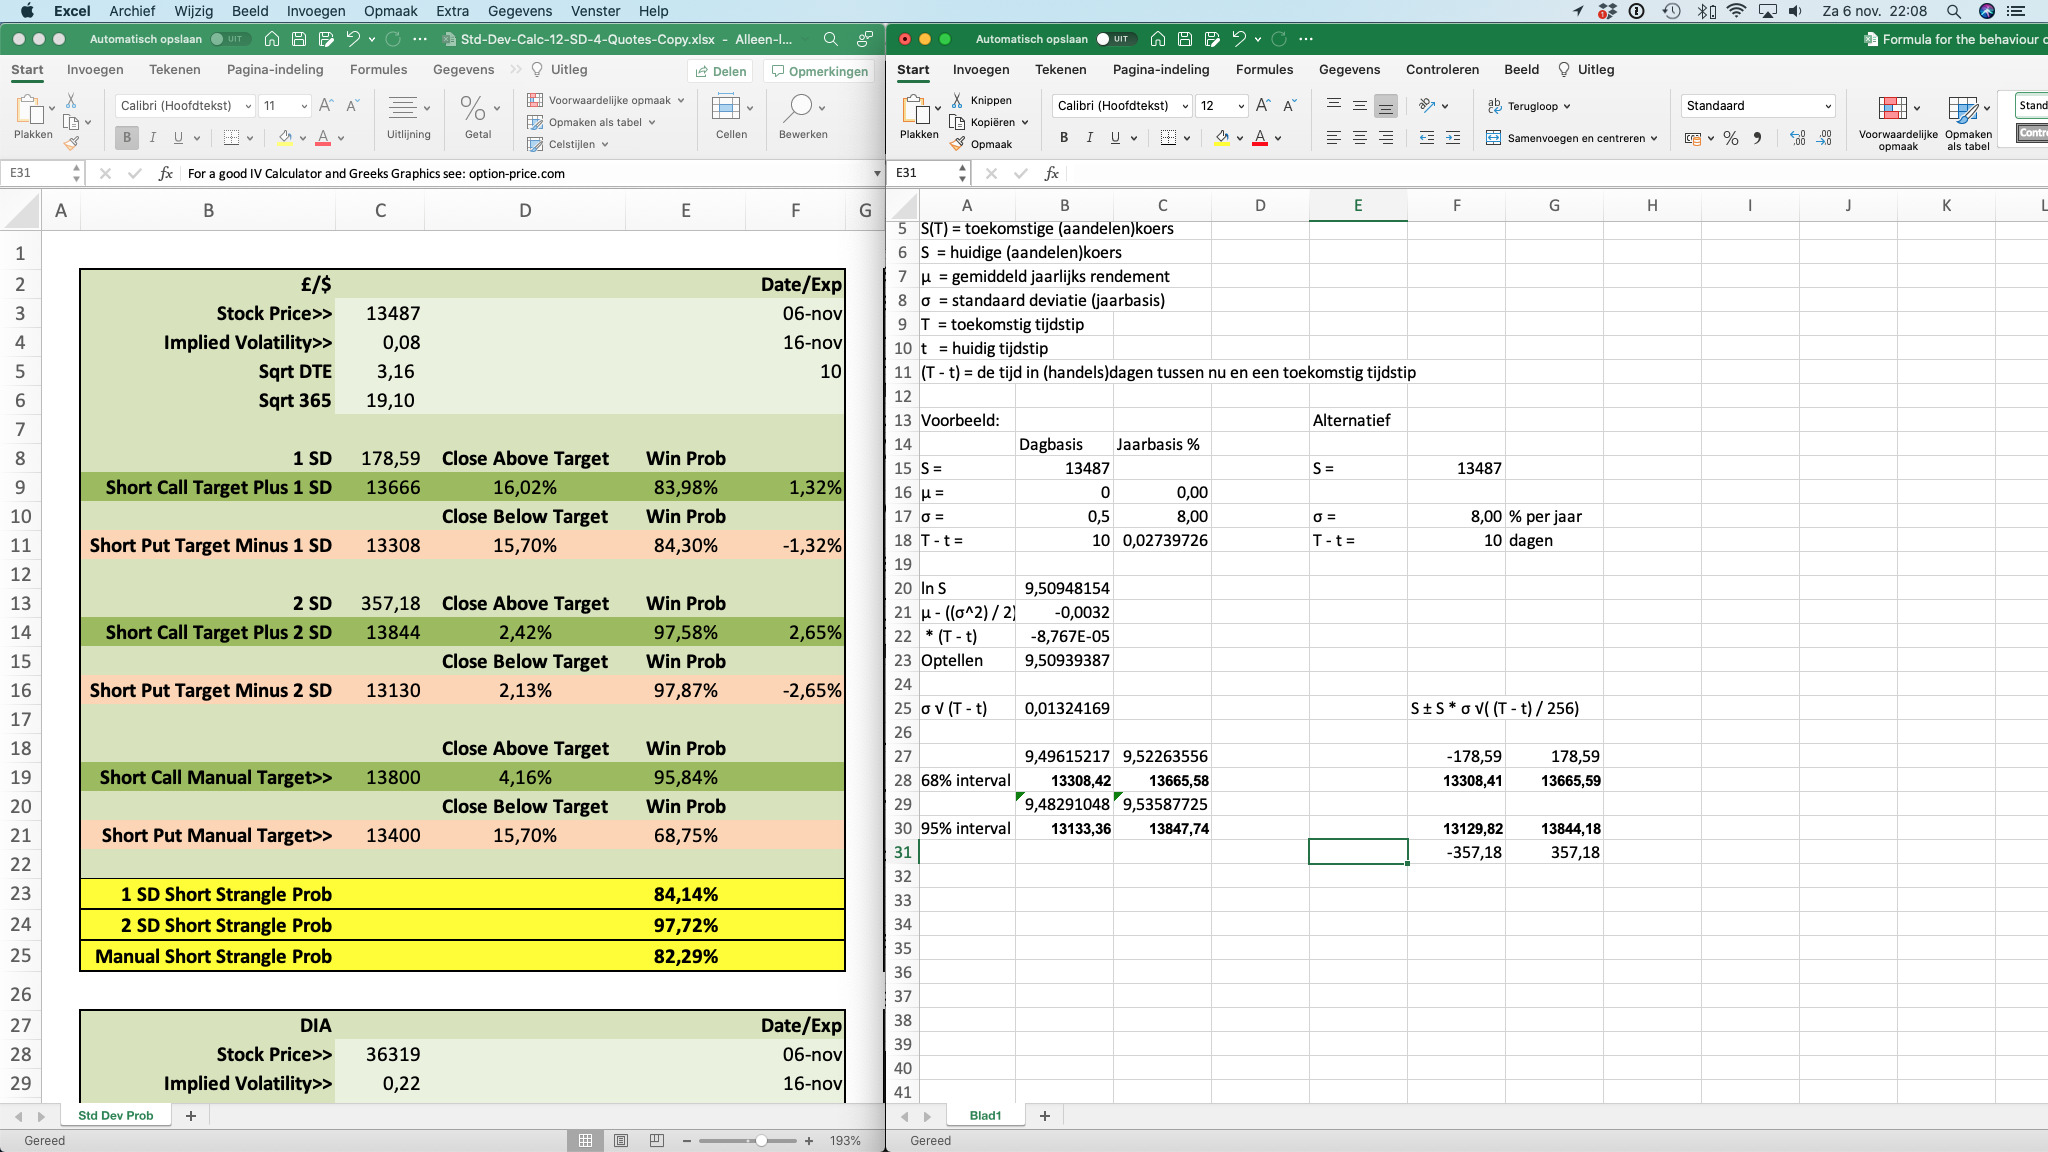
The Excel sheet was only for my own use and that is why I never translated it and never clearly indicated which fields are input fields and which are calculation fields.
In the example you give, B17 is an input field and B18 is a calculation field.
It is therefore true that you must enter B17 and that B18 (annual standard deviation%) is calculated automatically.
There is no error in your Excel sheet, I get exactly the same values when I also use 365 days. The difference in our calculation is that I use 256 trading days per year in my sheet and you use 365 trading days per year in your sheet.
Nice sheet by the way, thanks for sharing.
Regards JS
BardParticipant
Master
Hi @JS,
B17: That’s what I finally figured!
Re: Both your file and mine using the traditional volatility formula but getting different results:
I already converted yours to 365 and then took a screenshot which I posted above. I don’t seem to be able to get your 1 and 2 SD’s to reconcile anywhere near my values for that traditional volatility formula?
This is the screenshot (attached) of my £/$ 1 and 2 SD values. Your main formula matches my standard volatility formula, (red and blue underlined values), but the same traditional formula in your right hand bottom part of the file doesn’t match my values even closely (yellow and purple lines) and yet it’s the same formula, that’s what I was referring to and why I thought there must be a mistake in my sheet?
I was wondering what your feeling is on using 252 versus 365 days? I think it makes a small difference but I thought if we’re talking about option strikes and value then because BS model uses 365 days and this is used as the risk free rate period, shouldn’t 365 be used instead of 252?
252 day would make sense when talking about an underlying market but these calculations represent options values using a model that uses 365 days?
No worries, glad you like it!
Best
Bard
JSParticipant
Veteran
Hi @Bard,
You forgot to adjust the number of days, 1 day must be 10 days.
When I use 365 days then I get the exact same numbers, see screenshot.
You use the number of trading days in the formula with the standard deviation, so you actually calculate the deviation that the price can have when this standard deviation remains for a number of days. When the stock market is closed during the weekends and holidays, there is no volatility, no movement. In my opinion, the calculation of volatility is only valid using trading days (256 days).
The calculation with the interest is a different calculation and these calculations are based on an annual (risk-free) interest rate (365 days).
Regards Jaap
BardParticipant
Master
Ahh, that explains it @JS, cheers.
Right, thanks for the explanation I have converted it back to 252 and reattached the probability calculator here below. I get about a 30 to 40 tick difference using 252 days in the calculation on the 1 SD £/$.
I noticed Yahoo have stopped historic data downloads for the Dow Jones and other assets. I was wondering how or where, one can obtain the daily Dag Basis SD figure?
Best,
Bard