JS
JSParticipant
Veteran
Hi @Bard,
There is still a small difference in our calculation 🙂
I use 256 trading days compared to the 252 trading days you use.
The number of average trading days per year in the Netherlands is calculated with:
52 weeks x 5 days – 4 public holidays = 256
The difference may be because the number of public holidays in England is higher than in the Netherlands?
Actually, I currently only use the data from IG (PRT) but a good site (in the Netherlands) is: https://www.iex.nl/Koersen/Indices/Volatiliteit.aspx
Regards JS
 Bard
BardParticipant
Master
The difference may be because the number of public holidays in England is higher than in the Netherlands?
They’re working you too hard! We get 8, but then we English have always felt “entitled!” 😀
Did you mean you get a daily IG’s % Change in the watchlist and use that for Dag Basis?
Cheers,
Bard
JSParticipant
Veteran
Yes, working class not the entitled one… 🙂
For my systems I use the (price) information of IG within PRT.
Furthermore, I do not use any other price information.
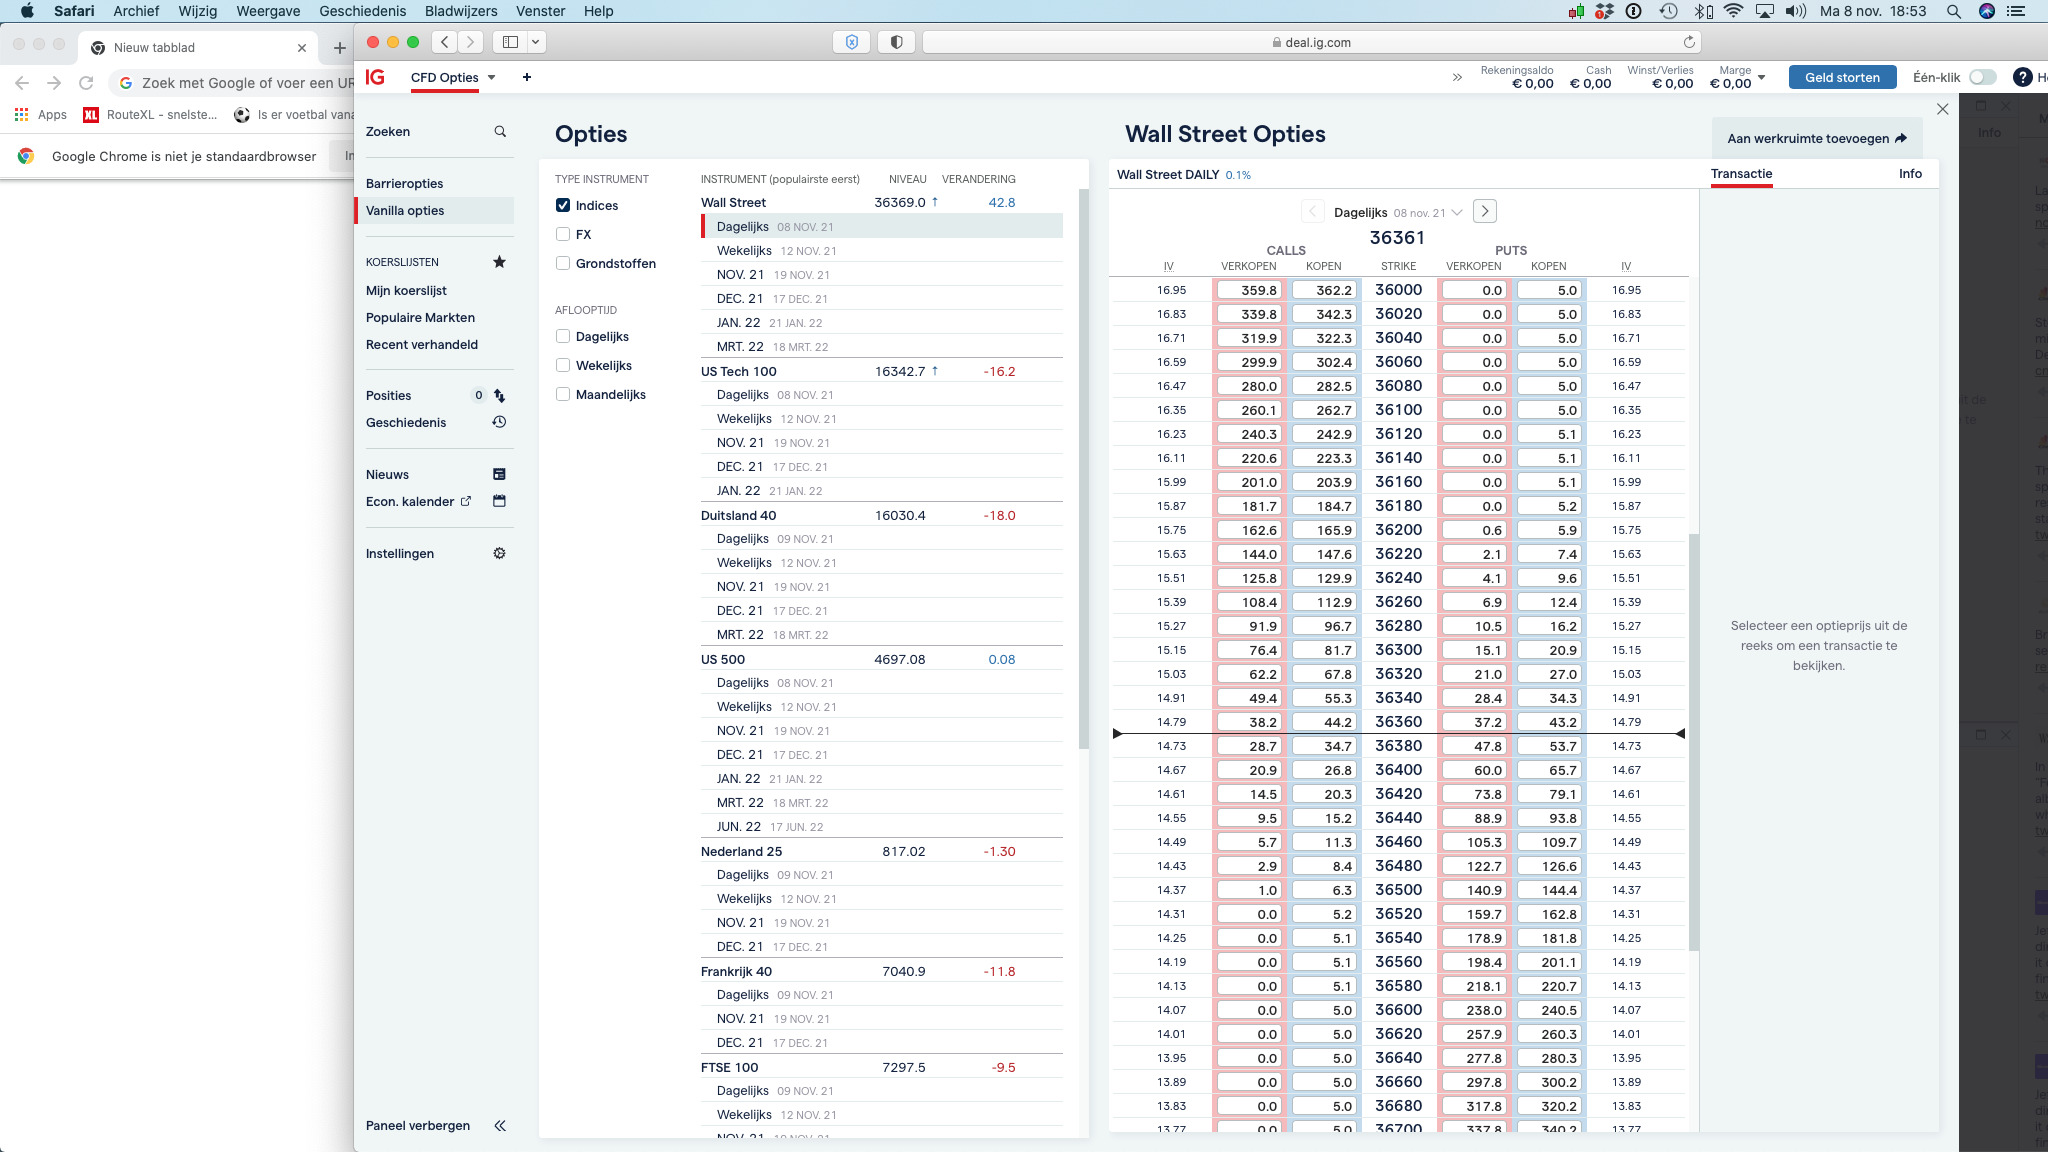
I do know that if you have a “Barriers – Option” account with IG that you can then follow the price information of options on the site … (screenshot)
BardParticipant
Master
For my systems I use the (price) information of IG within PRT. Furthermore, I do not use any other price information.
I must be having a slow day here! 😀 I was wondering where exactly do you source the daily standard deviation (Dag Basis), do you calculate a daily percent change using a PRT indicator? I use a Log change percent in my Excel but now there is no more historical data downloading from Yahoo, it’s out of date.
Cheers,
Bard
JSParticipant
Veteran
Hi @Bard,
Currently I have several automatic systems running in PRT, these are trend following systems on different indexes with CFD contracts.
So, I’m not trading options now.
For my systems I also use the standard deviation, but it is indeed calculated with the built-in PRT indicator (Std[n](Close)).
If I understand correctly, you yourself calculated the daily standard deviation in Excel based on the downloaded quotes from Yahoo, which now no longer works because Yahoo has stopped delivery.
Why not do these calculations in PRT?
Regards Jaap
BardParticipant
Master
Why not do these calculations in PRT?
Hi @JS, Yes good point, I think I already have an indicator for that. Excel can be a bit of a chore at times…
Thanks,
Best,
Bard
BardParticipant
Master
Note Re: Excel Probability Calculator:
Please use the one attached below as I noticed the bottom calculators in the original attachment above have two small calculation mistakes in Row D46 and J46 (the C values in the formula were out by 10).
JSParticipant
Veteran
Hi @Bard,
Thanks for sharing, very useful…
Cheers JS
BardParticipant
Master
Still found an error in Cell K46 which should have this in it: =1-NORMSDIST(LN(C46/C28)/(I29*SQRT(F30/365)))
Updated V3 Excel Sheet here:
BardParticipant
Master
Another small error as F30 should be L30 for Cell K46 in the post above: =1-NORMSDIST(LN(C46/C28)/(I29*SQRT(L30/365)))
Fourth times the charm… or something:
Final Probability Calculator V4:
Enjoy!
BardParticipant
Master
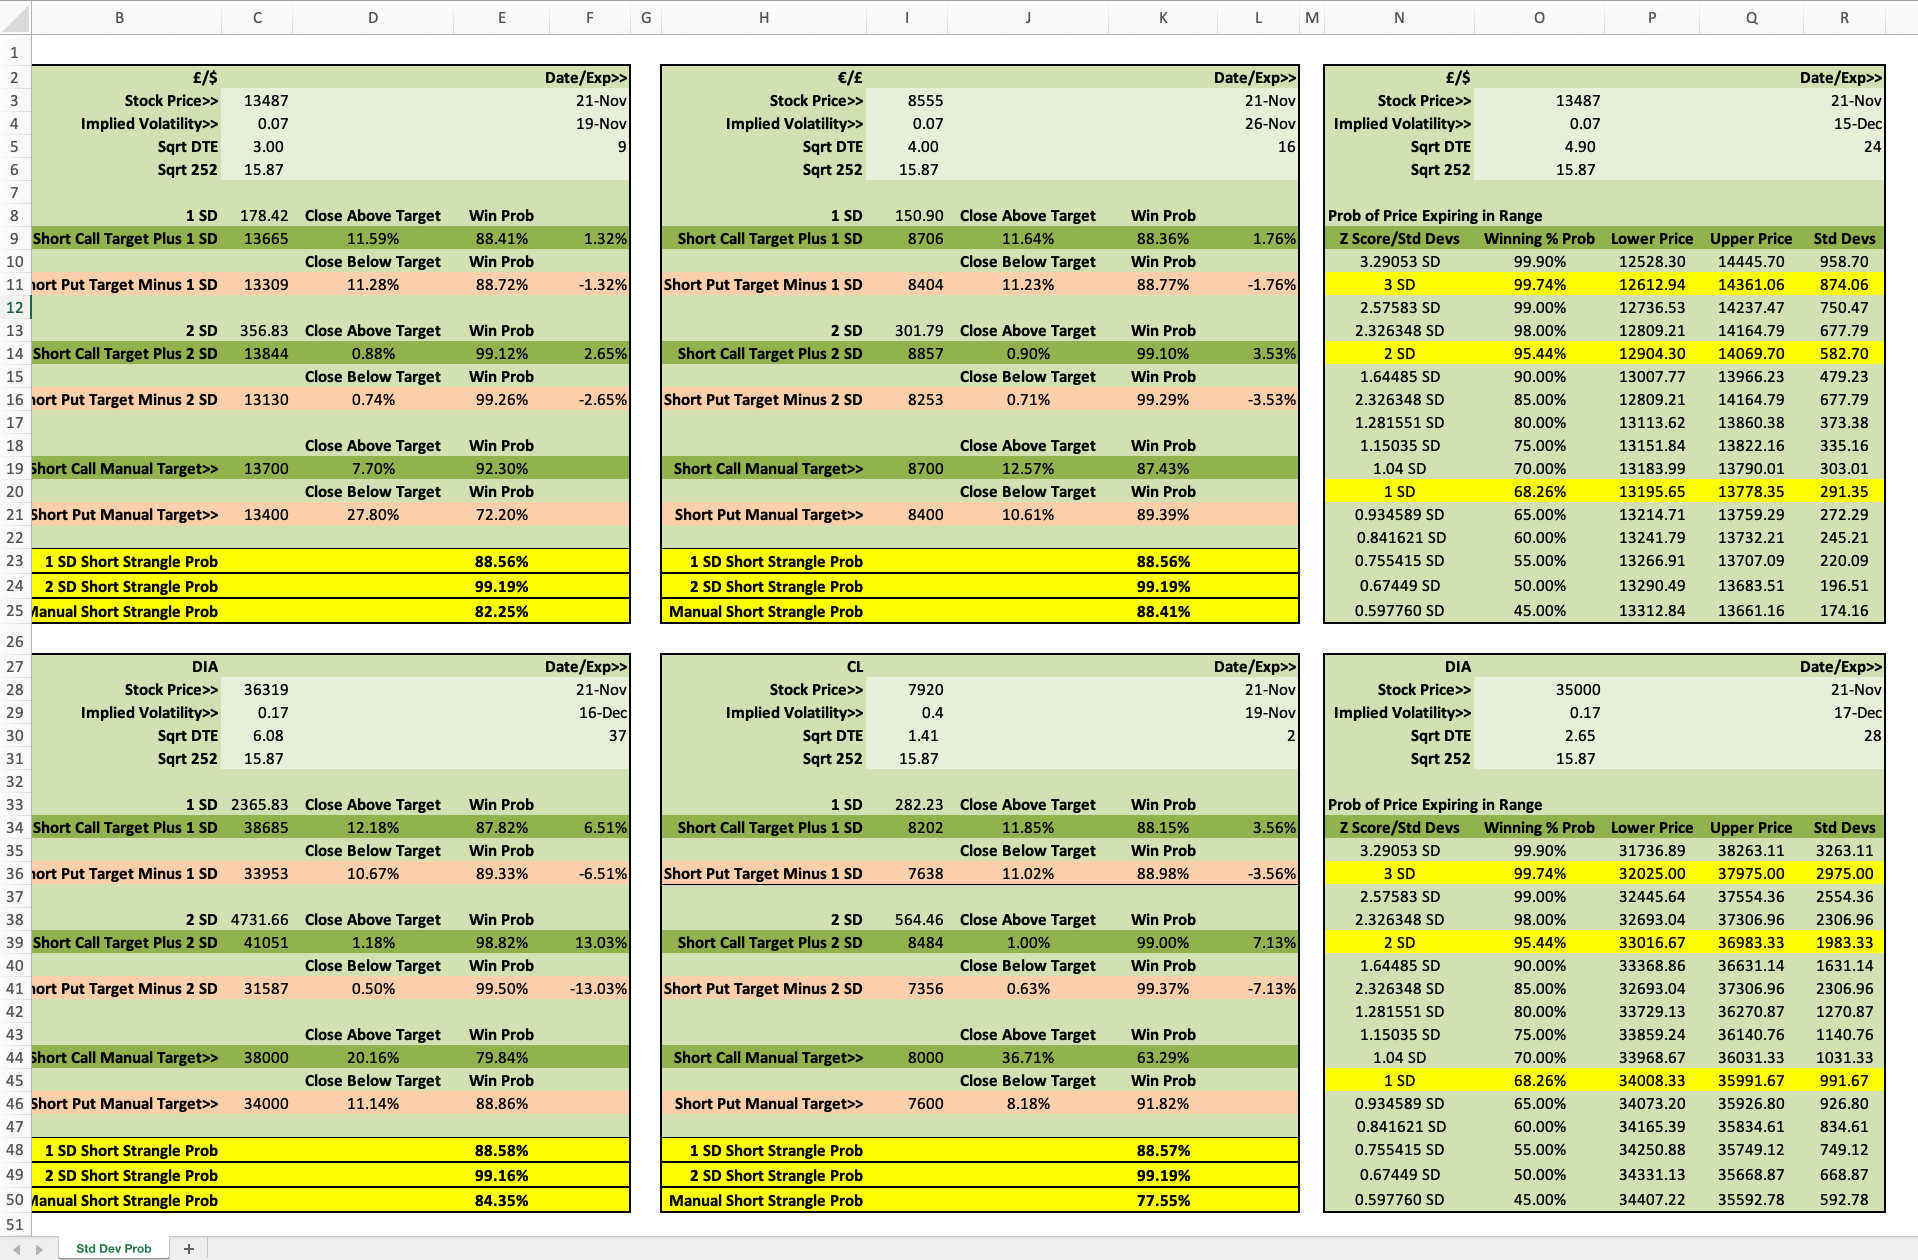
I’ve now added two extra Tables on the right of the 4 quote probability calculators so you can choose your win percentage probability first. I’ve tabled the percentages from 45% win, (in 5% increments) up to a 99.9% win in a column (using Z Scores) and now you can see the lower and upper price ranges attached for each probability — pls see image.
Please let me know if you come across any errors either in the methodology or the formulas.
Excel 4 Quote & 2 Price Range Table Calculator attached below.
Cheers,
Bard
BardParticipant
Master
For some reason the second (lower) percentage table (bottom right of the Excel file) hasn’t copied/retained the formulas from the table above like it normally does so I’ve manually re-applied all the correct formulas to make the lower table update itself:
Ps/ If anyone knows why the formulas didn’t copy over to the lower table liked they normally always do, please let me know, thanks.
BardParticipant
Master
FINAL VERION (I hope… 😀)
I’ve improved the “4 Quote Master Probability Stock Price Calculator” with expanded % ranges and a better layout and colour scheme and I’ve double checked all formula cells:
Hi,
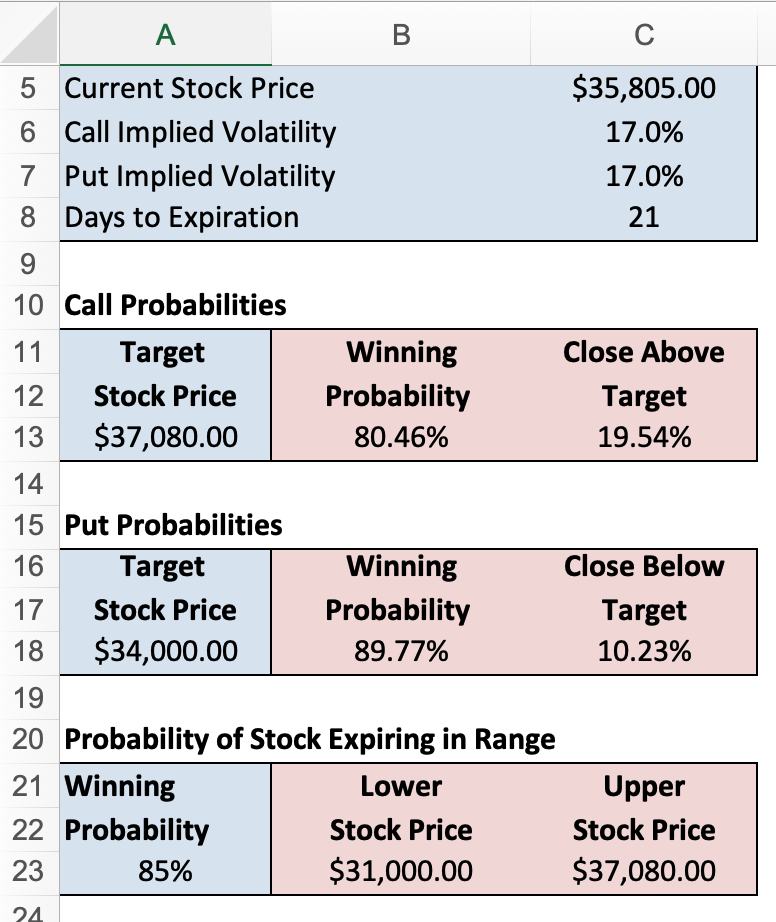
which math did you use to come up with 80.46 and 89.77?
The probability that the price will remain below $ 37,080 is 80.46% The probability that the price will stay above $ 34,000 is 89.77%
JSParticipant
Veteran
Hi
Numbers from the calculation tool…