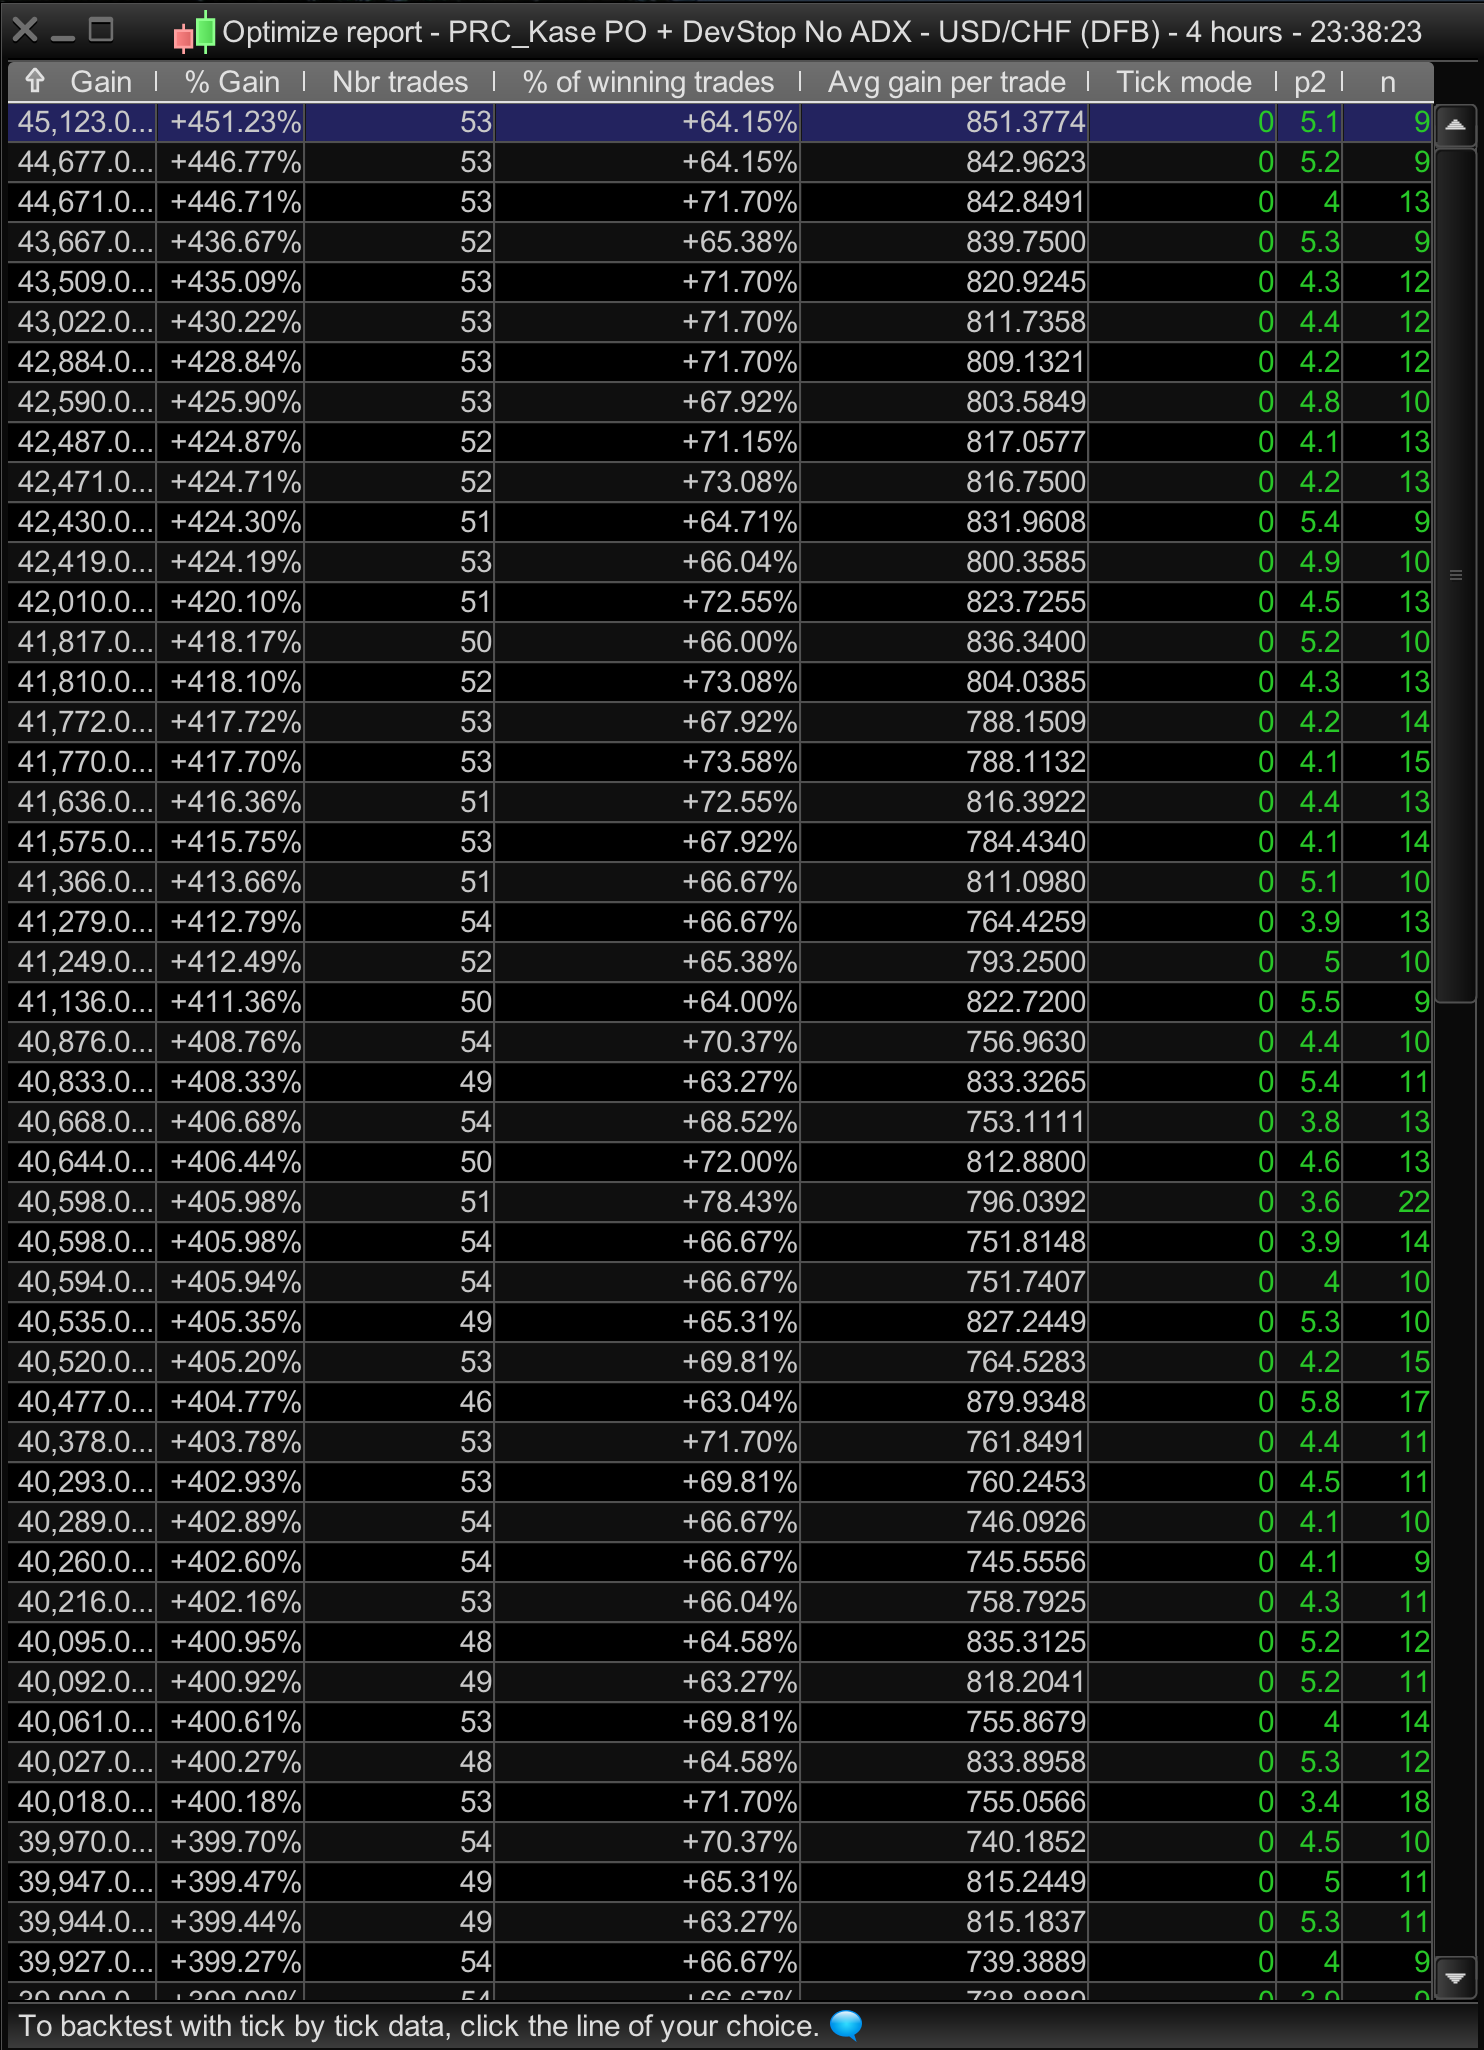
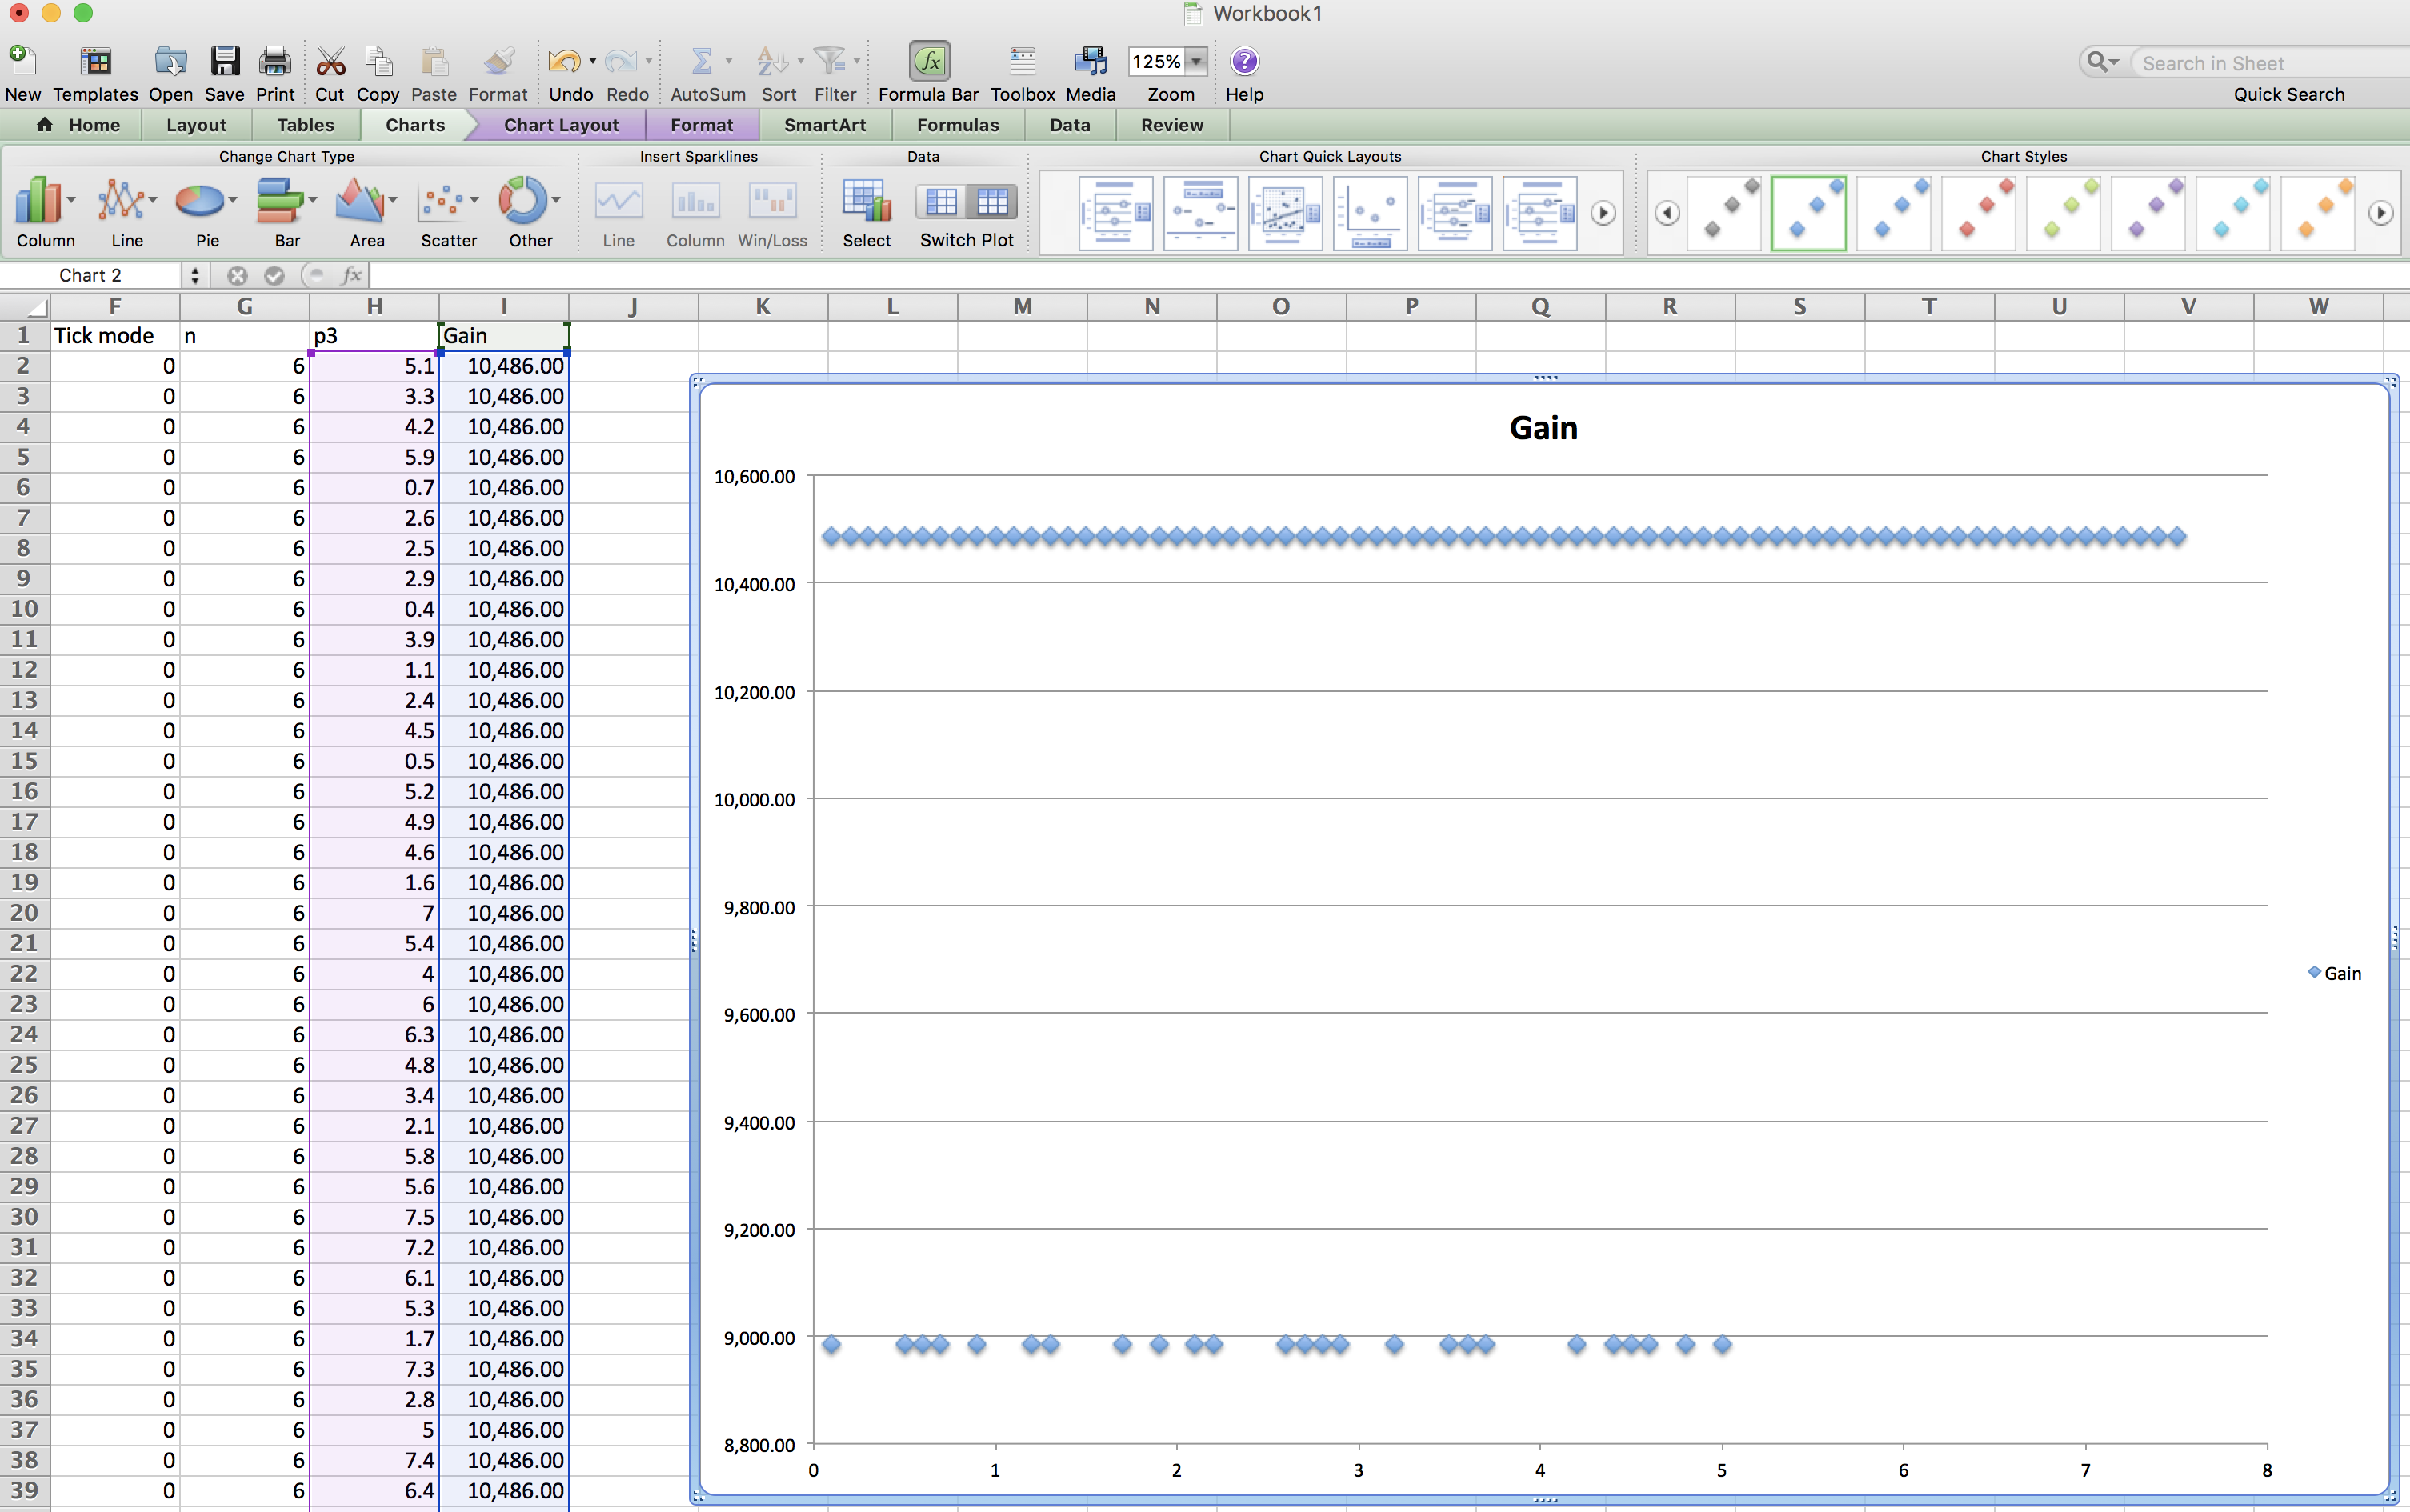
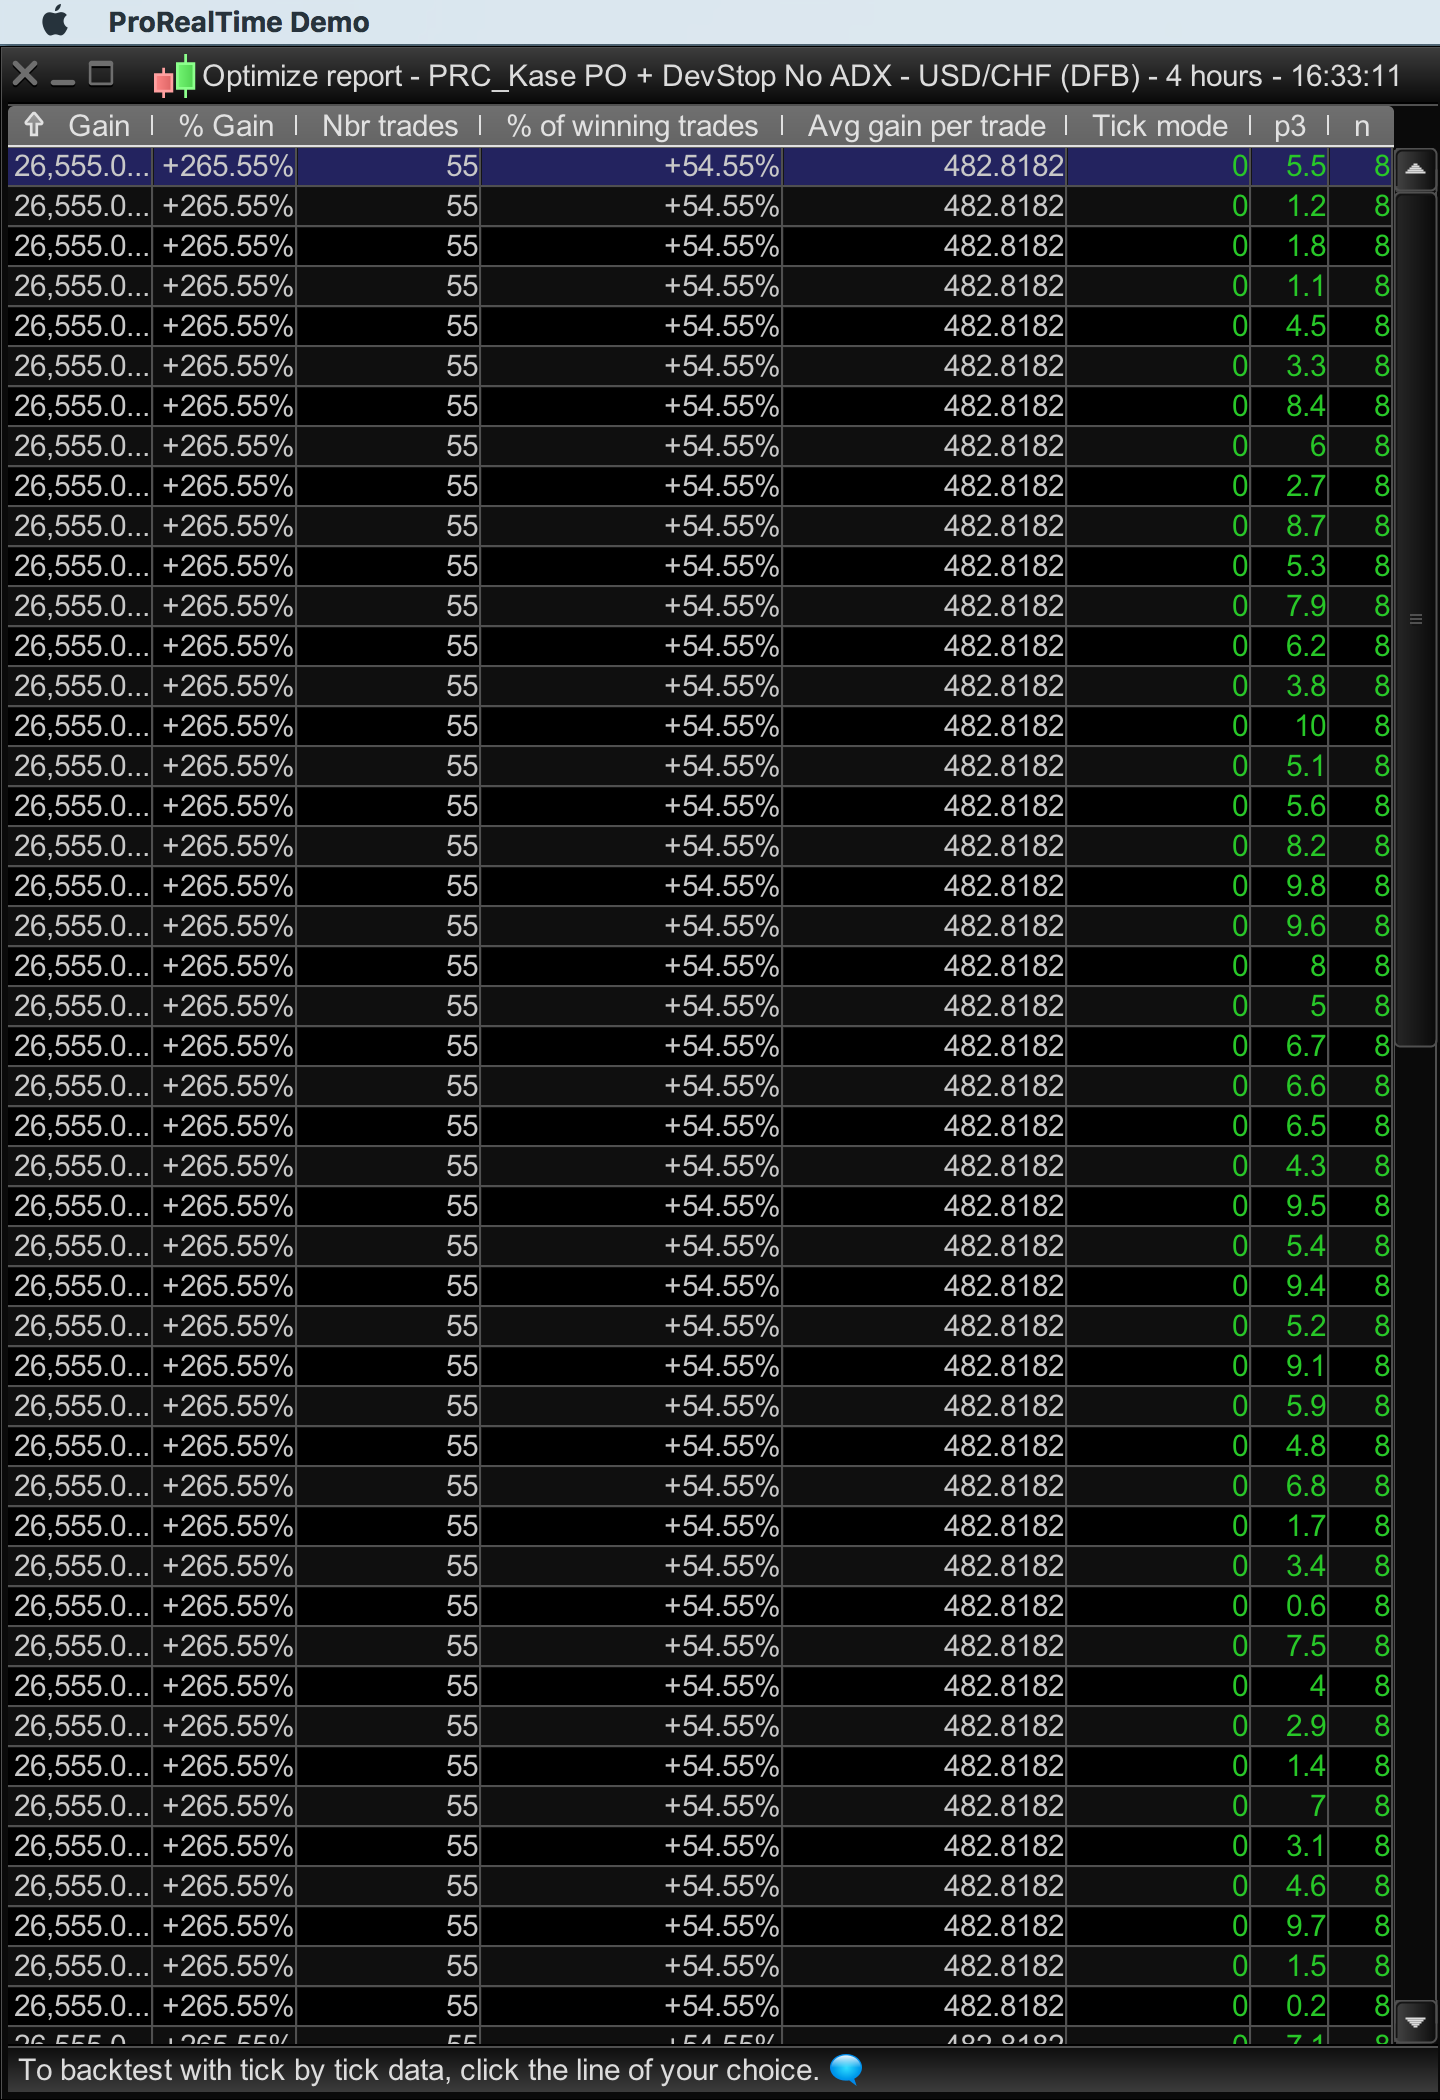
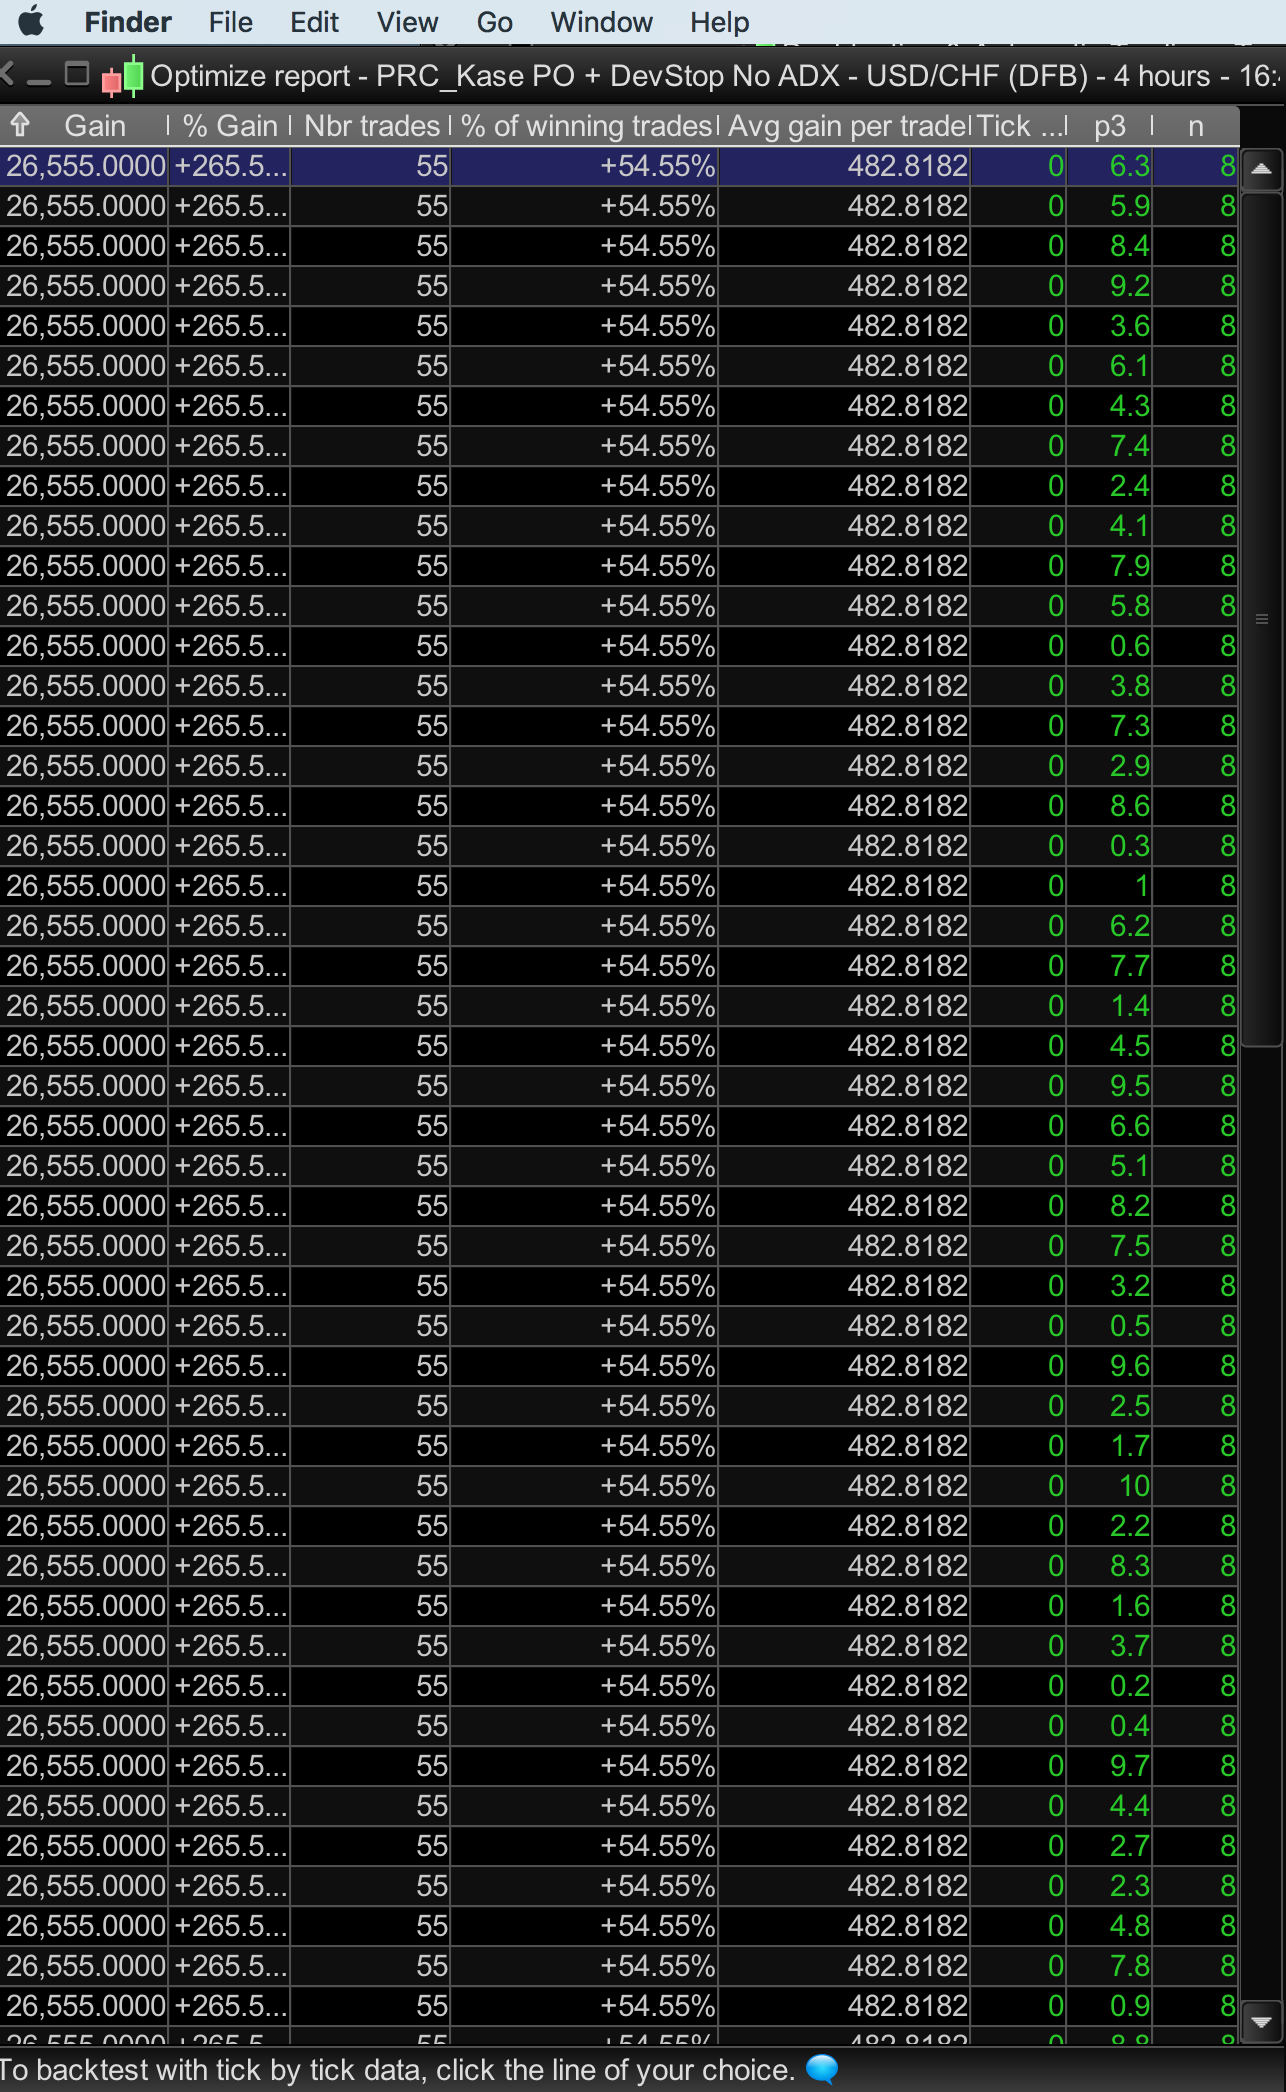
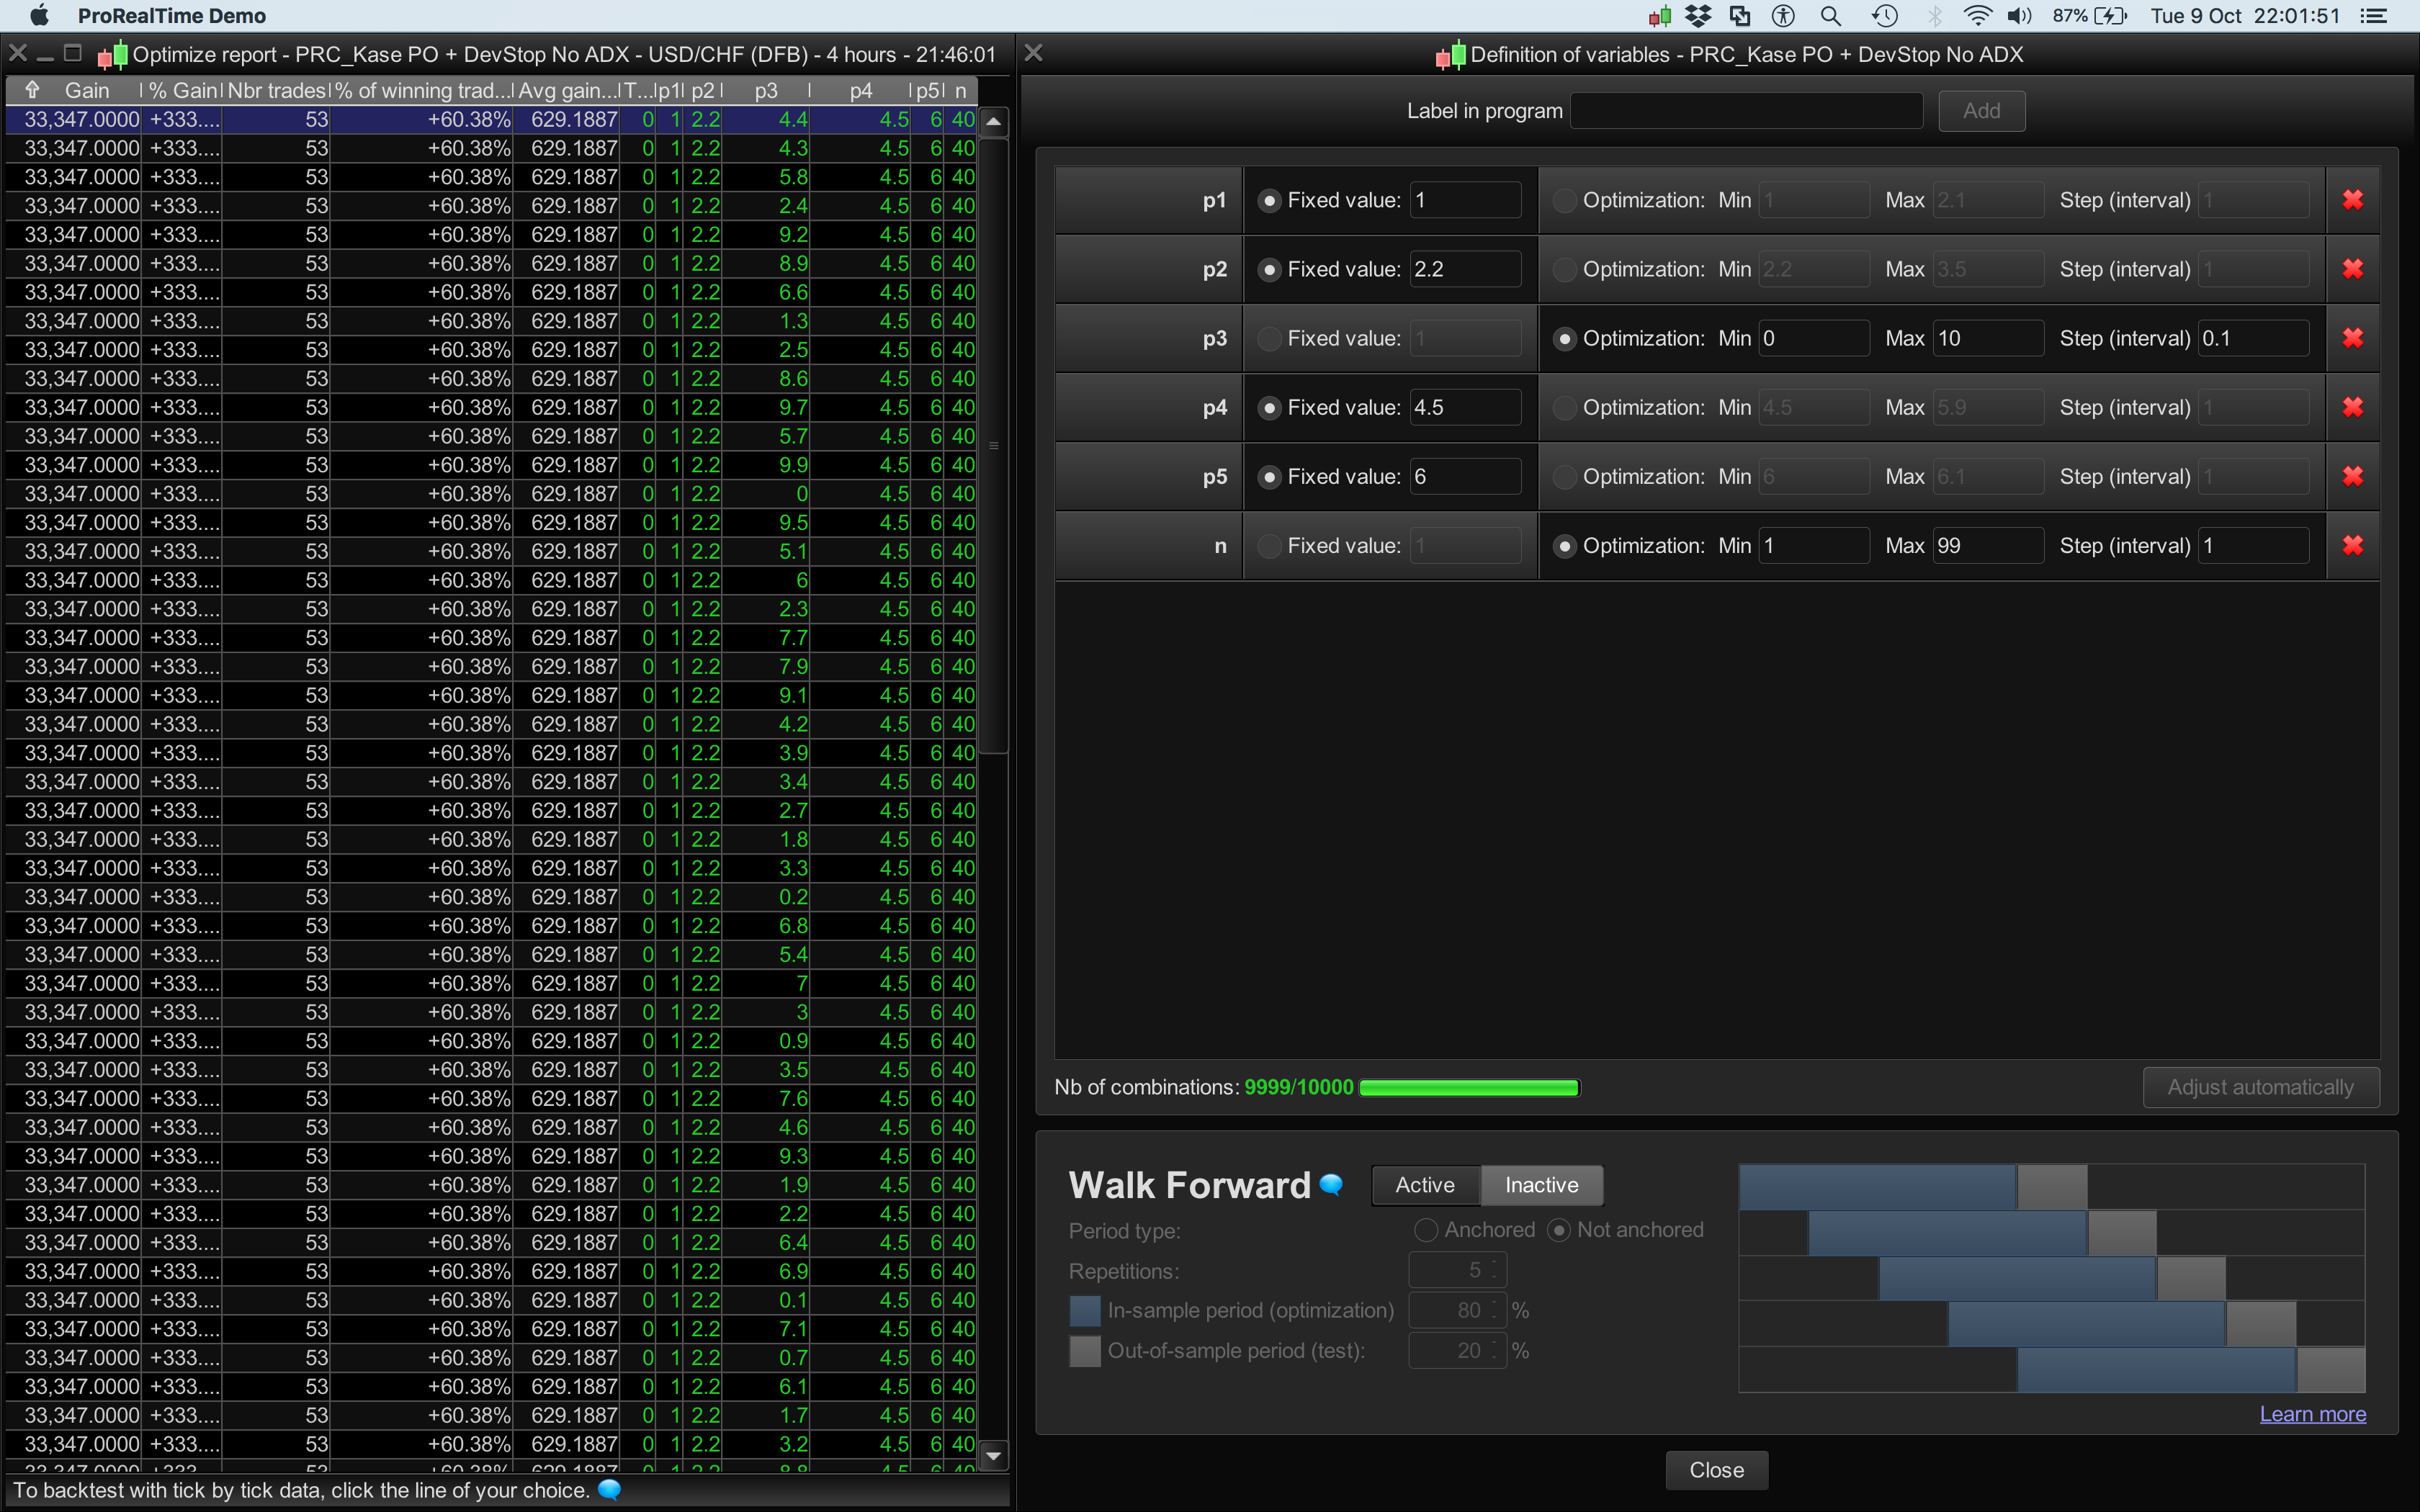
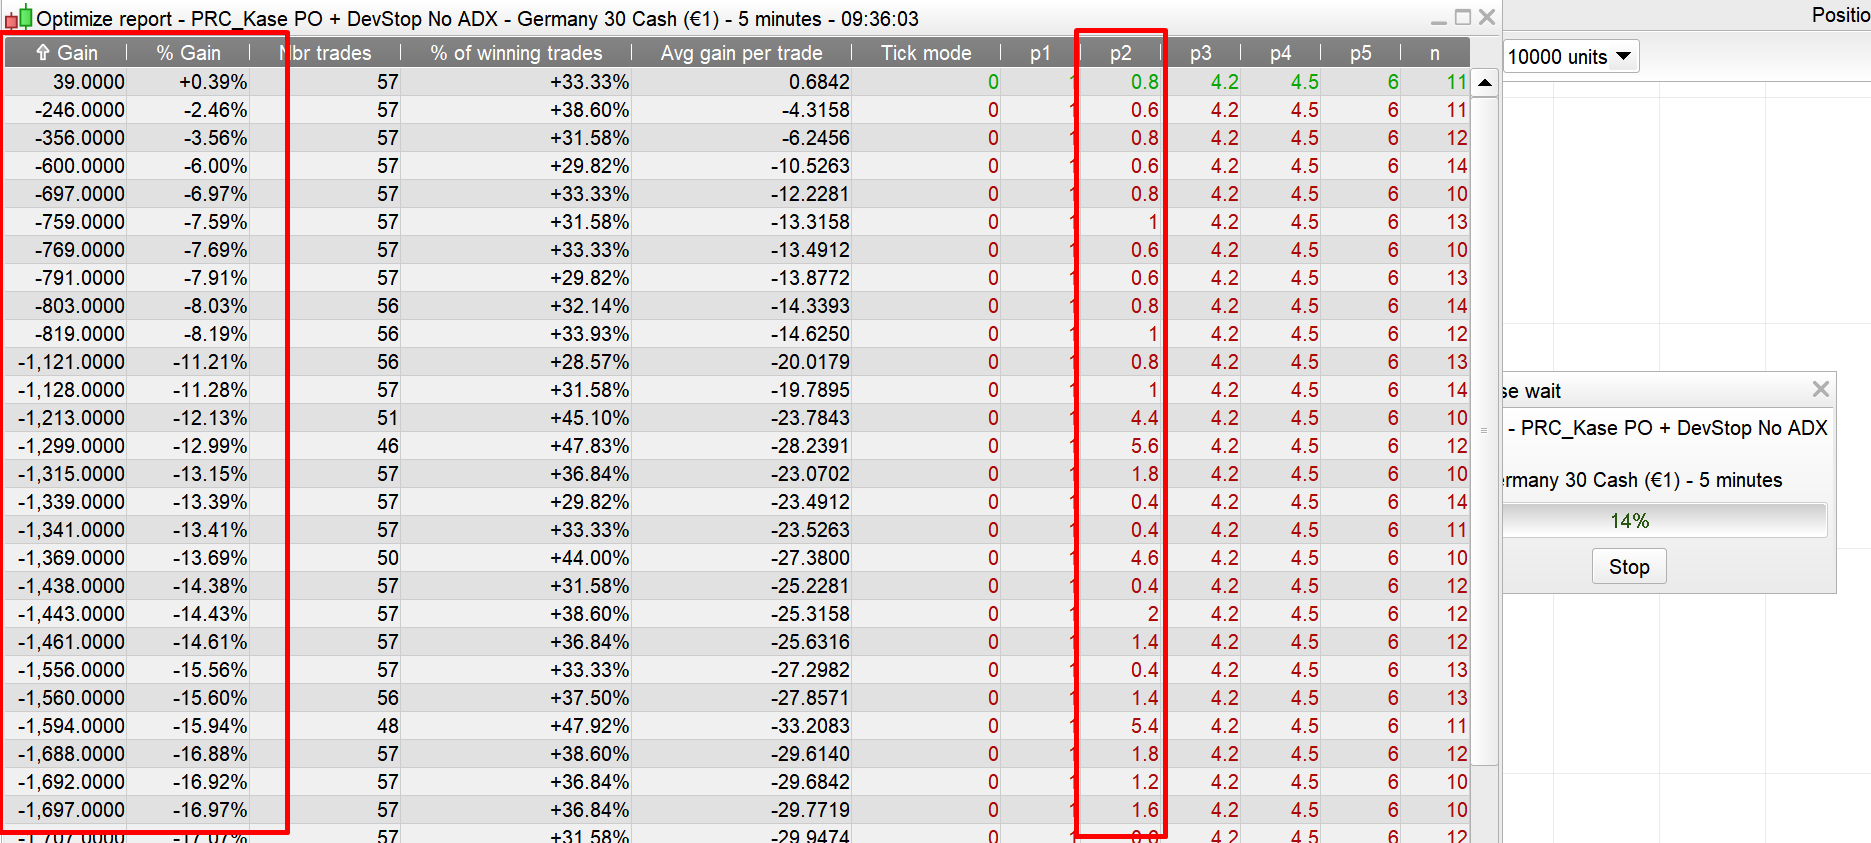
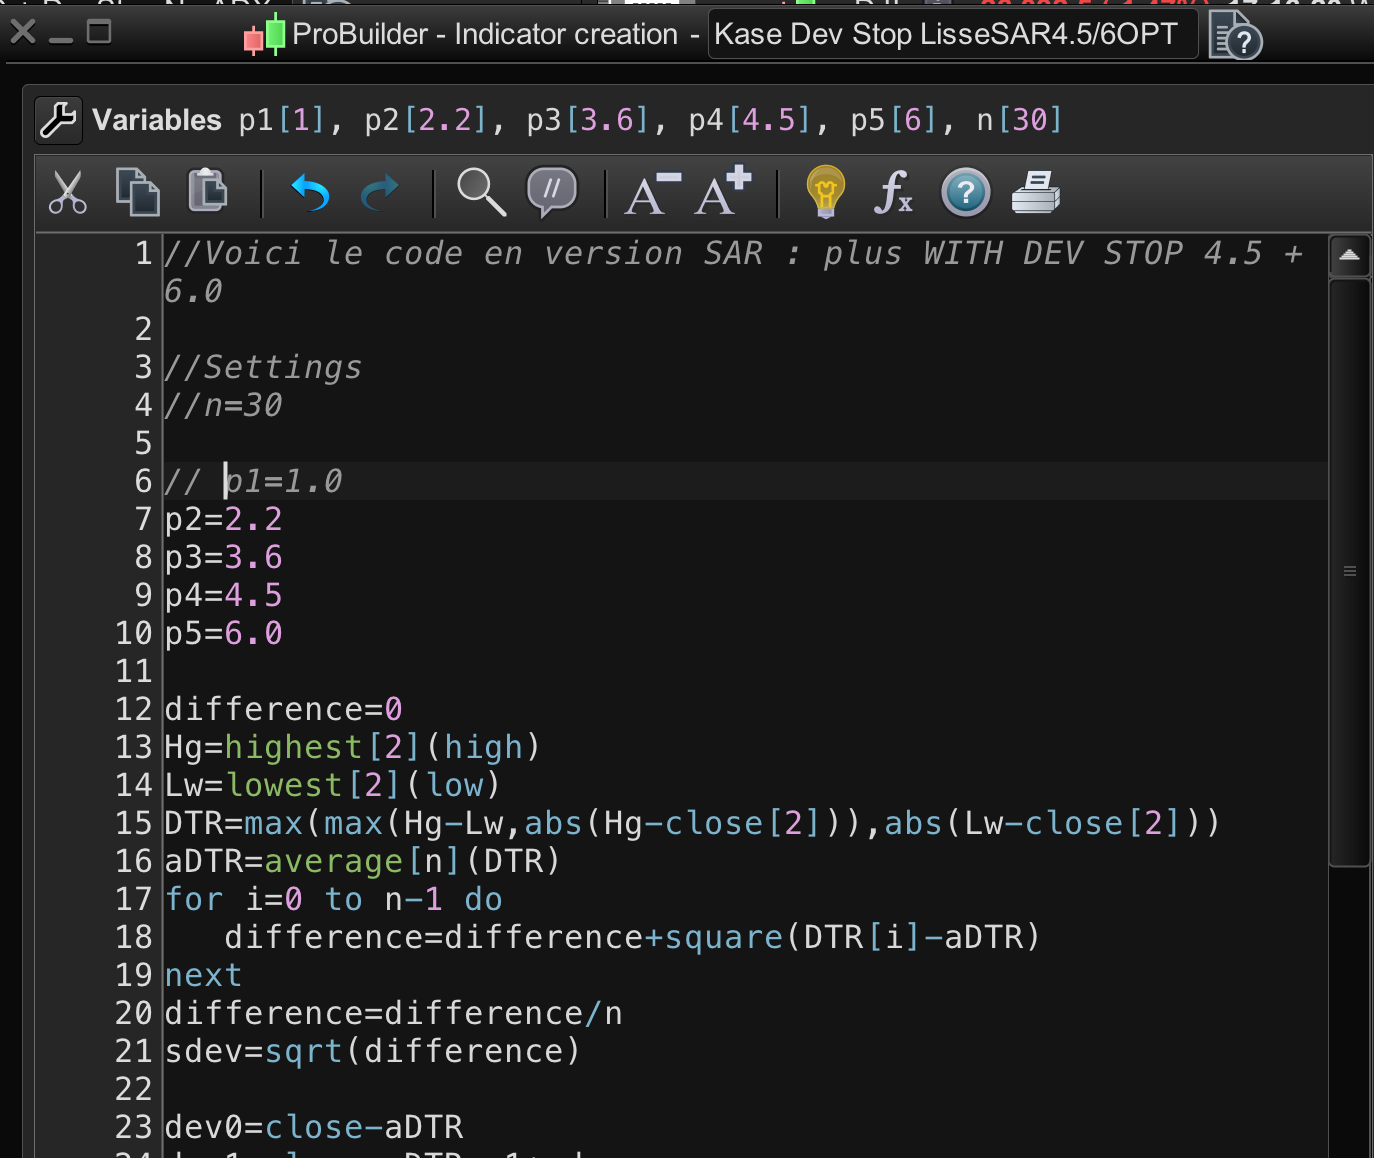
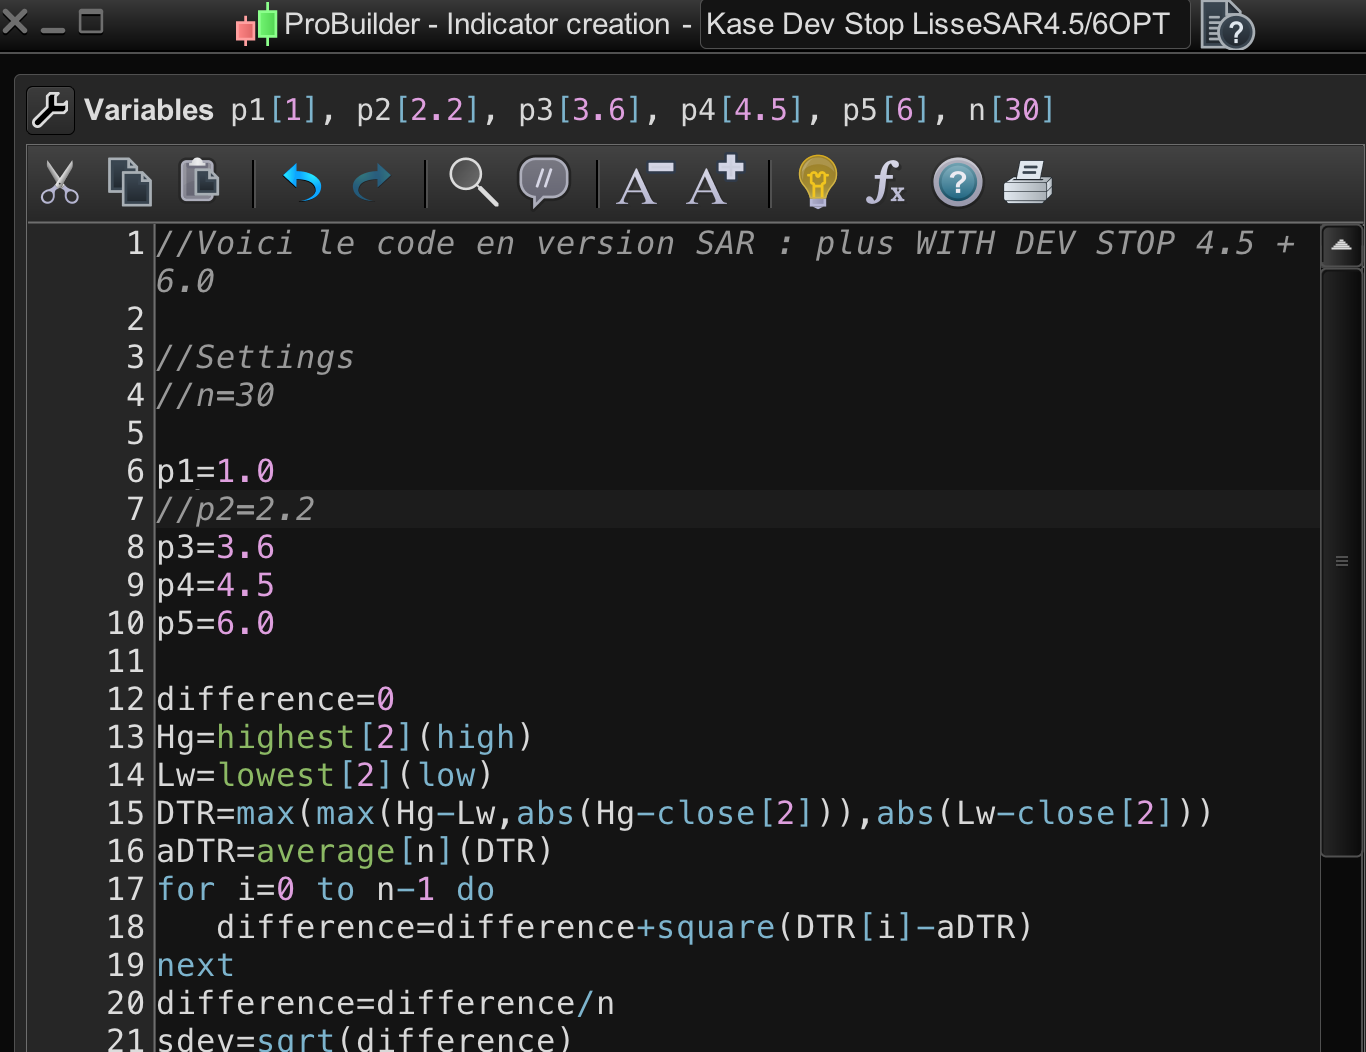
Hi @nicolas, I’ve REM’d out all the p1 to p6 values in the indicator and the strategy code (where I’d also added the indicator code). It’s optimising but without profits when profits were achieved manually adjusting the Dev Stops values using std deviations of 1 to 6…
(I’ve put all the p values in bold)
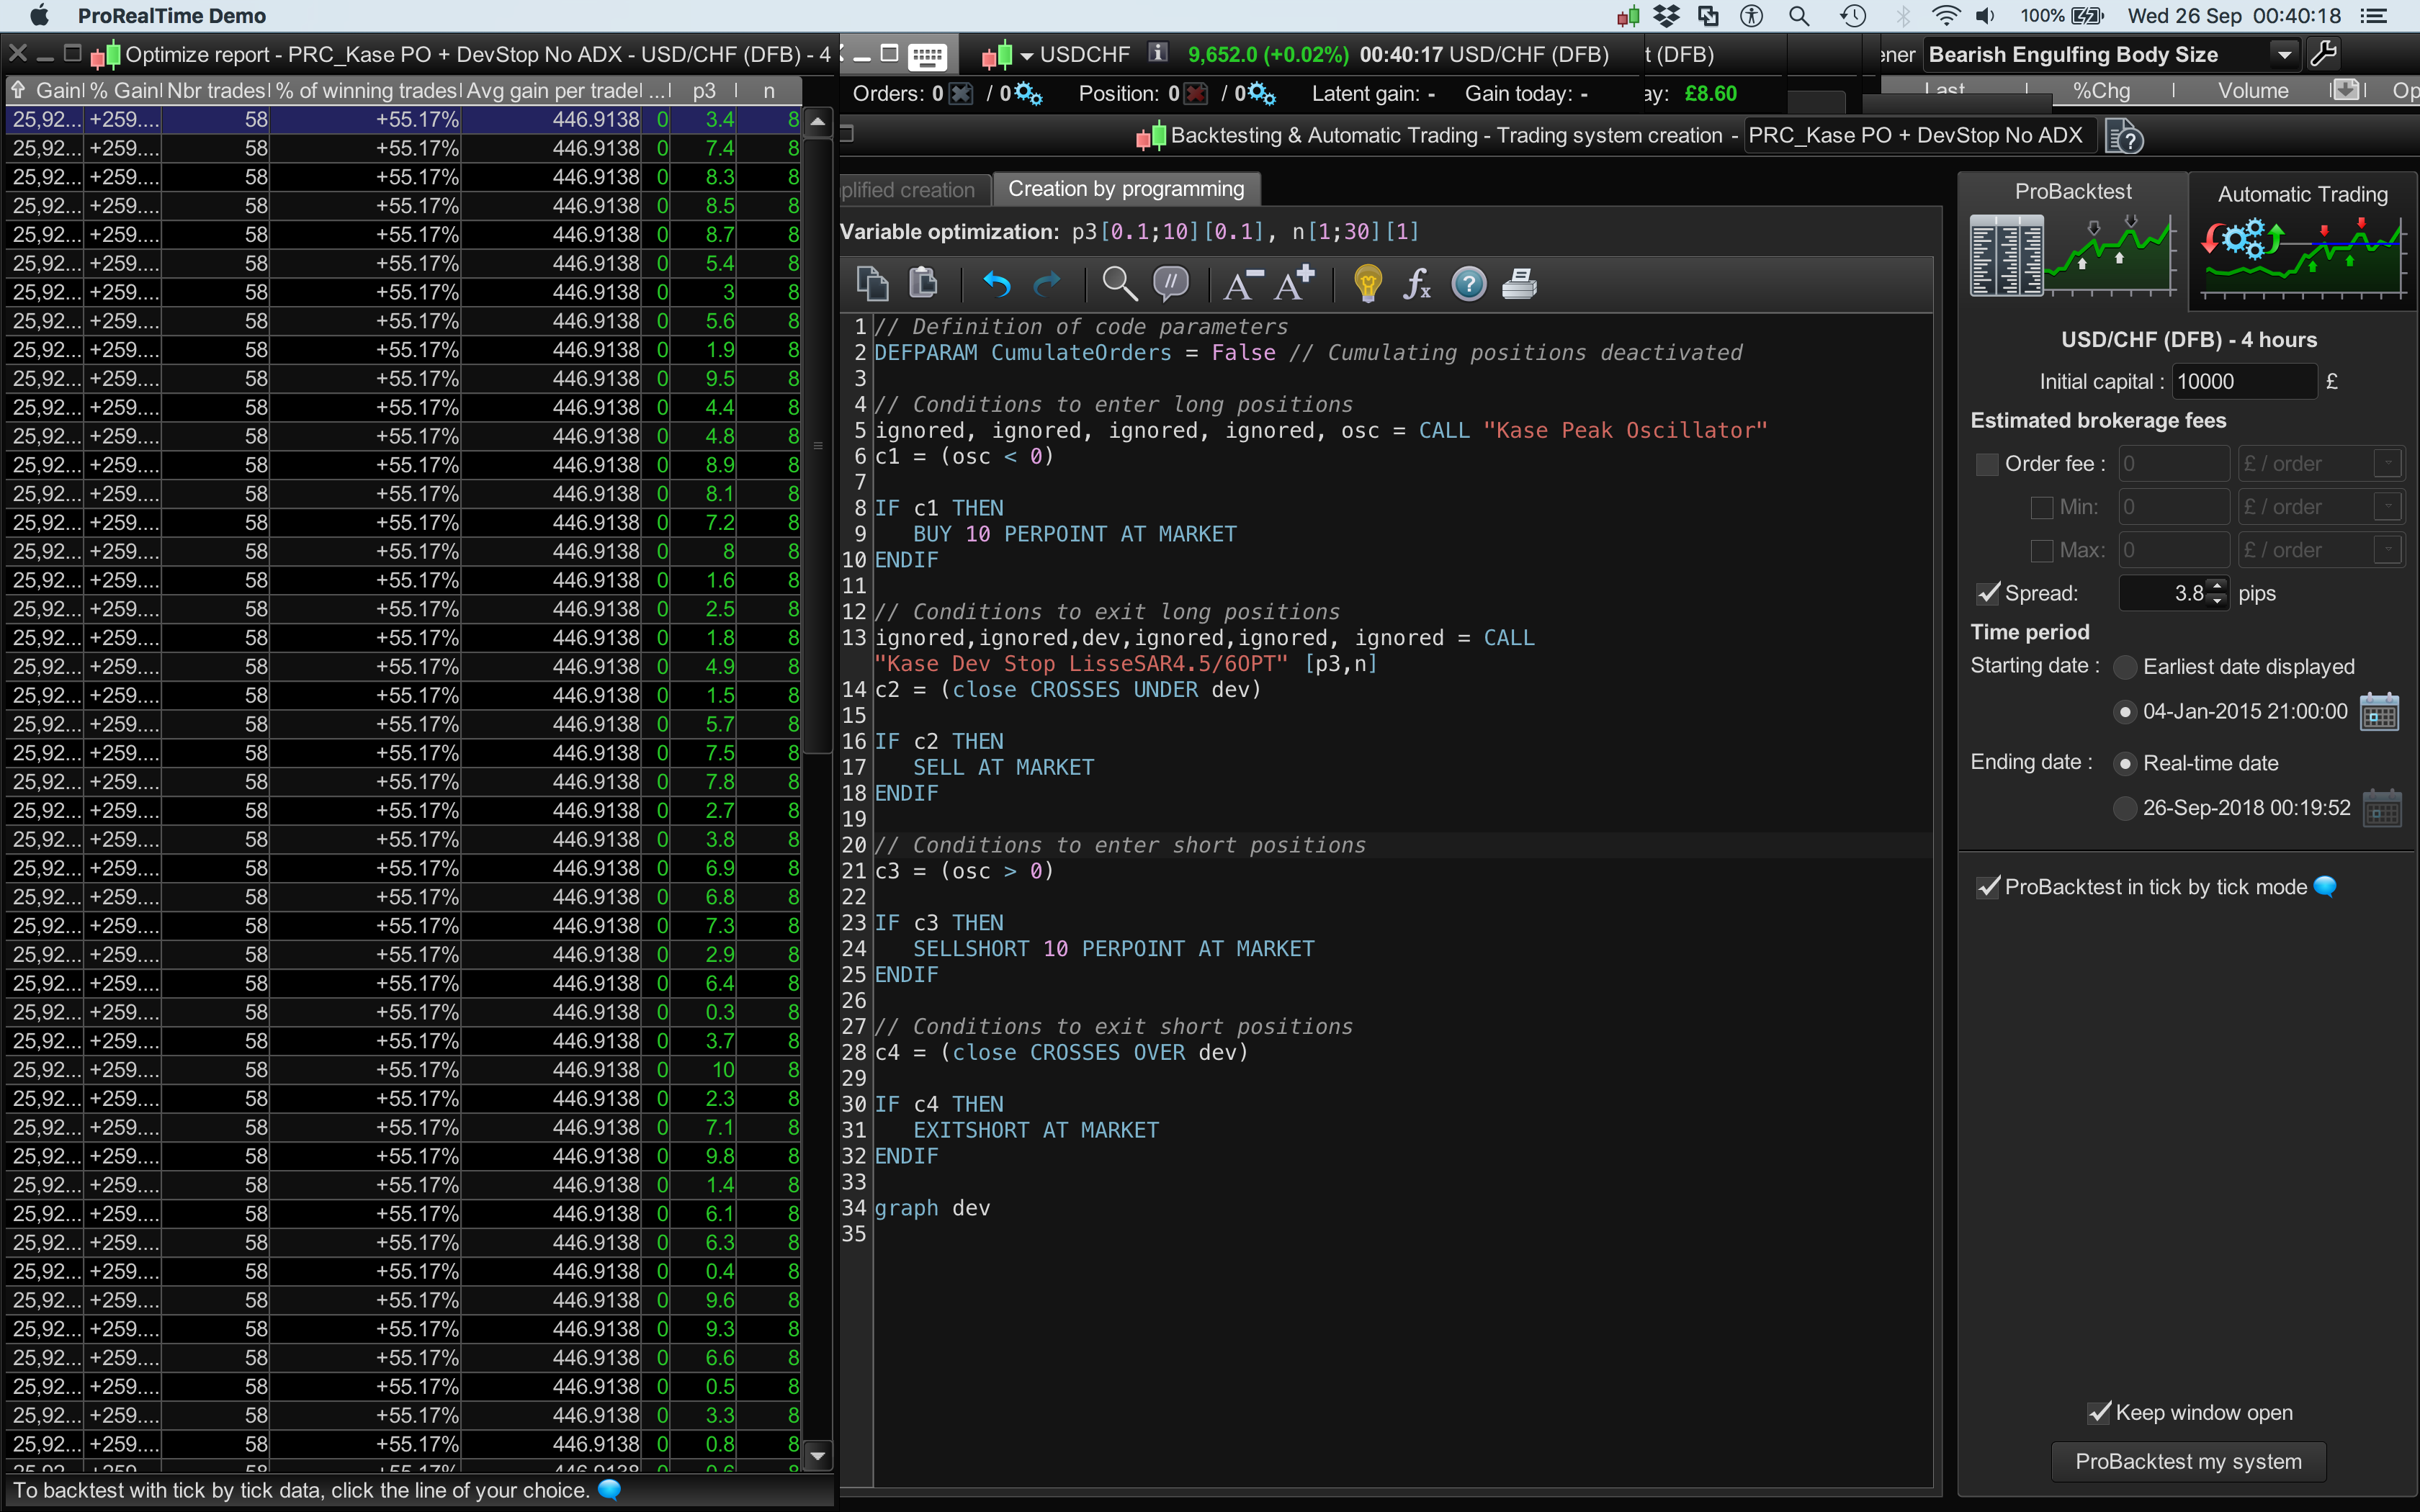
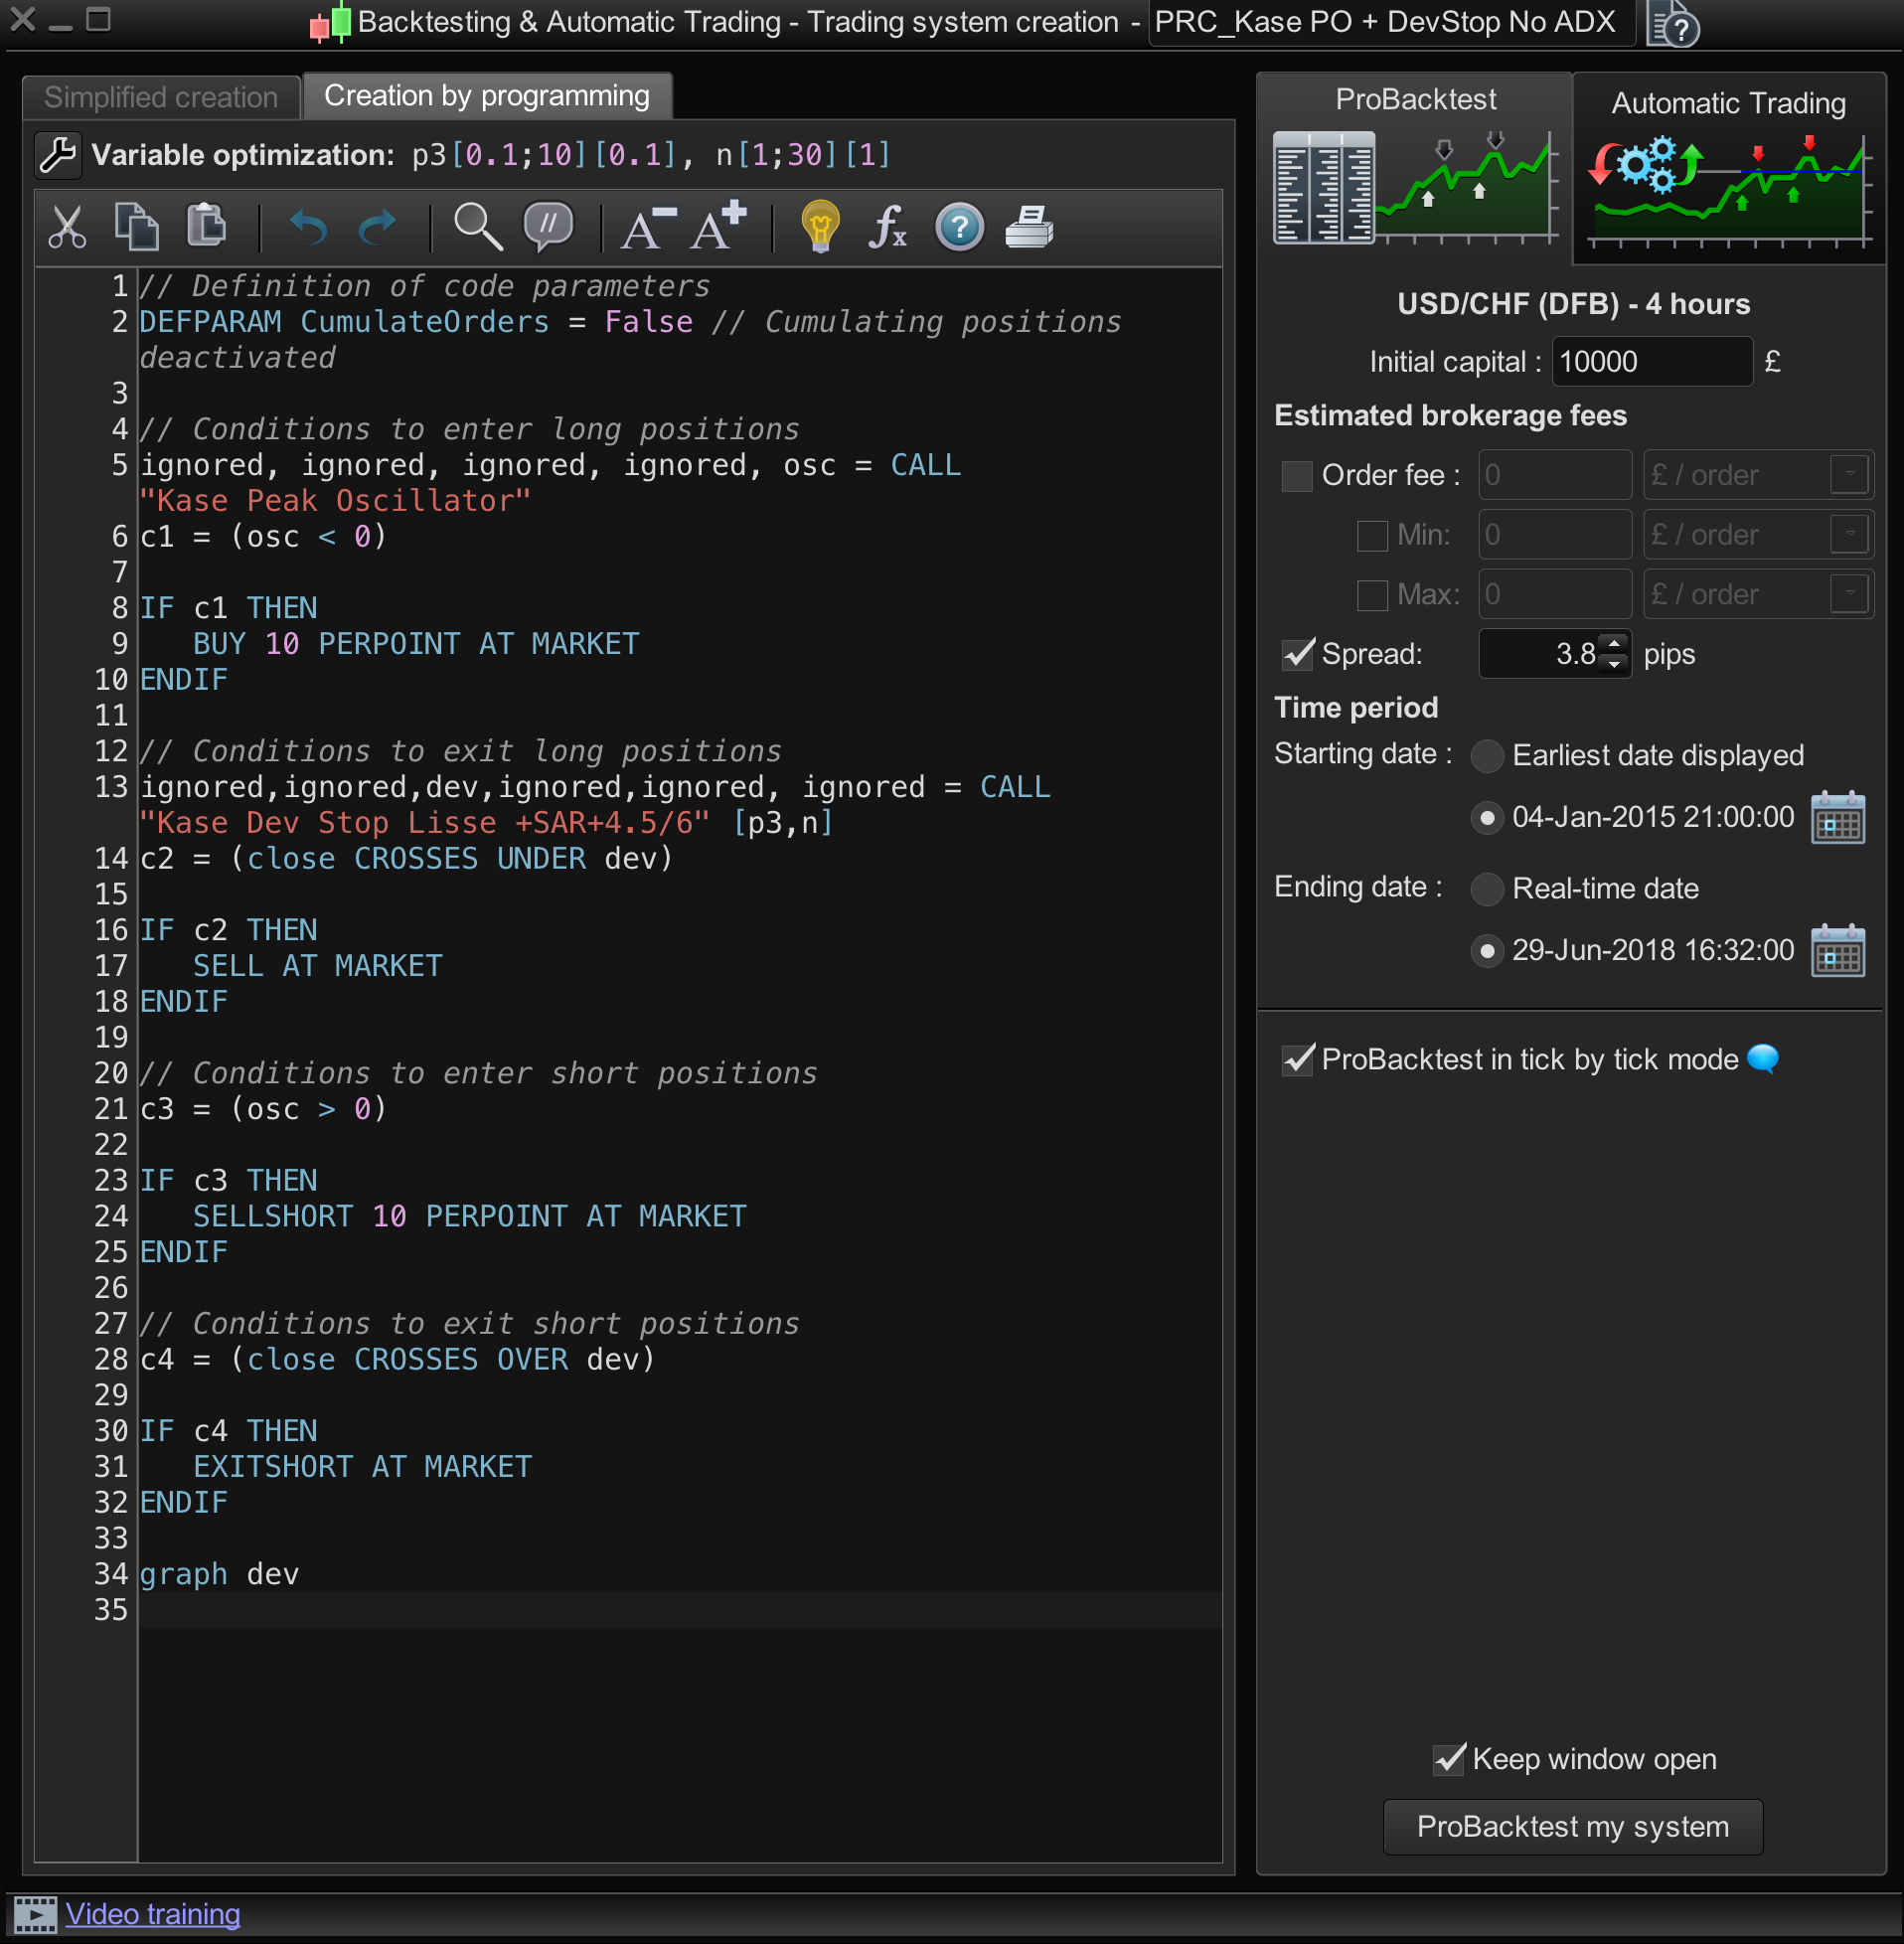
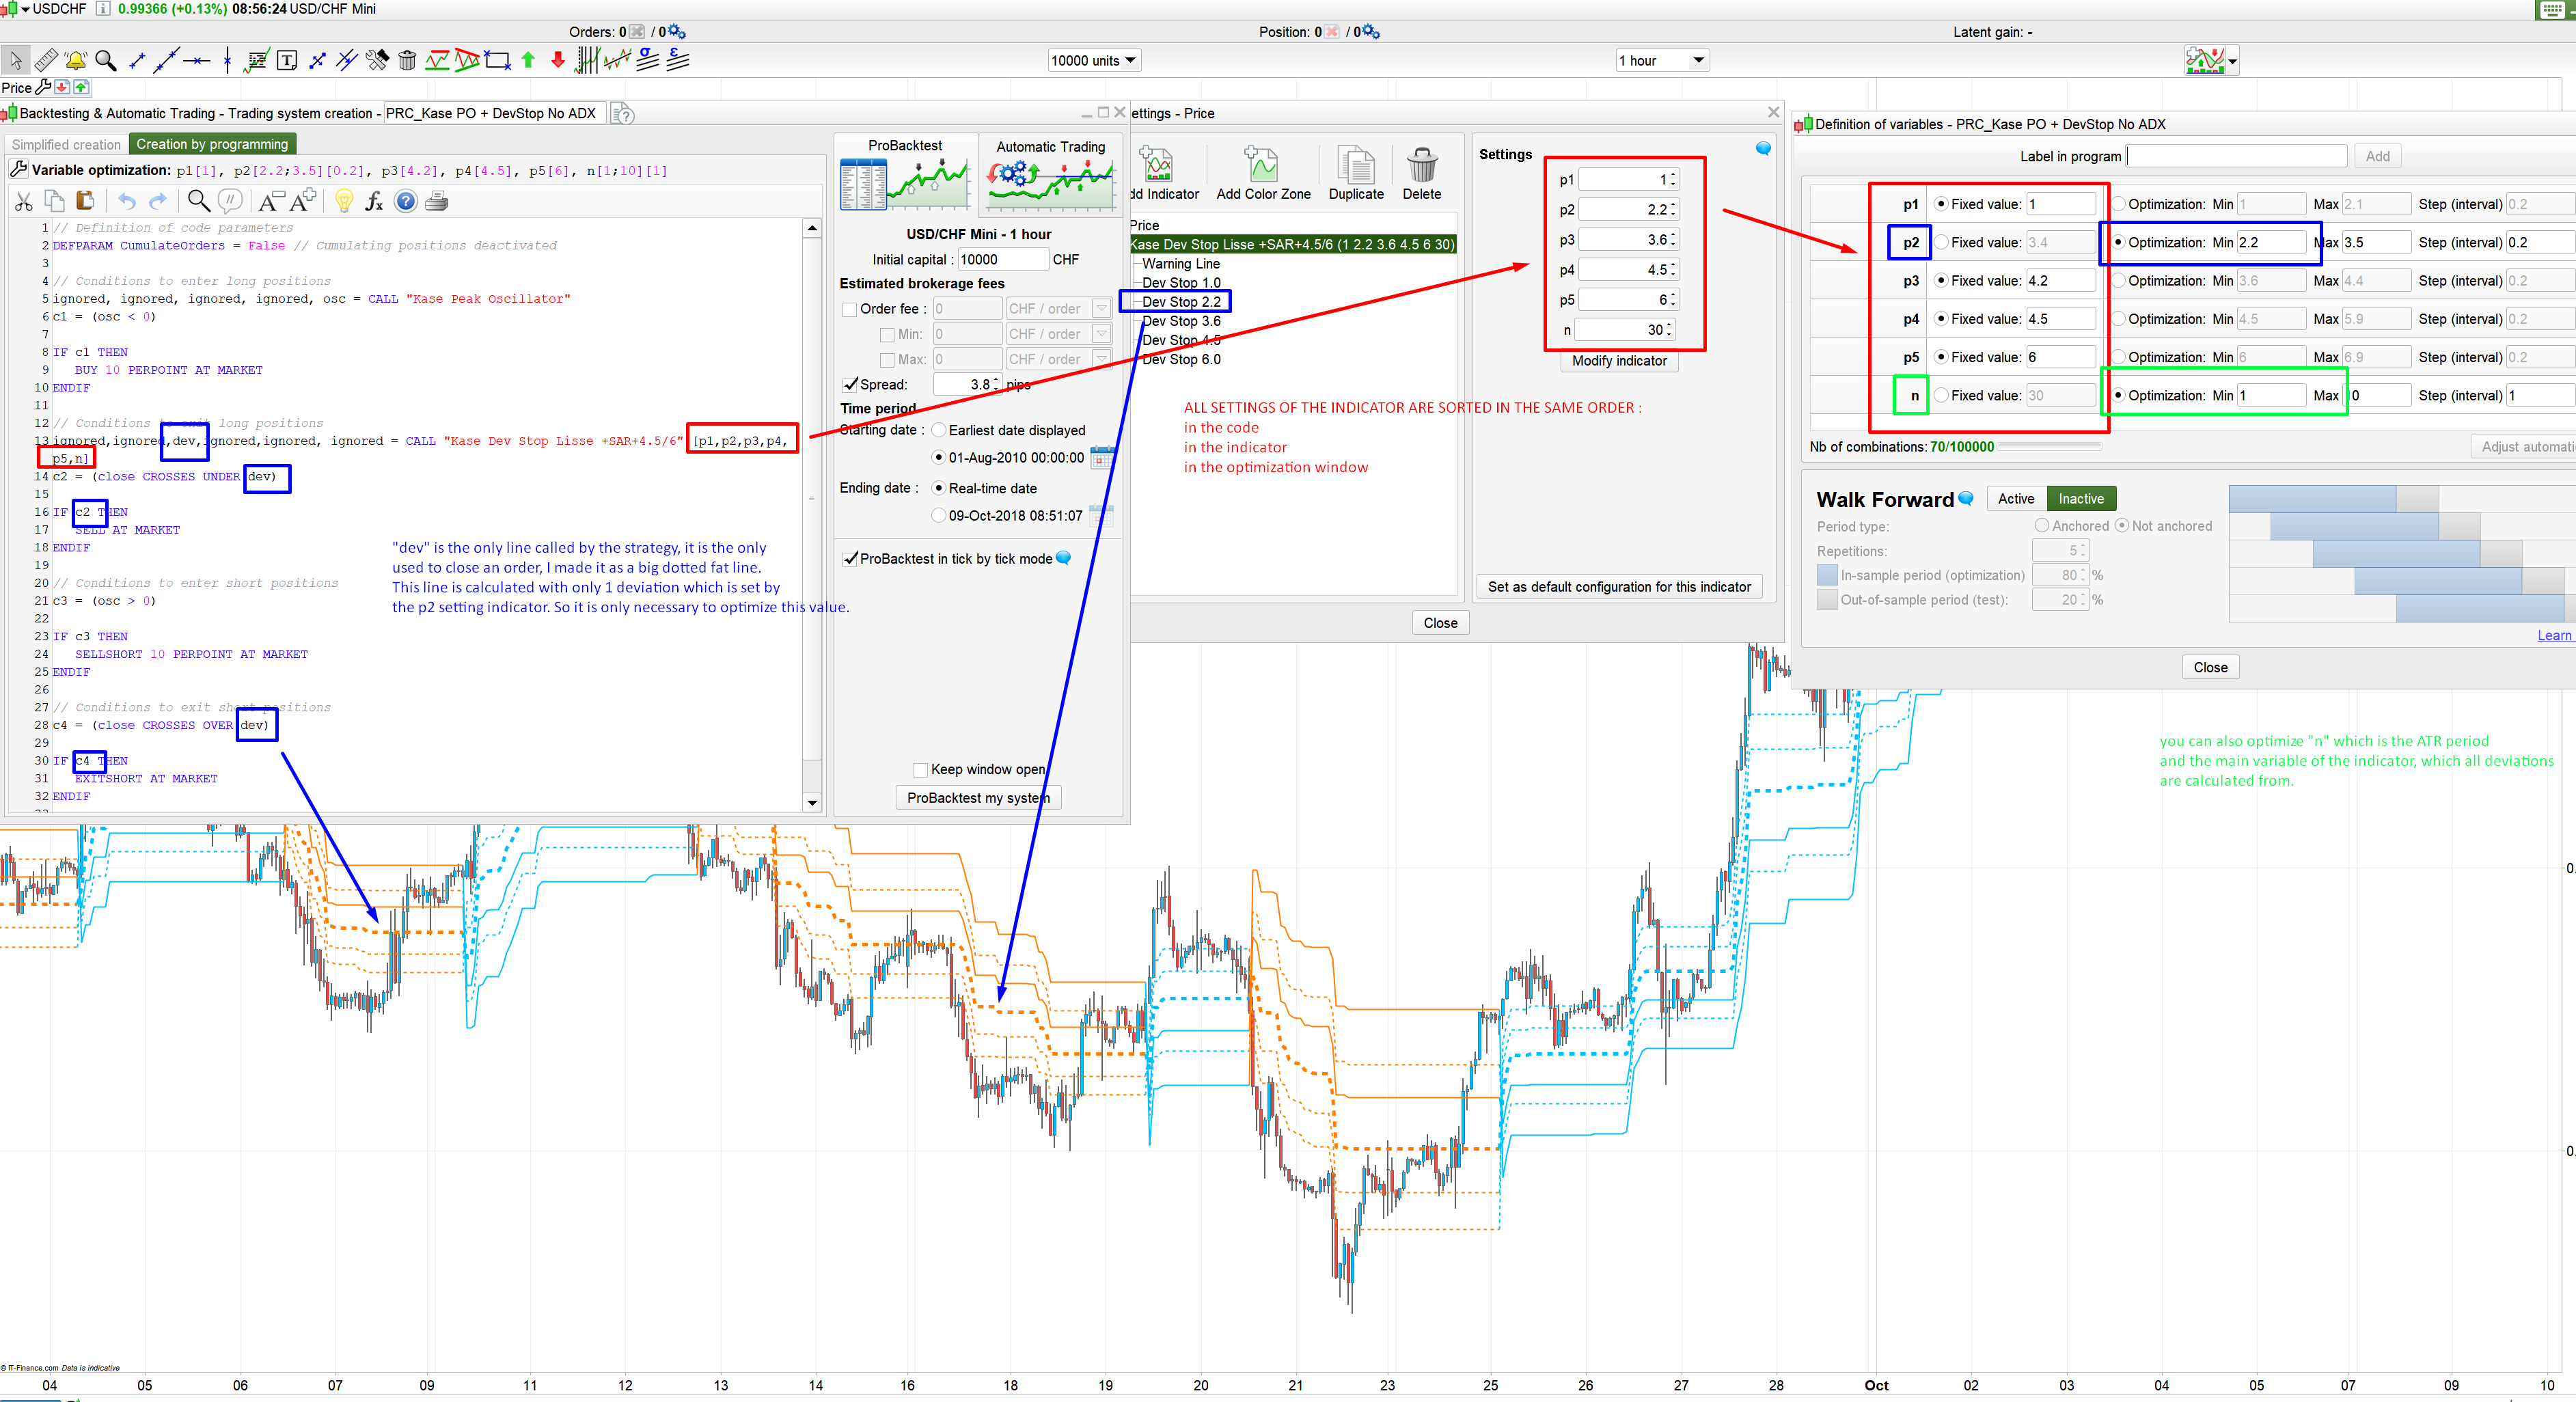
To clarify, is the Kase Dev Stop code being called from the code where I’d added the indicator into the strategy, or from the actual PRT indicator code when I first added the indicator originally?
I see that the Kase Dev Stop indicator name in the strategy actually includes the p values in square brackets – I’m assuming this maybe where the issue is, but am unsure how to add strategy variable optimsation values (via the spanner) without the strategies indicator name being modified and including those p values?
Thanks again,
// Conditions to exit long positions
ignored,ignored,indicator3,ignored,ignored, ignored = CALL "Kase Dev Stop Lisse +SAR+4.5/6" [WarningLine, p1,p2,p3,p4,p5]
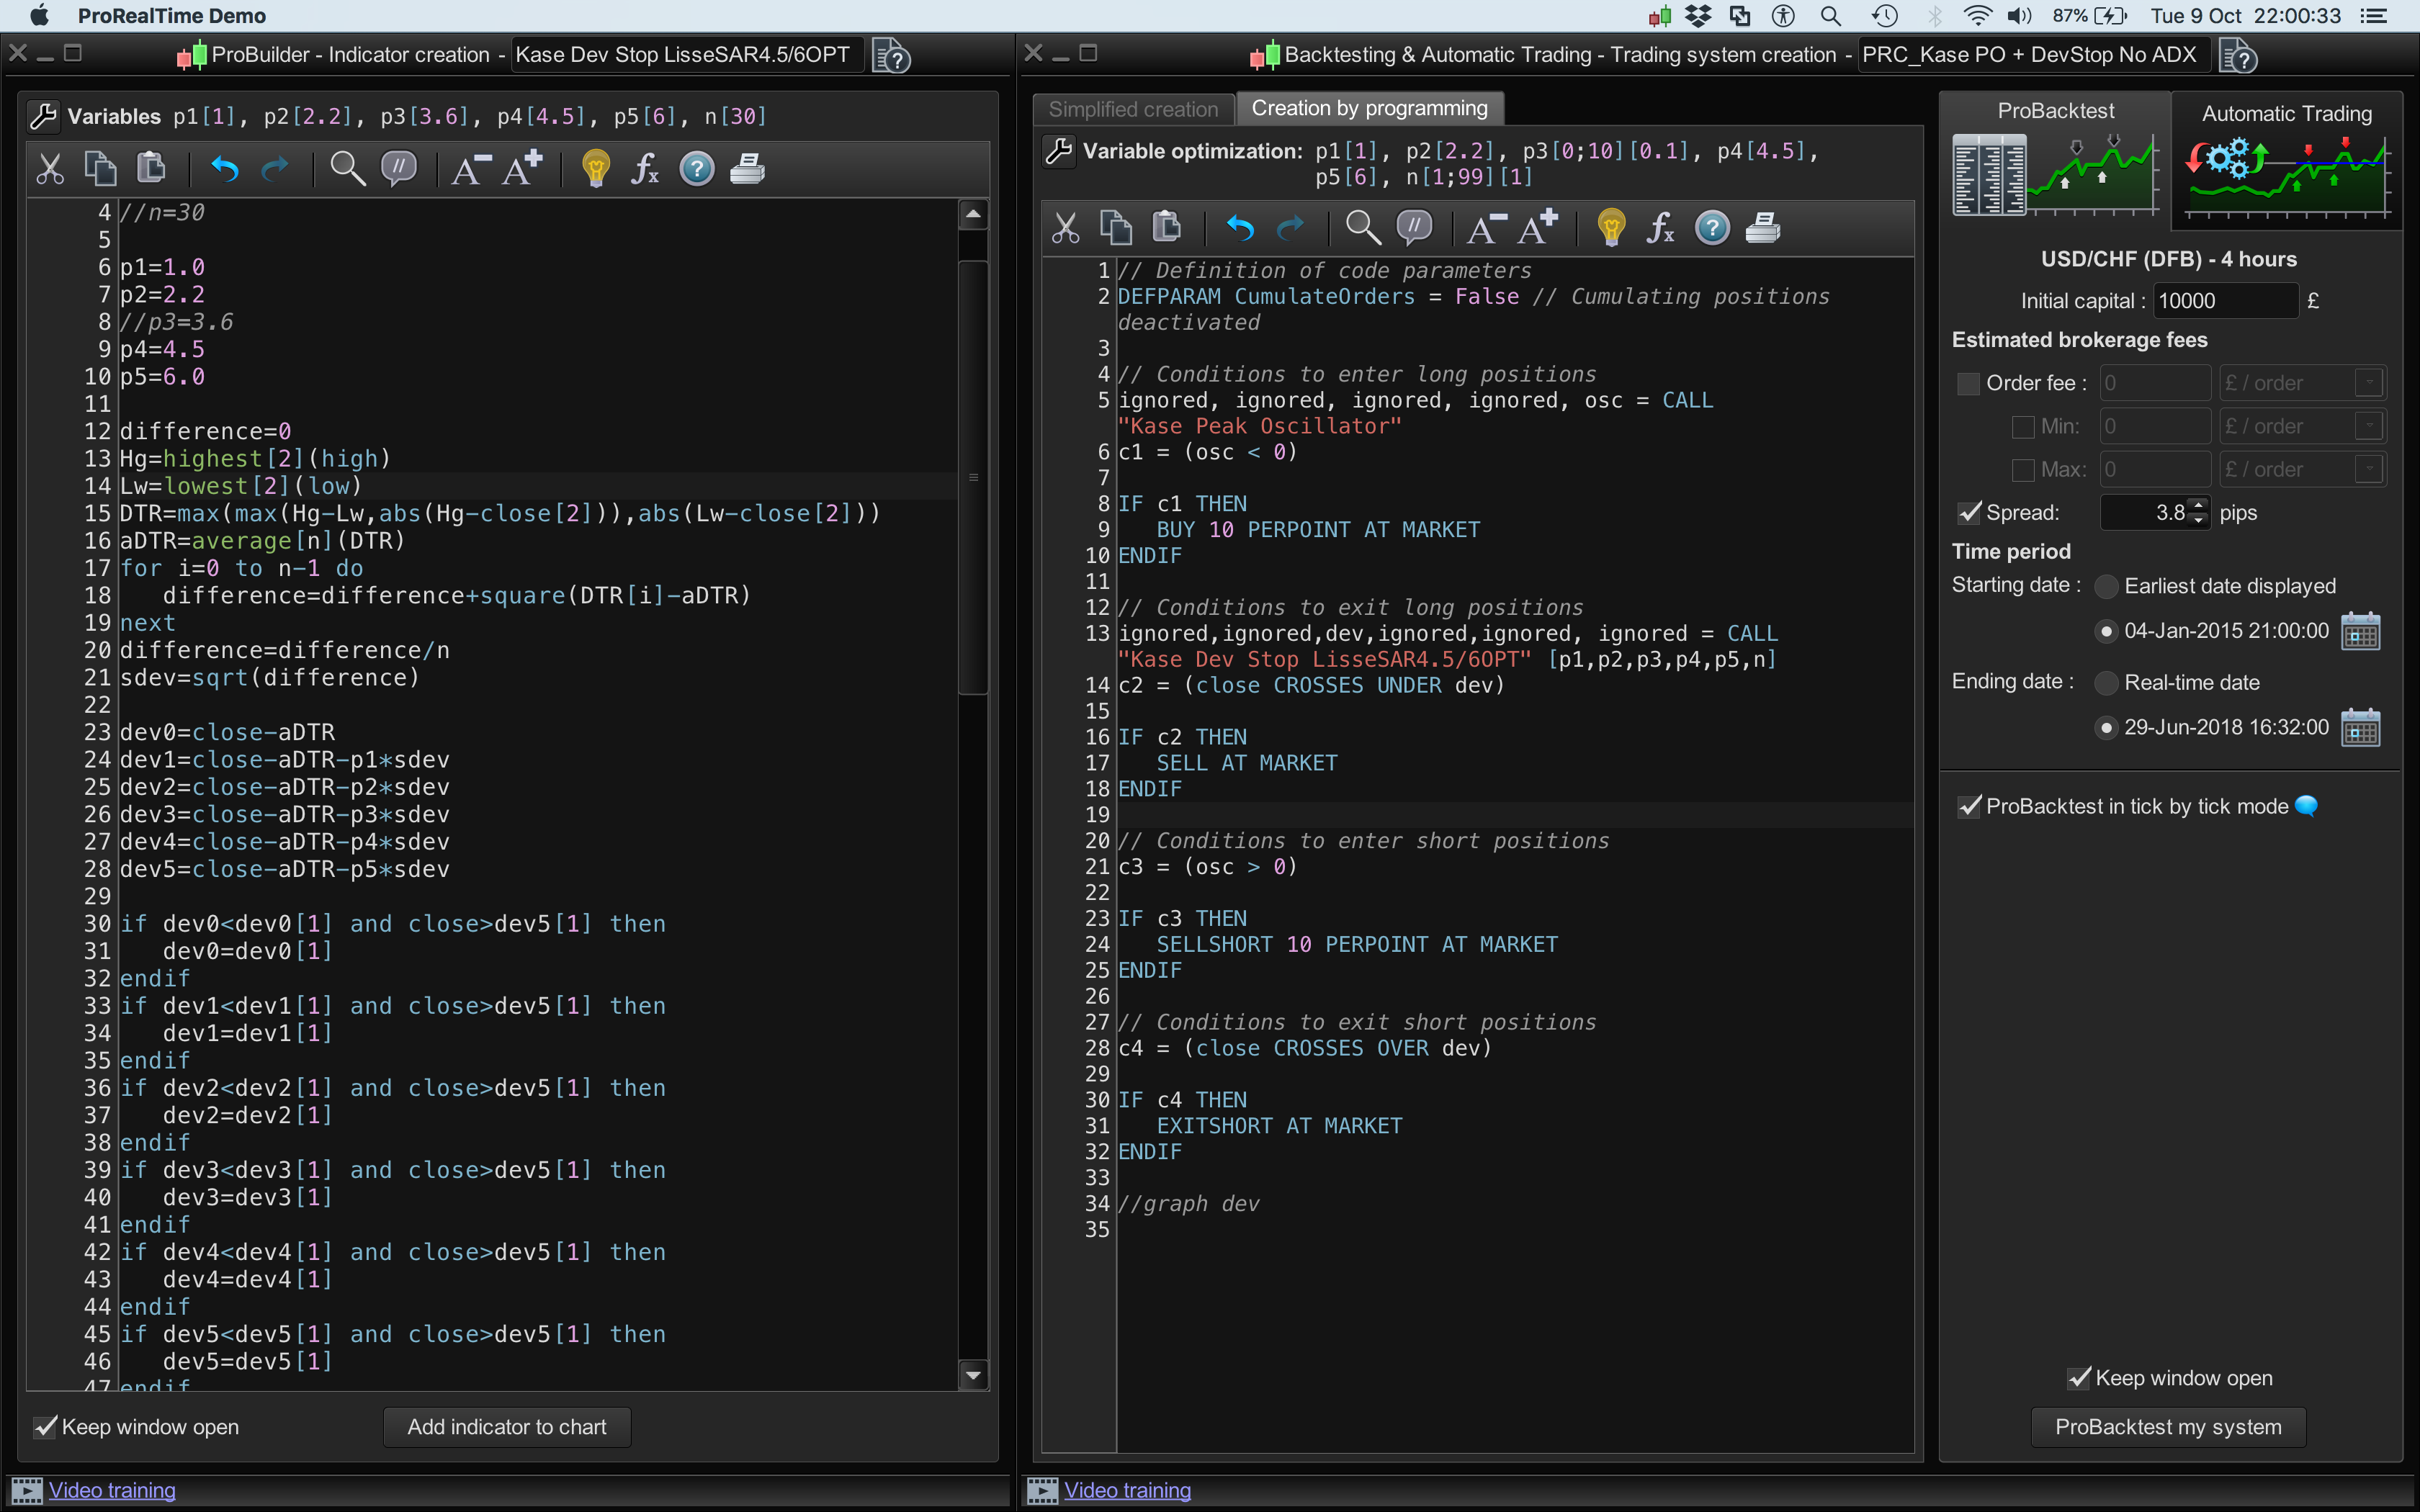
Strategy Code:
// Definition of code parameters
DEFPARAM CumulateOrders = False // Cumulating positions deactivated

// Conditions to enter long positions
ignored, ignored, ignored, ignored, indicator2 = CALL "Kase Peak Oscillator"
c1 = (indicator2 < 0)

IF c1 THEN
BUY 10 PERPOINT AT MARKET
ENDIF

// Conditions to exit long positions
ignored,ignored,indicator3,ignored,ignored, ignored = CALL "Kase Dev Stop Lisse +SAR+4.5/6" [WarningLine, p1,p2,p3,p4,p5]
c2 = (close CROSSES UNDER indicator3)

IF c2 THEN
SELL AT MARKET
ENDIF

// Conditions to enter short positions
ignored, ignored, ignored, ignored, indicator5 = CALL "Kase Peak Oscillator"
c3 = (indicator5 > 0)

IF c3 THEN
SELLSHORT 10 PERPOINT AT MARKET
ENDIF

// Conditions to exit short positions
ignored,ignored,indicator6,ignored, ignored, ignored = CALL "Kase Dev Stop Lisse +SAR+4.5/6" [WarningLine, p1,p2,p3,p4,p5]
c4 = (close CROSSES OVER indicator6)

IF c4 THEN
EXITSHORT AT MARKET
ENDIF

// Stops and targets
//SET STOP pTrailing 500 //OPTIMISED = 430
//250 and anything over 300 to 500 tics)


//Settings
n=30

//p1=1.0
//p2=2.2
//p3=3.6
//p4=4.5
//p5=6.0

difference=0
Hg=highest[2](high)
Lw=lowest[2](low)
DTR=max(max(Hg-Lw,abs(Hg-close[2])),abs(Lw-close[2]))
aDTR=average[n](DTR)
for i=0 to n-1 do
difference=difference+square(DTR[i]-aDTR)
next
difference=difference/n
//sdev=sqrt(difference)

dev0=close-aDTR
//dev1=close-aDTR-p1*sdev
//dev2=close-aDTR-p2*sdev
//dev3=close-aDTR-p3*sdev
//dev4=close-aDTR-p4*sdev
//dev5=close-aDTR-p5*sdev

if dev0<dev0[1] and close>dev5[1] then
dev0=dev0[1]
endif
if dev1<dev1[1] and close>dev5[1] then
dev1=dev1[1]
endif
if dev2<dev2[1] and close>dev5[1] then
dev2=dev2[1]
endif
if dev3<dev3[1] and close>dev5[1] then
dev3=dev3[1]
endif
if dev4<dev4[1] and close>dev5[1] then
dev4=dev4[1]
endif
if dev5<dev5[1] and close>dev5[1] then
dev5=dev5[1]
endif

dev6=close+aDTR
//dev7=close+aDTR+p1*sdev
//dev8=close+aDTR+p2*sdev
//dev9=close+aDTR+p3*sdev
//dev10=close+aDTR+p4*sdev
//dev11=close+aDTR+p5*sdev

if dev6>dev6[1] and close<dev11[1] then
dev6=dev6[1]
endif
if dev7>dev7[1] and close<dev11[1] then
dev7=dev7[1]
endif
if dev8>dev8[1] and close<dev11[1] then
dev8=dev8[1]
endif
if dev9>dev9[1] and close<dev11[1] then
dev9=dev9[1]
endif
if dev10>dev10[1] and close<dev11[1] then
dev10=dev10[1]
endif
if dev11>dev11[1] and close<dev11[1] then
dev11=dev11[1]
endif

if close>dev11[1] then
//flag=-1
else
if close<dev5[1] then
//flag=1
endif
endif

//if flag=-1 then
//ind0=dev0
//ind1=dev1
//ind2=dev2
//ind3=dev3
//ind4=dev4
//ind5=dev5
//k=1
//r=0
//g=191
//b=255
//else
//ind0=dev6
//ind1=dev7
//ind2=dev8
//ind3=dev9
//ind4=dev10
//ind5=dev11
//k=-1
//r=255
//g=128
//b=0
//endif

//ORIG return ind0 COLOURED BY k,ind1 coloured by k,ind2 coloured by k,ind3 coloured by k//

//ORANGE AND LIGHT BLUE
//return ind0 coloured(r,g,b) style(dottedline,2) as "Warning Line", ind1 coloured(r,g,b) style(dottedline,2) as "Dev Stop 1.0", ind2 coloured(r,g,b) style(dottedline,2) as "Dev Stop 2.2", ind3 coloured(r,g,b) style(line,2) as "Dev Stop 3.6", ind4 coloured(r,g,b) style(dottedline,2) as "Dev Stop 4.5", ind5 coloured(r,g,b) style(line,2) as "Dev Stop 6.0"
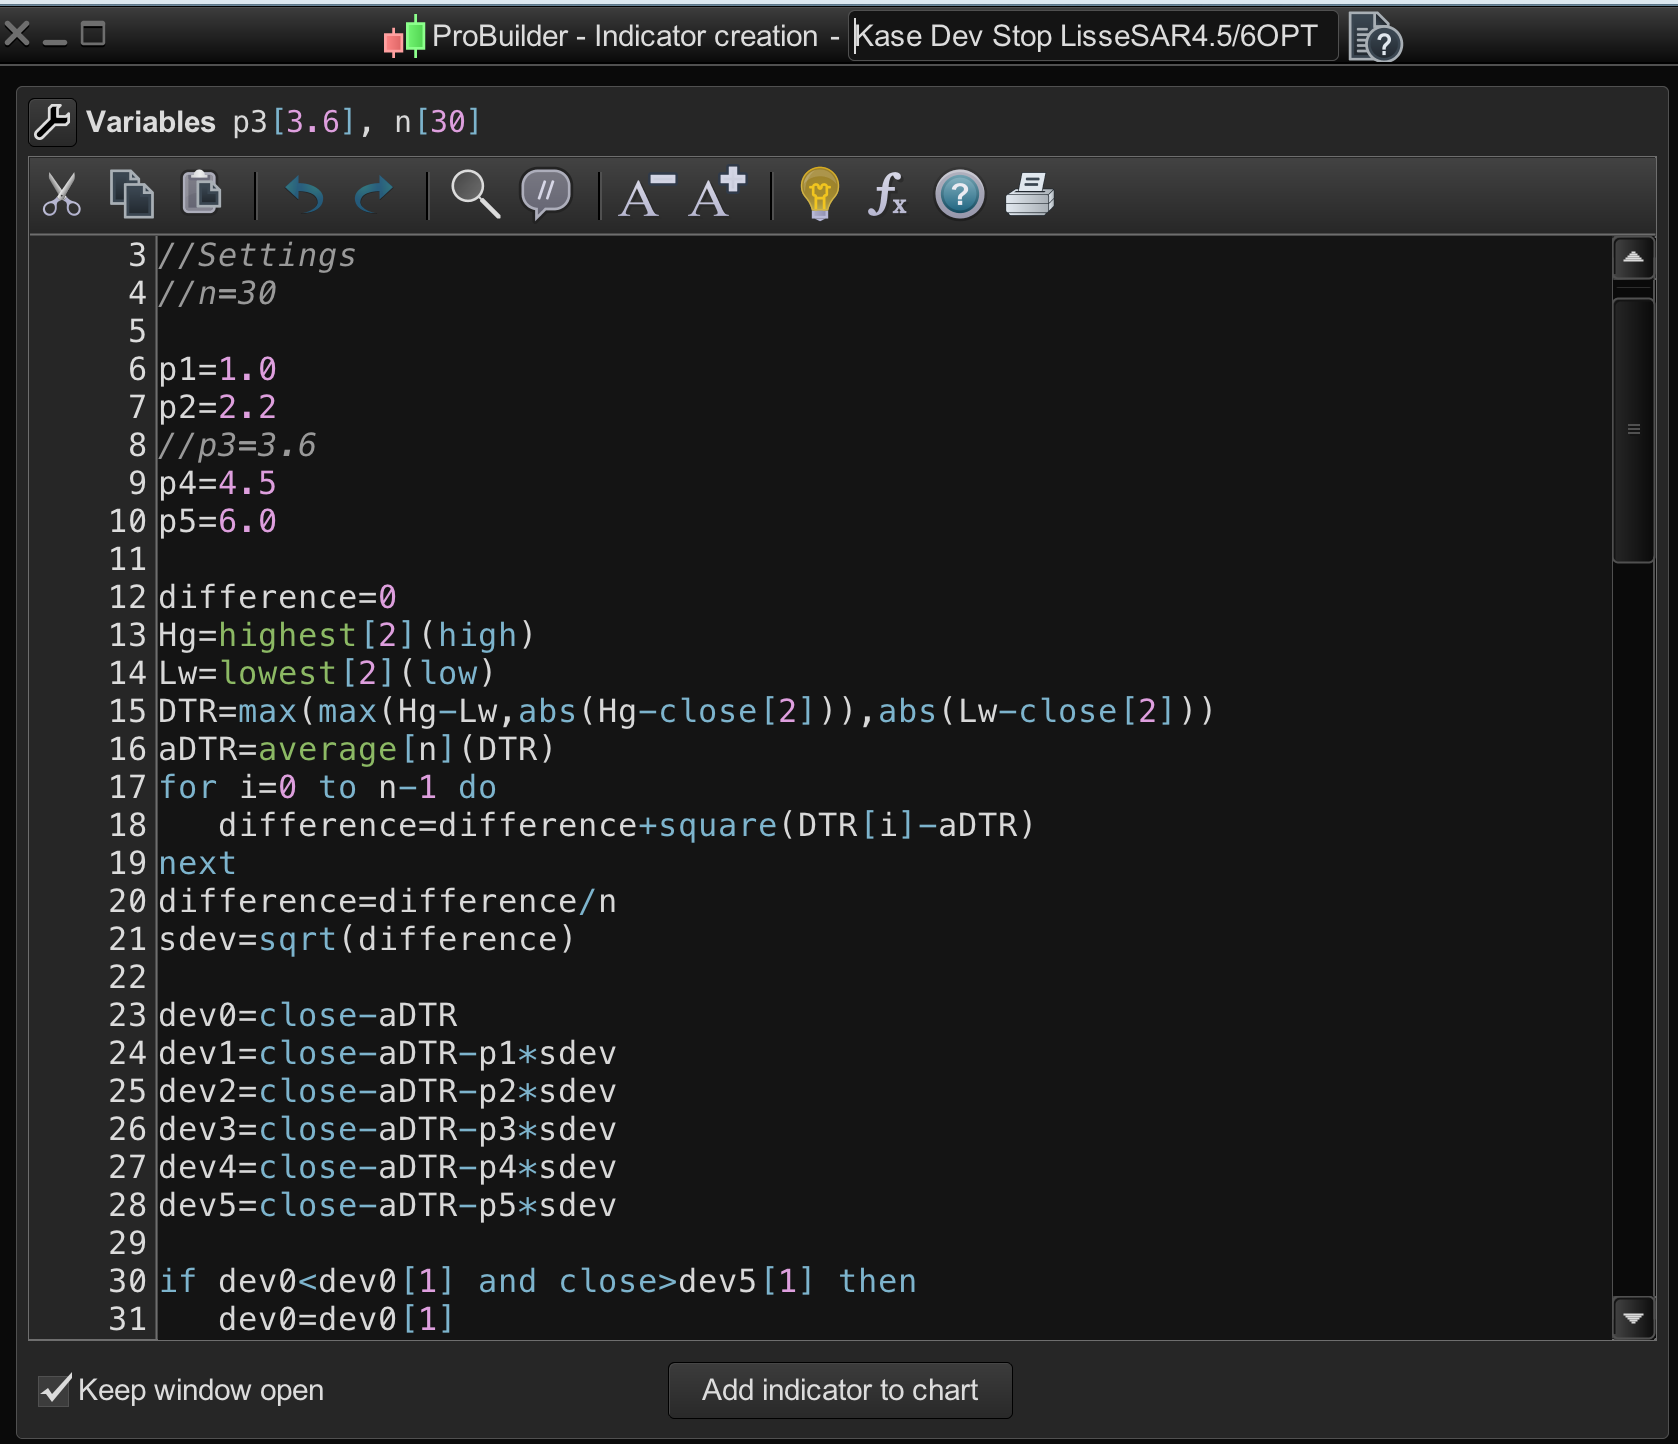
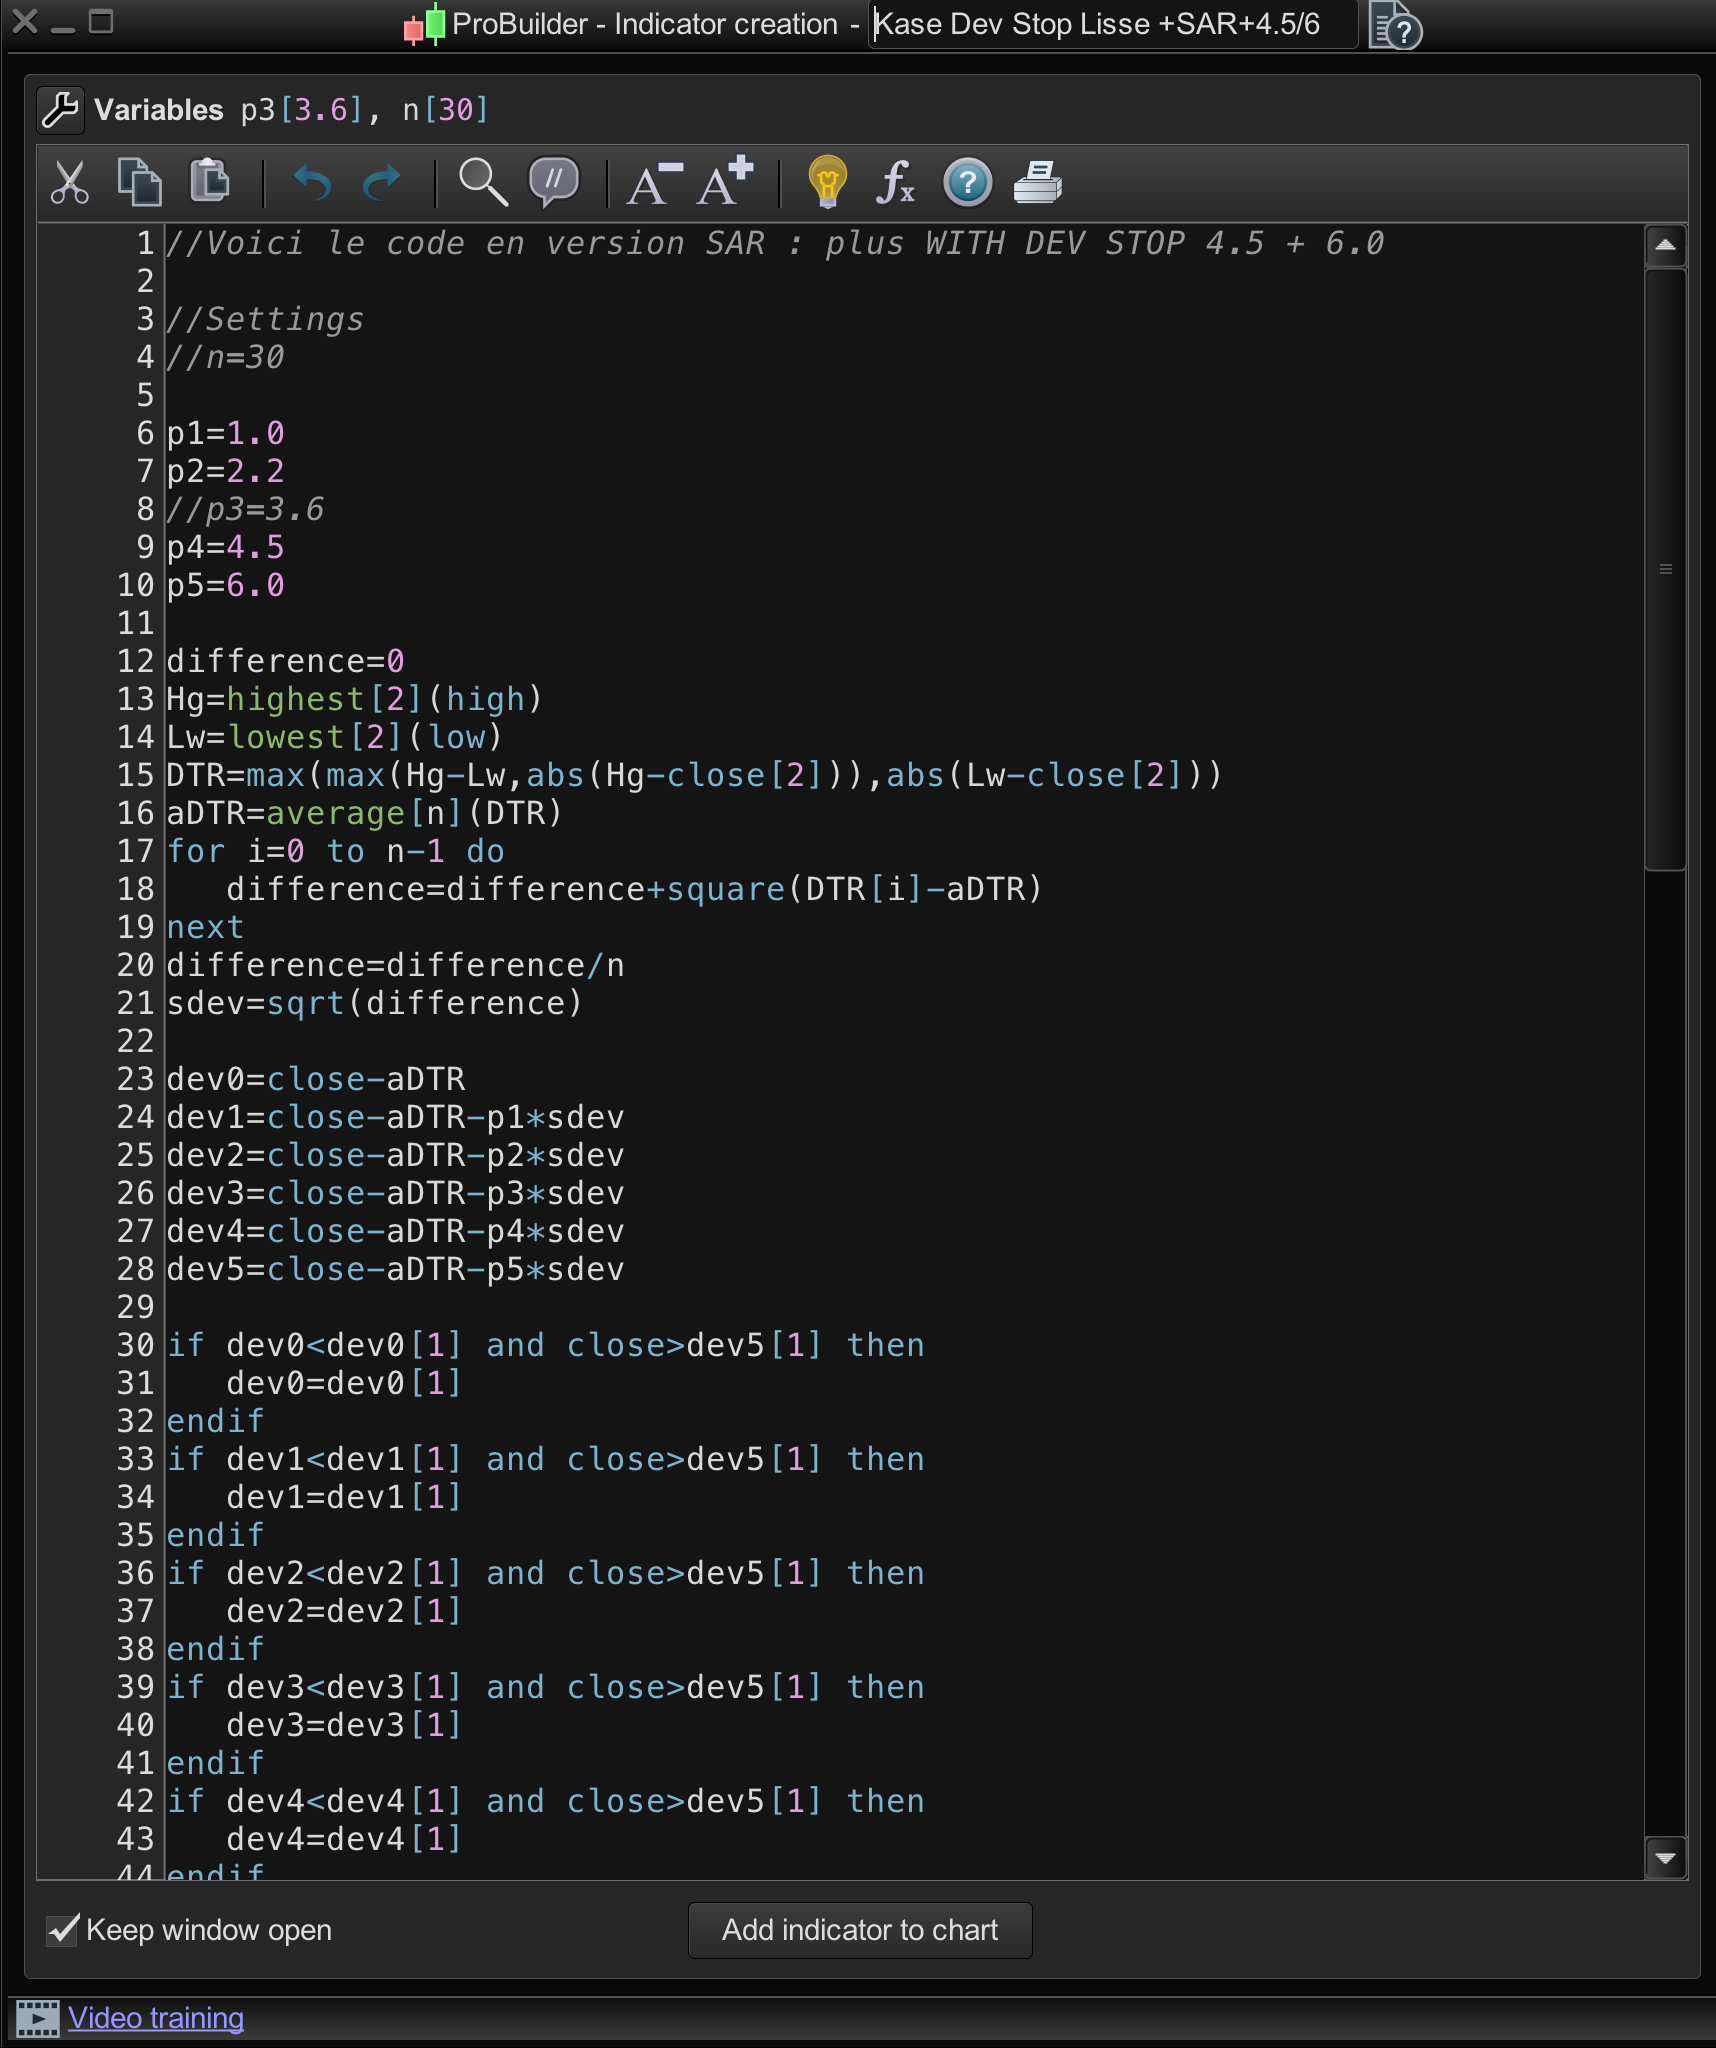
Indicator Code:
//Settings
n=30

//p1=1.0
//p2=2.2
//p3=3.6
//p4=4.5
//p5=6.0

difference=0
Hg=highest[2](high)
Lw=lowest[2](low)
DTR=max(max(Hg-Lw,abs(Hg-close[2])),abs(Lw-close[2]))
aDTR=average[n](DTR)
for i=0 to n-1 do
difference=difference+square(DTR[i]-aDTR)
next
difference=difference/n
sdev=sqrt(difference)

dev0=close-aDTR
//dev1=close-aDTR-p1*sdev
//dev2=close-aDTR-p2*sdev
//dev3=close-aDTR-p3*sdev
//dev4=close-aDTR-p4*sdev
//dev5=close-aDTR-p5*sdev

if dev0<dev0[1] and close>dev5[1] then
dev0=dev0[1]
endif
if dev1<dev1[1] and close>dev5[1] then
dev1=dev1[1]
endif
if dev2<dev2[1] and close>dev5[1] then
dev2=dev2[1]
endif
if dev3<dev3[1] and close>dev5[1] then
dev3=dev3[1]
endif
if dev4<dev4[1] and close>dev5[1] then
dev4=dev4[1]
endif
if dev5<dev5[1] and close>dev5[1] then
dev5=dev5[1]
endif

dev6=close+aDTR
//dev7=close+aDTR+p1*sdev
//dev8=close+aDTR+p2*sdev
//dev9=close+aDTR+p3*sdev
//dev10=close+aDTR+p4*sdev
//dev11=close+aDTR+p5*sdev

if dev6>dev6[1] and close<dev11[1] then
dev6=dev6[1]
endif
if dev7>dev7[1] and close<dev11[1] then
dev7=dev7[1]
endif
if dev8>dev8[1] and close<dev11[1] then
dev8=dev8[1]
endif
if dev9>dev9[1] and close<dev11[1] then
dev9=dev9[1]
endif
if dev10>dev10[1] and close<dev11[1] then
dev10=dev10[1]
endif
if dev11>dev11[1] and close<dev11[1] then
dev11=dev11[1]
endif

if close>dev11[1] then
flag=-1
else
if close<dev5[1] then
flag=1
endif
endif

if flag=-1 then
ind0=dev0
ind1=dev1
ind2=dev2
ind3=dev3
ind4=dev4
ind5=dev5
//k=1
r=0
g=191
b=255
else
ind0=dev6
ind1=dev7
ind2=dev8
ind3=dev9
ind4=dev10
ind5=dev11
//k=-1
r=255
g=128
b=0
endif

//ORIG return ind0 COLOURED BY k,ind1 coloured by k,ind2 coloured by k,ind3 coloured by k//

//ORANGE AND LIGHT BLUE
return ind0 coloured(r,g,b) style(dottedline,2) as "Warning Line", ind1 coloured(r,g,b) style(dottedline,2) as "Dev Stop 1.0", ind2 coloured(r,g,b) style(dottedline,2) as "Dev Stop 2.2", ind3 coloured(r,g,b) style(line,2) as "Dev Stop 3.6", ind4 coloured(r,g,b) style(dottedline,2) as "Dev Stop 4.5", ind5 coloured(r,g,b) style(line,2) as "Dev Stop 6.0"