Sorry – I edited my post while you were posting.
It is just like seasonality. Your idea might work but a back test tells us nothing because we are just fitting to history. Seasonality can only be forward tested because it will always look great in the past!
Many advocate trading seasonality using a rolling look back period – i.e a period of 20 or 10 years or 5 years and every month the first month of the 20/10/5 year period is forgotten and replaced with the last month.
No problem it is only an idea not a holy grail to bet my house. 🙂
I want to you the inefficency of the market
Seasonality is a bit like saying ‘the last candle went up so I will go long’ except your candle is one that represents all the Januaries in history (or all the hours beginning at 0800). Just because the January all time candle is an up one does not mean that more than five out of the next ten January all time candles will be up ones or that the gains will exceed the losses. In fact the next nine candles could as easily be down ones and tell you to go short on the tenth one and then the tenth is an up one! We just look at history and hope it will repeat itself and sometimes it does and sometimes it doesn’t.
Dear Vanosi, if you have a better approach how to get better statistics I will appreciate if you share it. 😉
poppi999 – there is no better approach.
As far as trading is concerned statistics are just an analysis of the past just so that we can say ‘if I had done this or that then how often would I have won compared to lose and how much would I have won or lost?’ They tell us nothing about the future. It is called spread betting for a reason and so we can use history to hope to get an edge when we bet on the future but I think that if a statistic is based on an hour of time in the past that has shown a profit over all of history then it is as likely to want to take that profit back as it reverses to the mean as it is to continue to be profitable. It is like going to the casino once a week and placing one bet on red. After ten weeks you are in profit and have won nine times so red has to be the way to go next week – but in reality the probability of it being red at any one time has not changed at all just because statistics gathered over the last ten weeks tell us red is profitable with a high win rate.
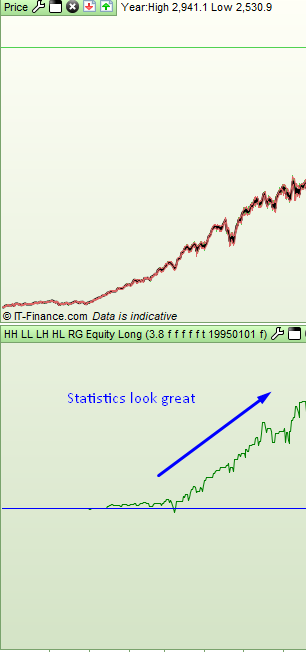
Here is an example of why statistics are not always as good as they seem. This is a chart of the SP500 weekly and the line is the equity curve if you bought every red week and sold after one week. At the start the statistics seem to have found us a winning strategy:
[attachment file=86925]
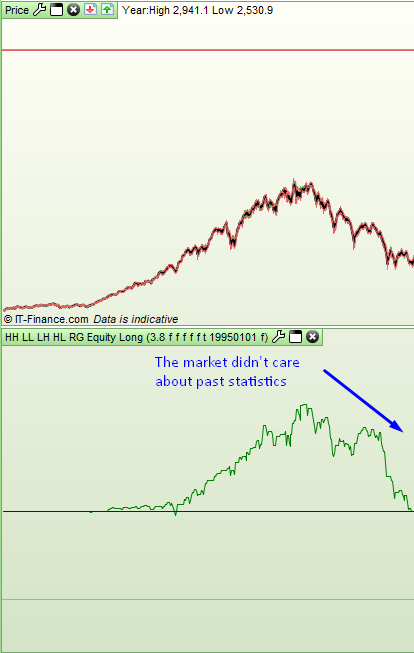
….so we decide to go live and go long on red candles and then look what happens next:
[attachment file=86926]
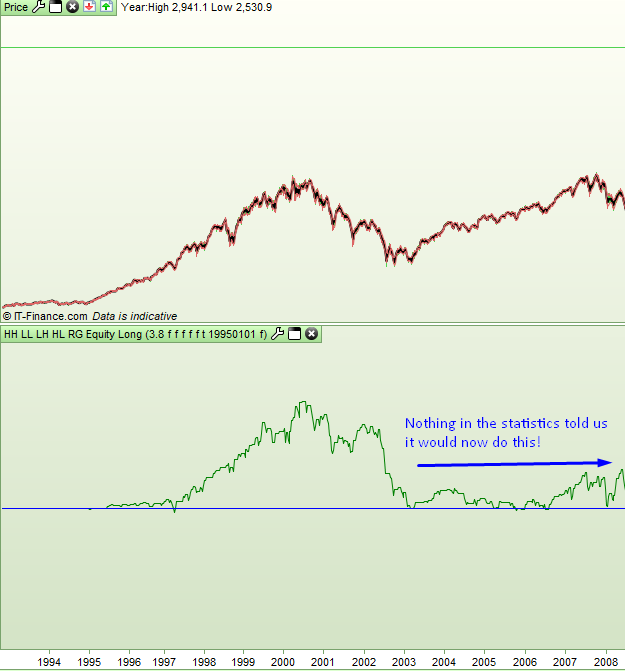
So we decide that we should have been going short instead of long as recent statistics tell us that has been profitable and then look at what happens next:
[attachment file=86927]
Our analysis and gathering of statistics from the past seemed so good and yet we always seemed to be doing the wrong thing.
Thanks for your example.
And for sure that statistics do not work forever. In my opinion you have to adjust the approach after certain time.
Each market change for different reason, so we have to adjust the Approach. Doing this you will received a Feedback how the current market is, in order to find a path which work.
I know that Nothing is forever, and as Charles Darwin said, it will be a continious Evolution.
I do not say that my method is a holy grail or a will earn a Million with it.
I want only to see how the most Traders act at certain time, to obtain a sign of the current Situation.
I know that you are a guy with a statistics Approach and Analysis and I like it, I saw different posts fom you. So finally if you have if you have some suggestions to share how I will appreciate it.
You might be interested in some analysis of monthly seasonality that I am doing:
Monthly Seasonality – Is it worth using?
I tried a similar thing on hourly candles but it was difficult to get any meaningful results as it was all very dependent on the exit criteria.
It would appear from the initial tests that markets do seem to actually behave similar in the future to the past – at least on a monthly basis. I guess money goes away and comes back to the market based on cycles such as the lower activity in the summer etc and maybe seasonality itself is self feeding. The more something keeps happening the more likely it is to keep happening as more and more people become aware of it. I’m not sure if this can be taken down to an hour by hour level of seasonality though and testing is tricky and a bit of a coding challenge.