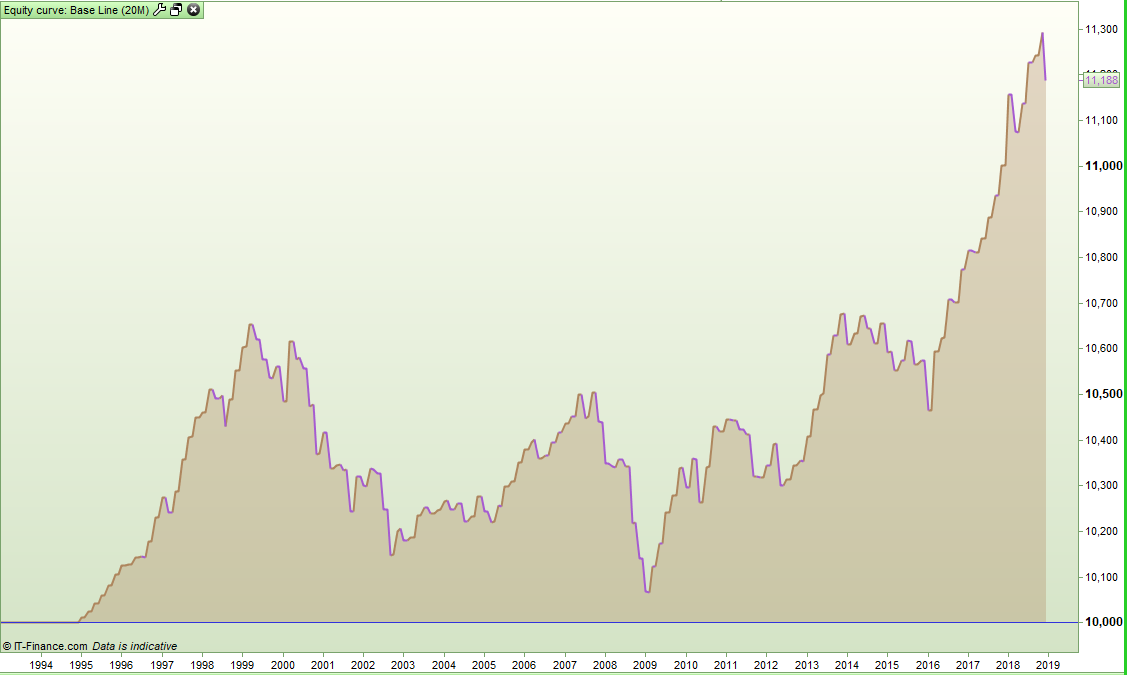
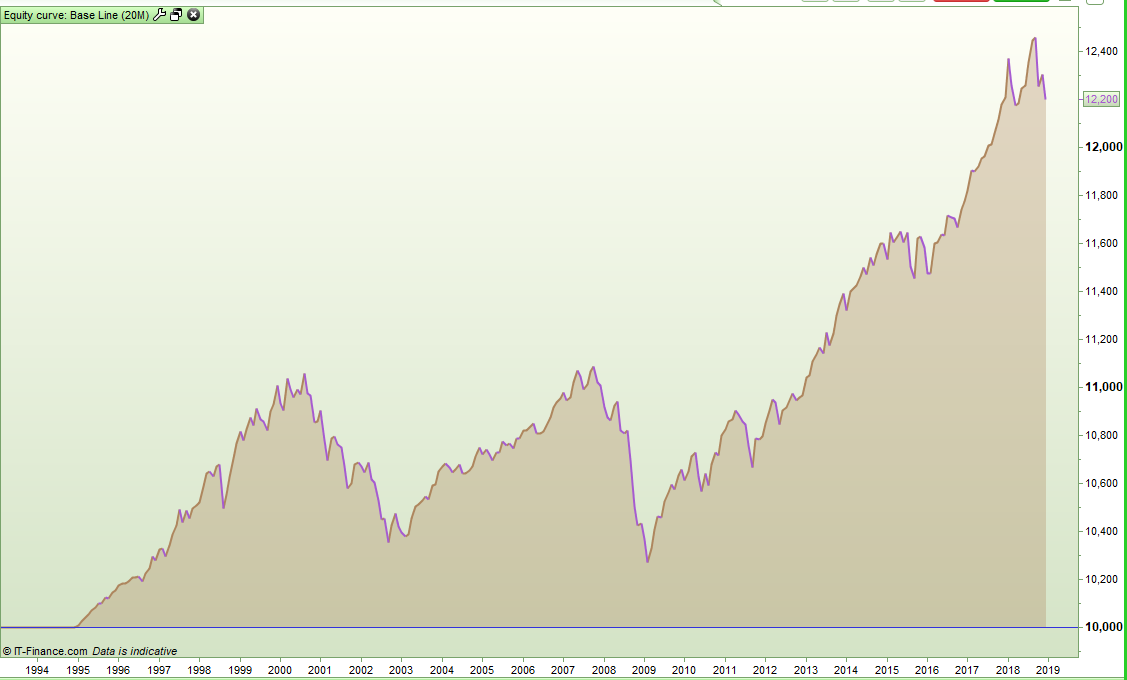
I decided to run some tests on monthly seasonality to try to quantify how useful it is or isn’t and so I wrote three strategies. The first strategy just buys at the beginning of a month and sells at the open of the next month. This was tested with no spread and so gives us our base line to compare the other strategies to – almost buy and hold but closure at each month was needed to get the performance report for comparison with. Here are the equity curve and results for that on the SP500:
[attachment file=87009]
[attachment file=87010]
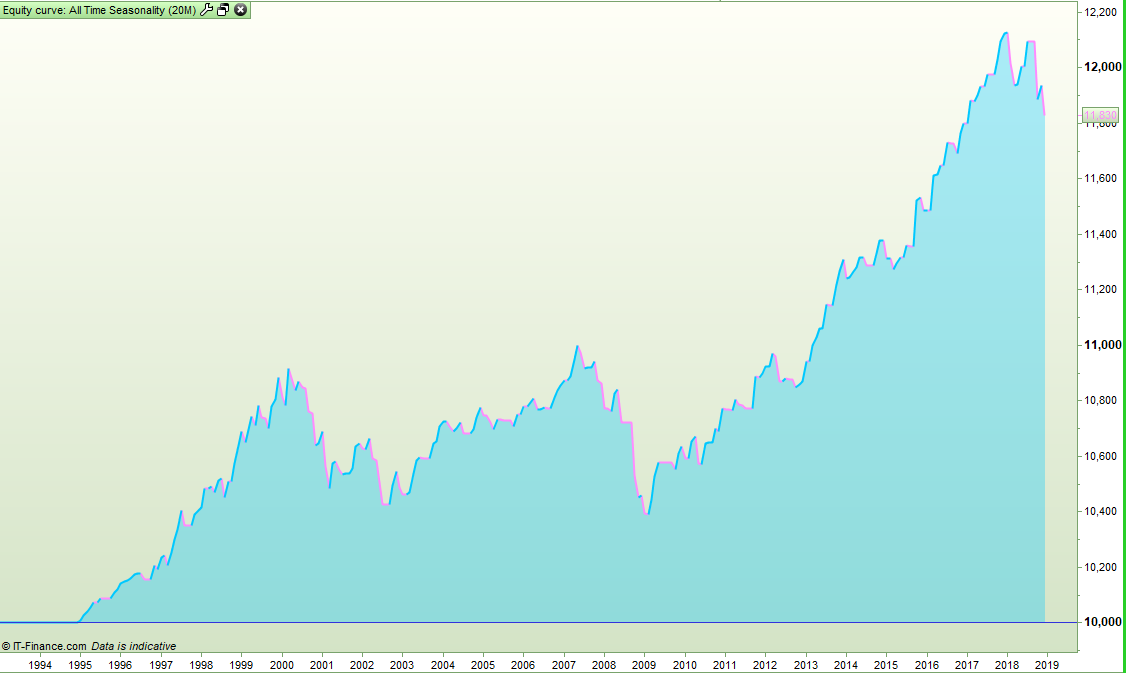
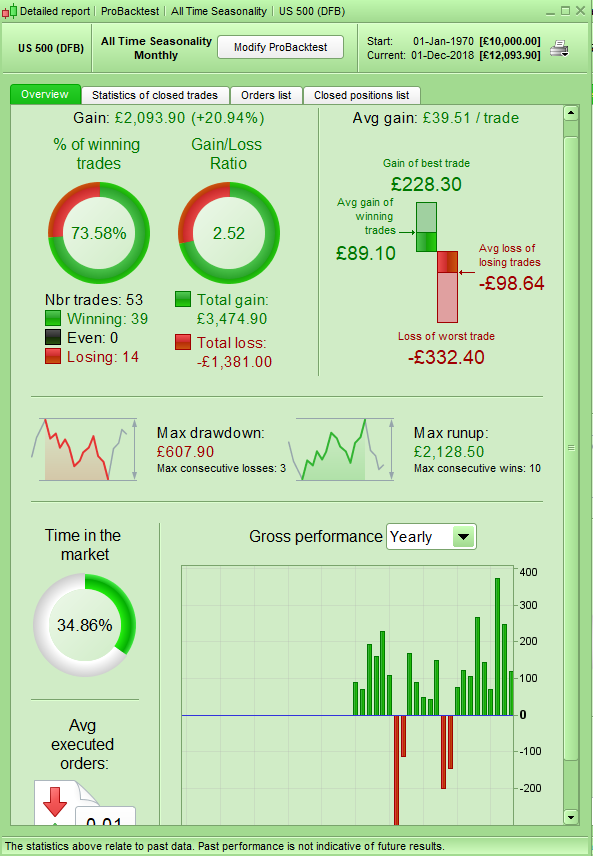
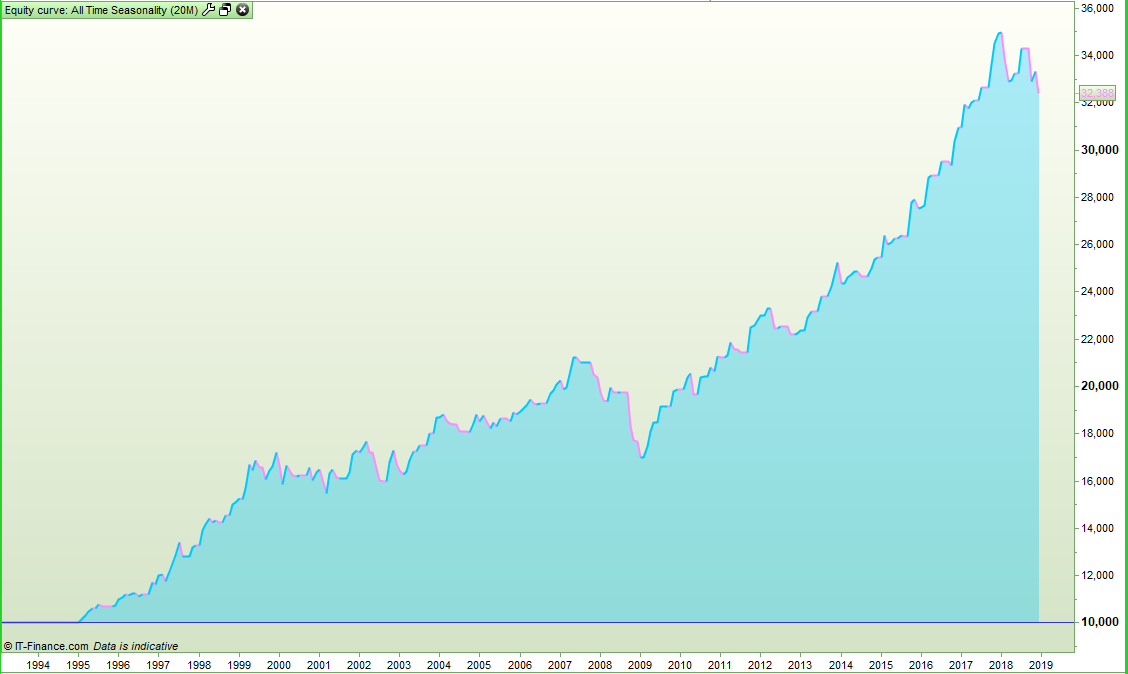
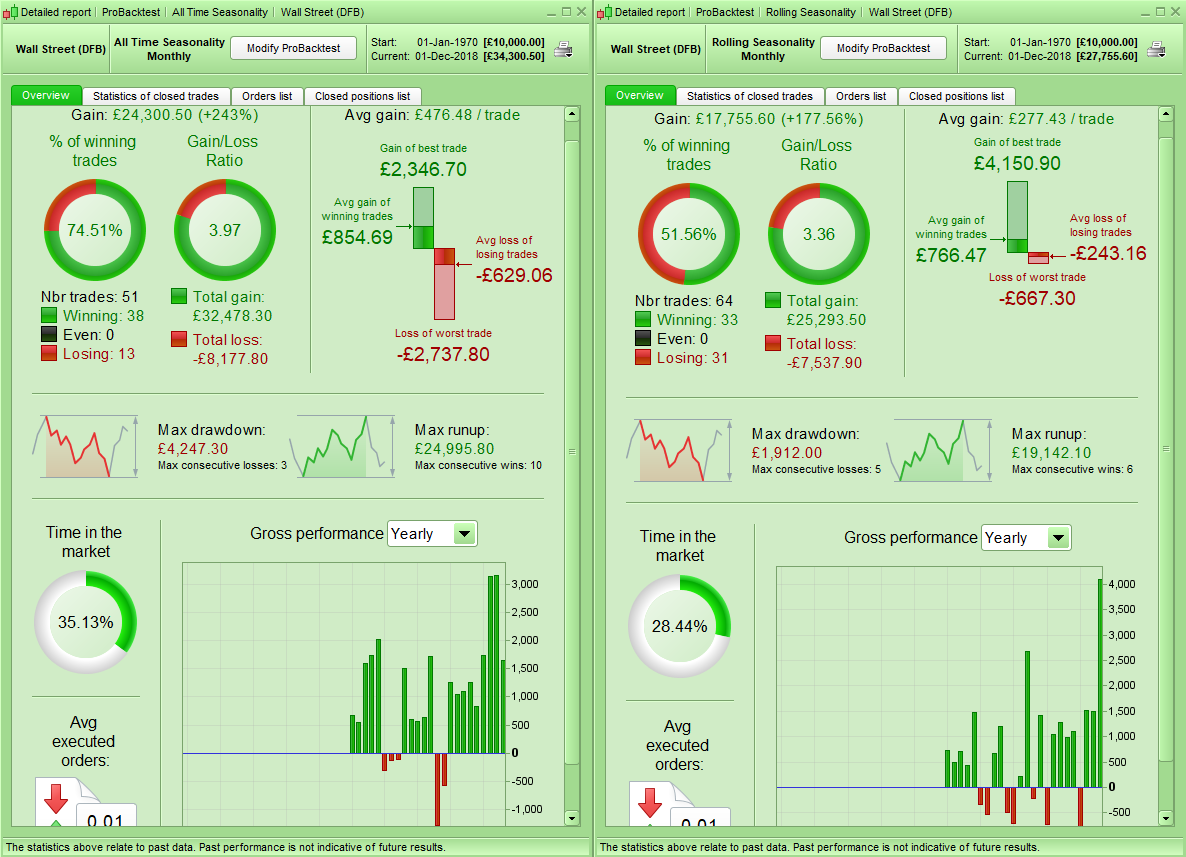
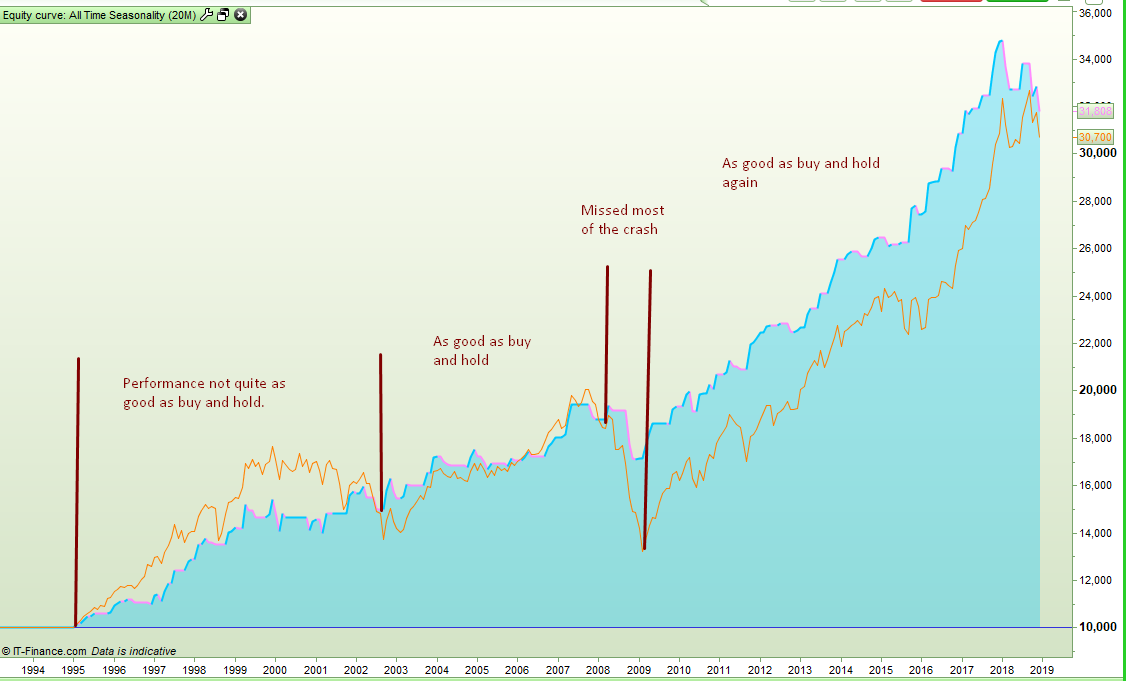
The second strategy stores an all time record of the equity balance for each month of the year and calculates an all time average. It then buys at the open of any month where the equity is above zero and above the all time average. It sells at the open of the following month. I tested all the strategies from the beginning of 1995 to the present day as this allows some time to build up historical data before trading and also the markets changed a lot around this date due to the use of computer trading. Here are the results for the second strategy – spread used is 1.6:
[attachment file=87011]
[attachment file=87017]
The results seem to conclude that all time seasonality is worth using as our win rate has increased from 64% to 74%, our gain/loss ratio from 1.50 to 2.52, our average return per trade from £8.69 to £39.51 and the consecutive losers has dropped from 5 to 3. Our total amount won has increased from £1243 to £2094.
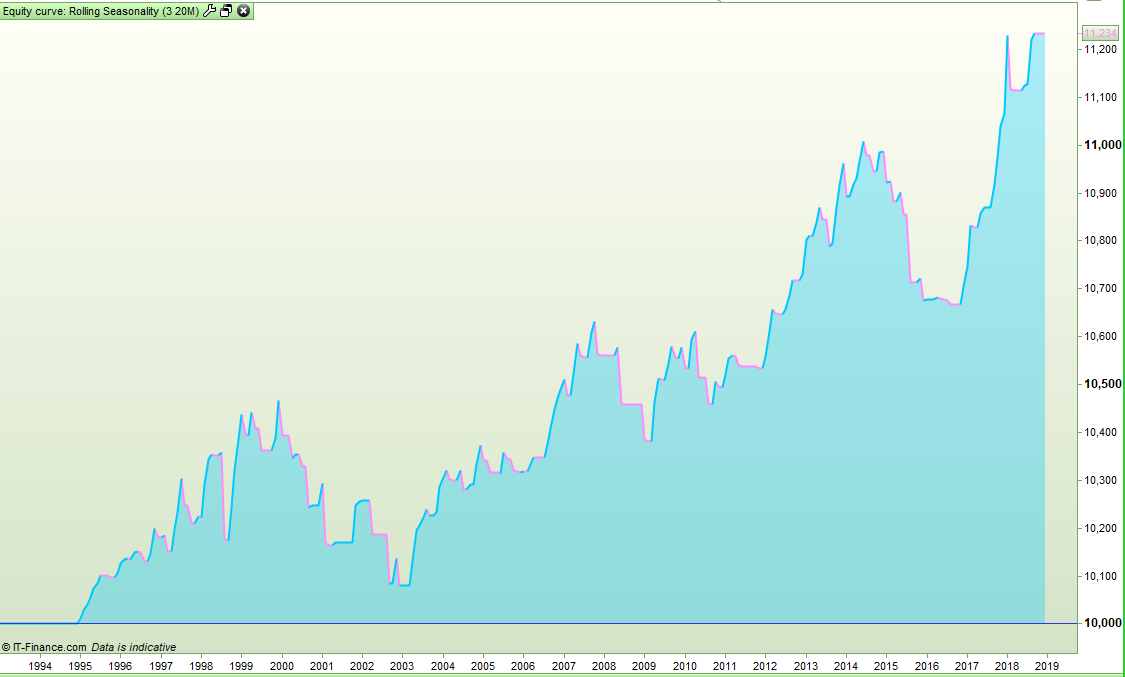
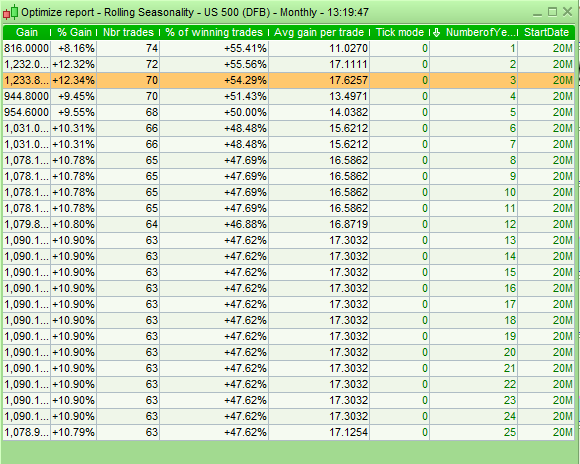
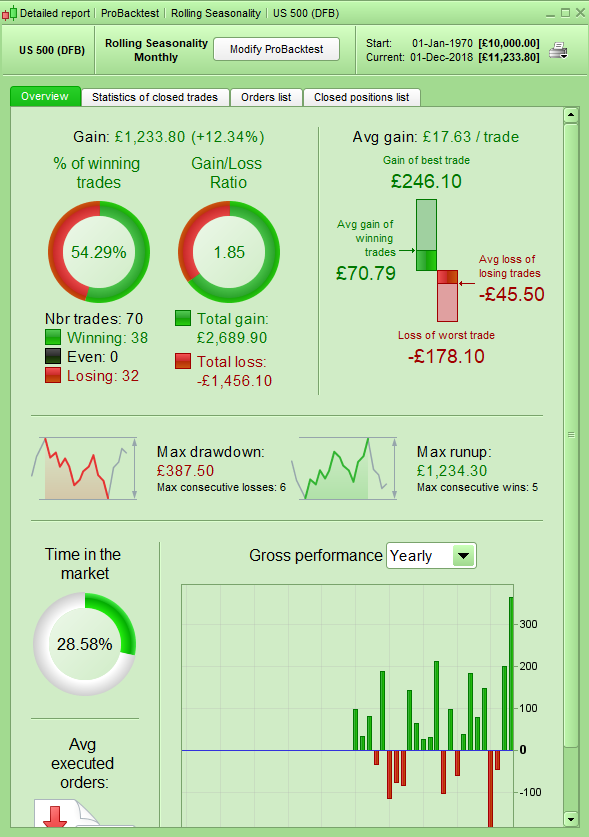
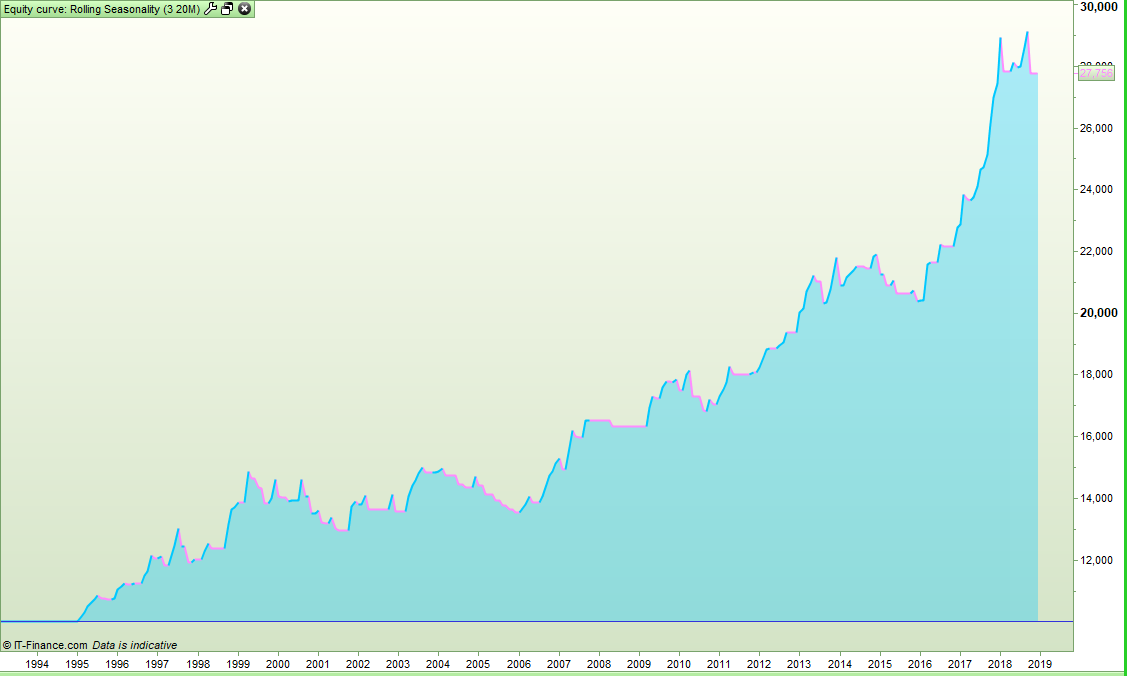
The third strategy only used data from a rolling look back period. So every new month that closes a months data from the start of the look back period is dropped from the calculations and the just closed months data added to the calculations. This was tested with a 1 year to 25 years look back period as anything longer and there is insufficient historical data. Surprisingly a look back period of just 3 years proved to be the most profitable. Here are the results – once again spread is 1.6:
[attachment file=87013]
[attachment file=87018]
I was always lead to believe that a rolling look back period for seasonality was preferable to an all time seasonality but these results seem to say the opposite. The win rate is the lowest of all the tests at just 54%, gain/loss ratio is only just a bit better than the base line at 1.85 compared to 1.50. Average gain per trade is double at 17.63 but still less than half that of the all time seasonality test. The run of losers is the worst at 6. Total equity gain is £10 worse than the baseline. The results for other rolling look back periods are no better:
[attachment file=87015]
So in conclusion it seems that at least on the SP500 using all time seasonality can be advantageous but rolling seasonality not so beneficial. I will test some other markets and post the results if they are interesting.
STOP PRESS! I have just noticed that my base line strategy was only buying every other month so please ignore the results in the above post for the base line. I will re-write the strategy and try to get the base line data to compare with by graphing my own calculations rather than trying to get PRT to do it.
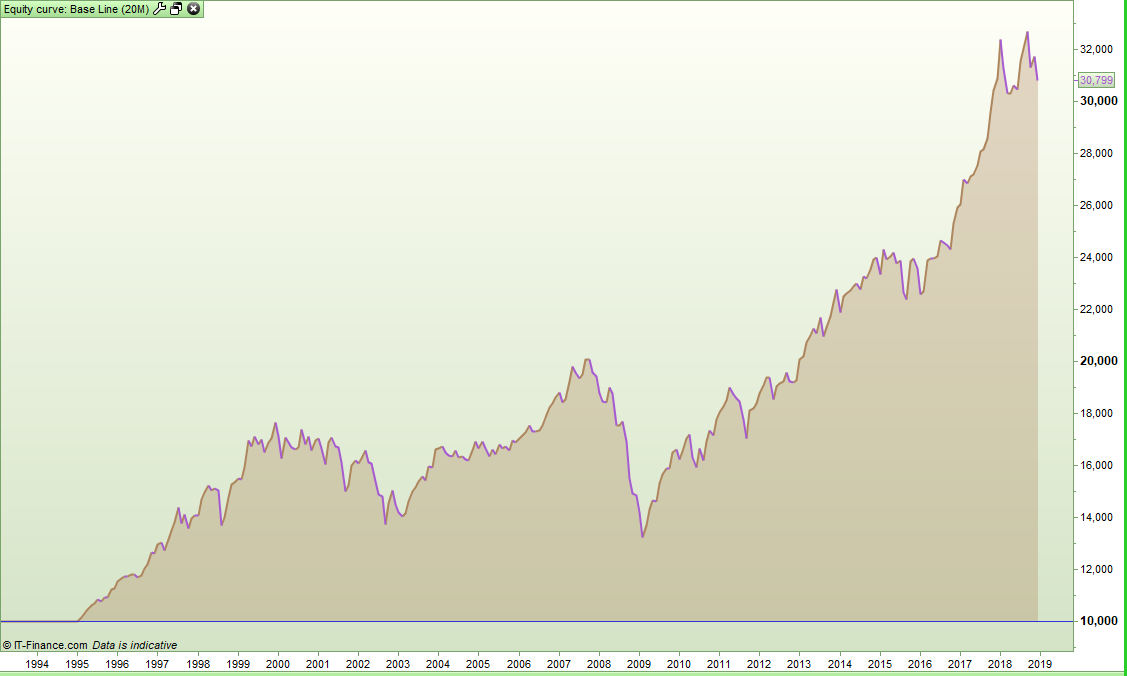
OK – now with the correct baseline figures! Here is the base line equity curve for buy and hold on SP500:
[attachment file=87024]
I can’t show a performance report but my encoded calculations tell me that the equity gain would be £2309.70. The gain/loss ratio is 1.46 and the win rate 64.24%. The average gain per trade would be £8.02. The longest losing run would be 5.
So the all time seasonality strategy still out performs it. The amount won is slightly less at £2093.90 compared to £2309.70 for the base line but from much less time in the market – just 53 months compared to 288. The average gain per trade massively out performs the base line as does the win rate.
Wow you must be firmly anchored in your Winter moorings (with few diversions) to get through all this superb and useful research you are providing us with Vonasi !
Many Thanks
The Dow Jones tests quite well. Here are the three equity curves. Baseline first then all time seasonality and then rolling 3 year period seasonality. A spread of 3.8 on the seasonality tests:
[attachment file=87031]
[attachment file=87032]
[attachment file=87033]
The base line results are:
- Profit: £21839.50
- Number of trades: 288
- Average gain per trade: £75.83
- Win rate: 62.85%
- Gain/loss ratio: 1.51
- Consecutive losers: 6
Here are the results for all time equity and then rolling equity on 3 years:
[attachment file=87034]
Once again all time seasonality comes out well and truly on top – this time in every performance result and much nicer equity curves for both seasonality filters than the base line equity curve. I will go back and double check my coding as these results seem just good enough to be considered maybe too good to be true!
Wow you must be firmly anchored in your Winter moorings
I certainly am – in fact I am high and dry as we have lifted our boat out for the winter.
There is also a direct correlation between the amount of time I spend coding/analysing and whether my girlfriend is in the same country as me or not. At the moment she is not. Once Christmas comes along we will both be off visiting family in Spain and all will go very quiet on the coding and analysis output from me!
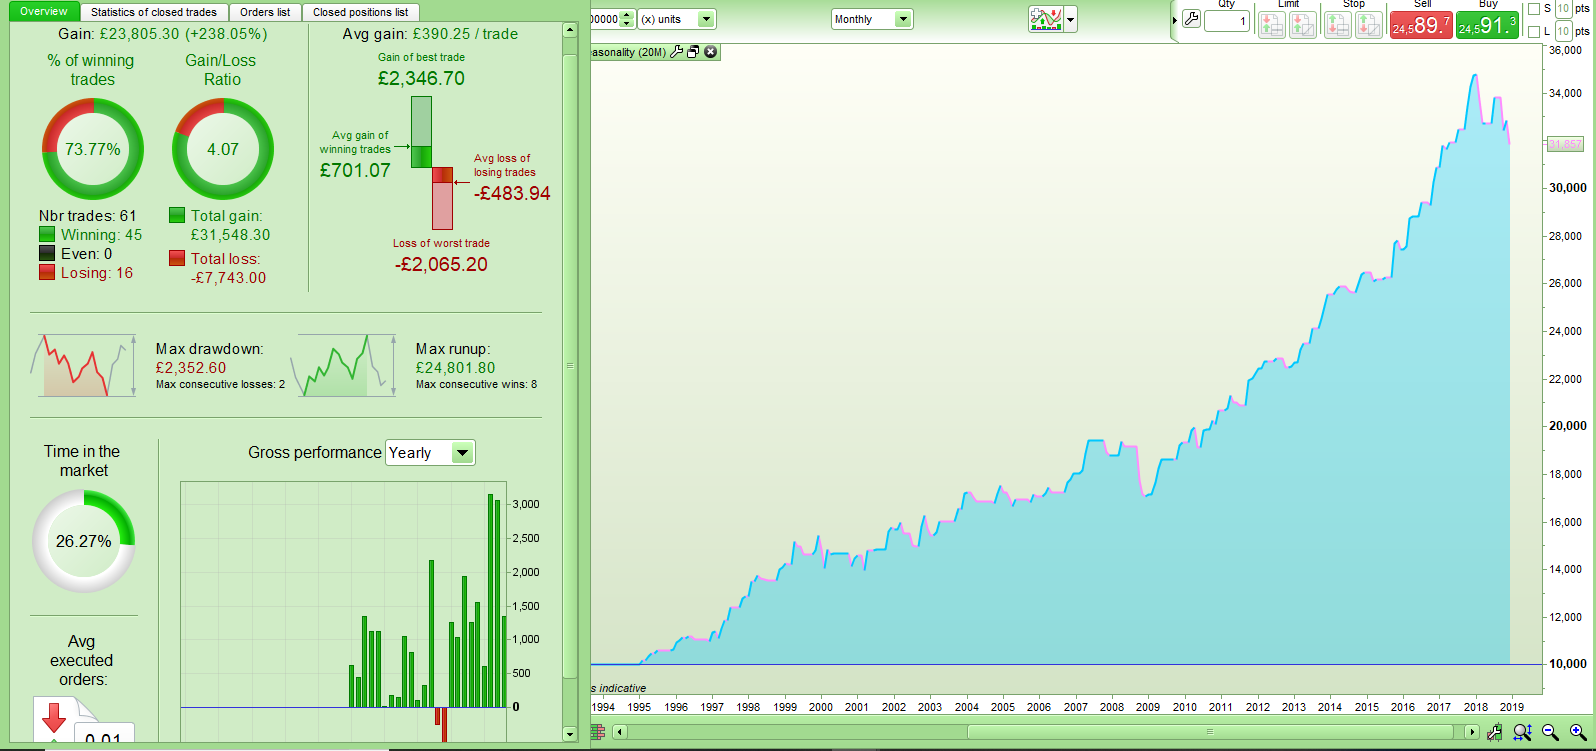
So after my feeling of ‘this seems too good to be true’ I looked a little closer at the all time seasonality strategy and found that I was using an incorrect average. It wasn’t a major coding error but it does effect the results slightly. Here is the now correct results using all time seasonality on the DJI with a 3.8 spread:
[attachment file=87042]
- Overall profit is down a touch at £23805 but still beats the buy and hold of £21839.
- The number of trades is up to 61 now.
- The average gain per trade is down a bit at £390.25 compared to £476.48 but it still massively beats buy and hold at just £75.83.
- The win rate is very similar at 73.77% – so down less than 1%.
- The gain/loss ratio is ever so slightly better at 4.07 to the original 3.97
- The consecutive losers has now dropped to just 2.
I will try to check out other markets and post the results when I have a little more time. Overall it seems that so far on indices all time seasonality can improve your profits with the benefit of less time in the market. I ran a quick test on the EUR/USD and it confirmed that the casino that is forex has absolutely no seasonality what so ever!
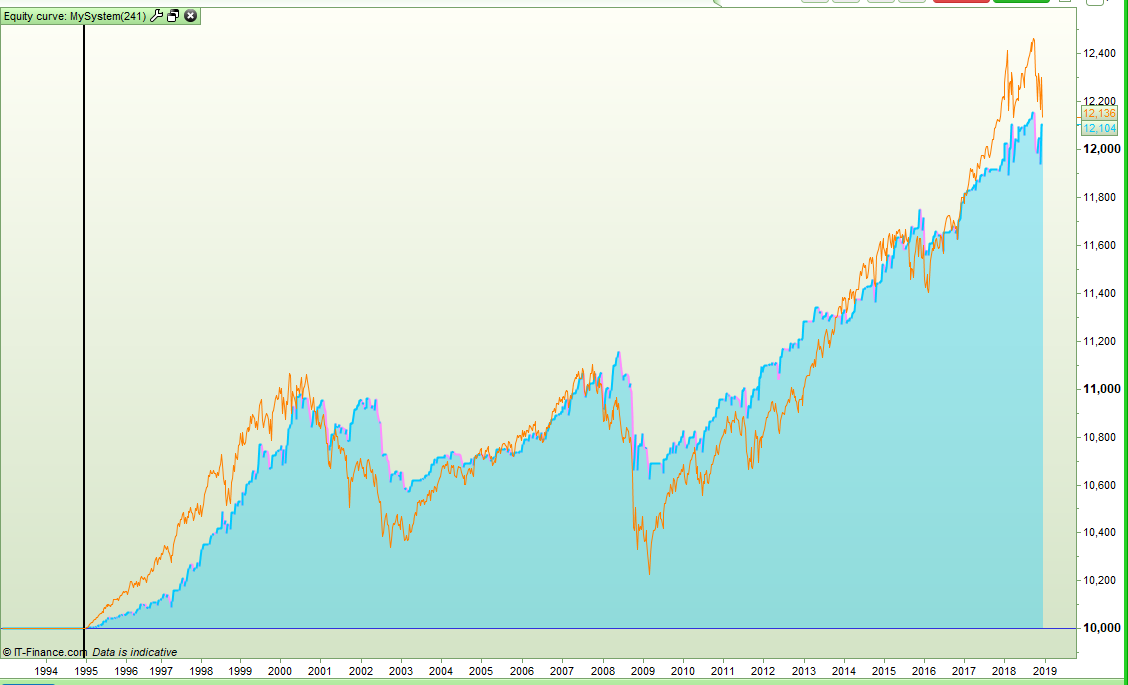
It is quite interesting to compare the DJI all time seasonality equity curve with the buy and hold equity curve overlaid.
[attachment file=87050]
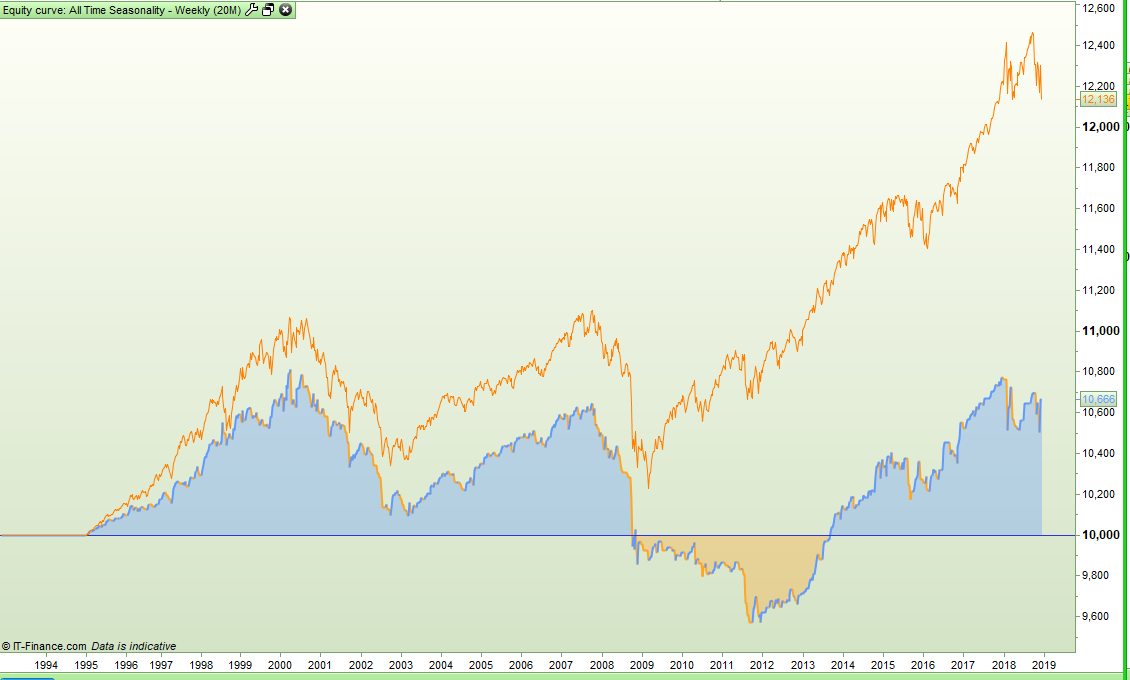
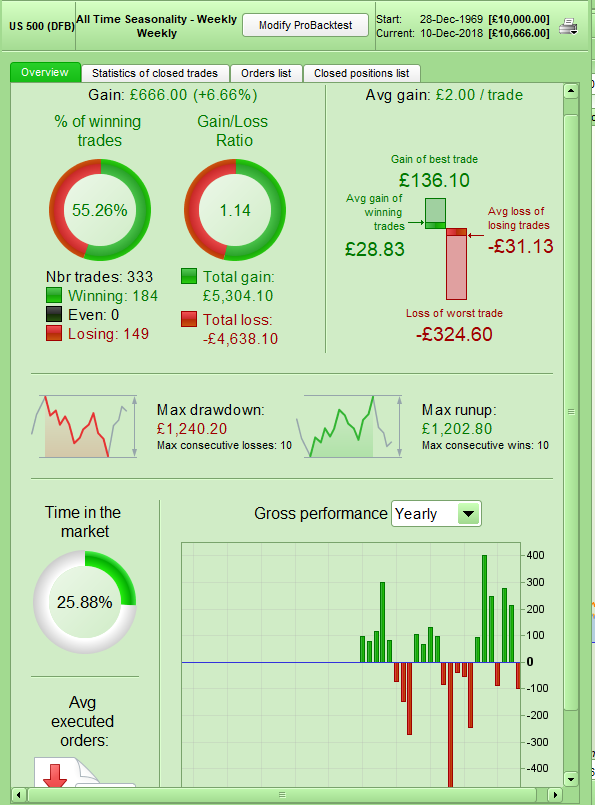
I decided to test seasonality a little further so I converted my all time seasonality strategy to work on weeks instead of months to see if it could improve the results at all. Maybe the second half of October is better than the first half etc. PRT does not return a week value so my week counting started from when a new year value was detected. This means that some years have 52 weeks and some 53 weeks so I eliminated buying after weeks 52 and 53 from the testing. This is the Christmas week so trading is pretty quiet anyway.
Here is the equity curve and results for buying in any week that showed positive equity above the average and above zero in the seasonality calculation (the orange line is buy and hold comparison):
[attachment file=87159]
[attachment file=87160]
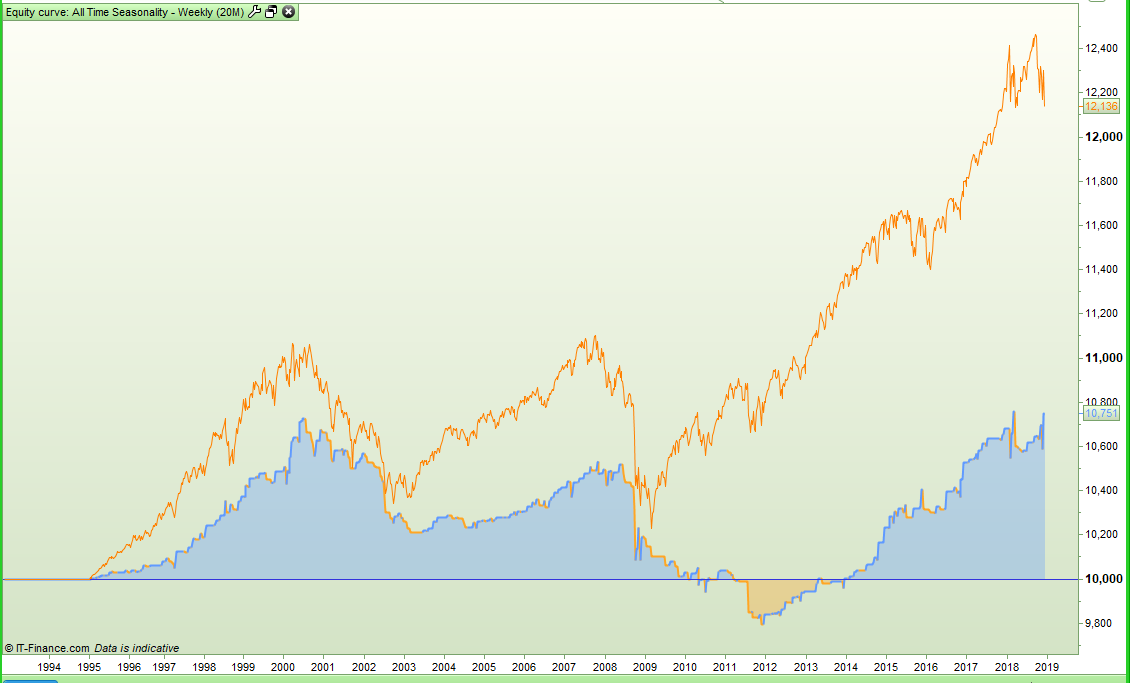
Pretty ugly! So I decided that as the SP500 was a historically good mean reversal index that I would add a filter that only buys following a down week if the seasonality says the next week has been positive:
[attachment file=87161]
Still damned ugly! By comparison here is the equity curve and results if you take the weekly seasonality out of it and just buy every week following a down week and hold for a week:
[attachment file=87162]
So it seems that trying to use seasonality on the SP500 on a weekly time frame isn’t of any benefit at all so that was an awful lot of repetitive coding to tell me what I think I already knew – but you have to physically test these things to quantify and prove or disprove them. Back to monthly seasonality testing for me now.
Hi Vonasi
maybe I’m too intrusive to ask but your experiment is really interesting and you understand your possible denial, is it possible to have the code of these examples?
Thanks
This study was nine months ago and I have to confess that I am not very good at keeping old code. Sometimes I have to search the forums to find something that I have previously coded as I can’t find it on my laptop! I tend to bastardise old codes into new codes and so even if I could find something it is unlikely to be the code that I think it actually is… the name is the same but everything else has changed! Then there is the fact that I have three accounts with strategies and code strewn amongst them and some of them have maxed out on the code allowed so I have deleted old stuff in the desperation to create new stuff!
Sorry but I operate a messy filing system. If I find something in the bottom of a folder I’ll let you know!