ProRealCode - Trading & Coding with ProRealTime™
Hi,
I’m wondering if someone would like to take a look at coding John Ehlers’ recently created/released new indicator called the Deviated Scaled Oscillator with the Fisher Transform for mean reversion swing traders. The oscillator was featured in this October’s Stocks and Commodities Magazine. For a full explanation please see the 5 screenshots I took of the article including the code.
The theory behind the indicator is to remove the fat tails of a distribution to give a more perfect bell shaped Gaussian distribution which is necessary to trade low probability events at the extreme ends of the oscillator. This allows a price series to be placed into a probability distribution so that the probabilities of extreme moves corresponds to a normal standard deviation bell curve (distribution) which allows the prediction, in percentage terms, for the odds of a +2/-2 standard deviation move away from the mean price (centre of the bell curve).
I also found the code today on https://www.tradingview.com/script/DdLQBt87-Ehlers-Fisherized-Deviation-Scaled-Oscillator/
The code is as follows:
//@version=3
// Copyright (c) 2018-present, Alex Orekhov (everget)
// Ehlers Fisherized Deviation-Scaled Oscillator script may be freely distributed under the MIT license.
study("Ehlers Fisherized Deviation-Scaled Oscillator", shorttitle="EFDSO")
length = input(title="Length", type=integer, defval=40, minval=1)
ssfLength = input(title="Super Smoother Filter Length", type=integer, defval=20, minval=1)
numberOfPoles = input(title="Number of Poles", type=integer, defval=2, options=[2, 3])
overboughtLevel = input(title="Overbought Level", type=float, defval=2, step=0.1)
oversoldLevel = input(title="Oversold Level", type=float, defval=-2, step=0.1)
src = input(title="Source", type=source, defval=close)
PI = 2 * asin(1)
twoPoleSuperSmootherFilter(src, length) =>
arg = sqrt(2) * PI / length
a1 = exp(-arg)
b1 = 2 * a1 * cos(arg)
c2 = b1
c3 = -pow(a1, 2)
c1 = 1 - c2 - c3
ssf = 0.0
ssf := c1 * src + c2 * nz(ssf[1]) + c3 * nz(ssf[2])
threePoleSuperSmootherFilter(src, length) =>
arg = PI / length
a1 = exp(-arg)
b1 = 2 * a1 * cos(1.738 * arg)
c1 = pow(a1, 2)
coef2 = b1 + c1
coef3 = -(c1 + b1 * c1)
coef4 = pow(c1, 2)
coef1 = 1 - coef2 - coef3 - coef4
ssf = 0.0
ssf := coef1 * src + coef2 * nz(ssf[1]) + coef3 * nz(ssf[2]) + coef4 * nz(ssf[3])
zeros = src - nz(src[2])
// Ehlers Super Smoother Filter
essf = numberOfPoles == 2
? twoPoleSuperSmootherFilter((zeros + zeros[1]) / 2, ssfLength)
: threePoleSuperSmootherFilter((zeros + zeros[1]) / 2, ssfLength)
// Rescale filter in terms of Standard Deviations
scaledFilter = 0.0
scaledFilter := stdev(essf, length) != 0
? essf / stdev(essf, length)
: nz(scaledFilter[1])
// Apply Fisher Transform to establish real Gaussian Probability Distribution
efdso = 0.0
efdso := abs(scaledFilter) < 2
? 0.5 * log((1 + scaledFilter / 2) / (1 - scaledFilter / 2))
: nz(efdso[1])
efdsoColor = efdso > overboughtLevel ? #0ebb23 : efdso < oversoldLevel ? #cc0000 : #674ea7
plot(efdso, title="EFDSO", linewidth=2, color=efdsoColor, transp=0)
hline(overboughtLevel, title="Overbought Level", linestyle=dotted, color=#e69138)
hline(0, title="Zero Level", linestyle=dotted, color=#989898)
hline(oversoldLevel, title="Oversold Level", linestyle=dotted, color=#e69138)
Looks interesting and the article is definitely worth the read. The last two article images with the code will be posted separately.
This short article gives a good overview of the Fisher Transform Oscillator:
http://www.trade-robots.com/blog/the-fisher-transform-oscillator
(hopefully the last 2 images from the article “Probability – Probably a Good Thing to Know, ” with the code, will upload on this second attempt)
I’ve lifted John Ehler’s Fisherized Deviation-Scaled Oscillator code from the last image above from October’s Stocks and Commodities Magazine and “translated” it into PRT although it’s non functioning at the moment due to my lack of coding skills. It’d be great if anyone can take a look at it and get it to work and explain what I missed (I wondered about the arrays at the top of the magazine article code)?
Cheers
Bard
Period = 40
If Barindex=1 then
// Super Smoother Filter
a1= Exp(-1.414 * 3.14159 / (0.5*Period))
b1= 2*a1 * Cos(1.414*180 / (0.5*Period))
c2= b1
c3= -a1 * a1
c1= 1 - c2 - c3
Endif
// Produce nominal zero mean with zeros in the transfer response at DC & Nyquist with no spectral distortion
// Nominally whitens the spectrum because 6db per octave rolloff
Zeros= Close-Close[2]
// Super Smoother Filter
Filt= c1*(Zeros+Zeros[1])/2 + c2*Filt[1] + c3*Filt[2]
// Compute Standard Deviation
RMS= 0 //Root Mean Sqr
For Count=0 to Period-1
RMS= RMS + Filt[Count]*Filt[Count]
Next
RMS=SQRT(RMS/Period)
// Rescale Filter in terms of Standard Deviations
If RMS<>0 Then ScaledFilt= Filt/RMS
// Apply Fisher Transform to Establish Real Gaussian Prob Dist’n.
If Abs(ScaledFilt) < 2 Then FisherFilt= 0.5*Log((1 + ScaledFilt/2) / (1-ScaledFilt/2))
Return FisherFilt coloured (66,66,255) as “Fisher Filter", 0 style(dottedline) as "0"
You were not too far to make it works! 🙂
I think I get it sorted from your code:
Period = 40
If Barindex>Period then
// Super Smoother Filter
a1= Exp(-1.414 * 3.14159 / (0.5*Period))
b1= 2*a1 * Cos(1.414*180 / (0.5*Period))
c2= b1
c3= -a1 * a1
c1= 1 - c2 - c3
// Produce nominal zero mean with zeros in the transfer response at DC & Nyquist with no spectral distortion
// Nominally whitens the spectrum because 6db per octave rolloff
Zeros= Close-Close[2]
// Super Smoother Filter
Filt= c1*(Zeros+Zeros[1])/2 + c2*Filt[1] + c3*Filt[2]
// Compute Standard Deviation
RMS= 0 //Root Mean Sqr
For Count=0 to Period-1
RMS= RMS + Filt[Count]*Filt[Count]
Next
RMS=SQRT(RMS/Period)
// Rescale Filter in terms of Standard Deviations
If RMS<>0 Then
ScaledFilt= Filt/RMS
endif
// Apply Fisher Transform to Establish Real Gaussian Prob Dist’n.
If Abs(ScaledFilt) < 2 Then
FisherFilt= 0.5*Log((1 + ScaledFilt/2) / (1-ScaledFilt/2))
Endif
endif
Return FisherFilt coloured (66,66,255) as "Fisher Filter", 0 style(dottedline) as "0"
Great! Nice one @nicolas, I bolted different parts of your John Ehler’s indicator codes together. 😄
I’m wondering why is the barindex “greater” than 40? I thought the Super Smoother Filter was being applied to data under 40 periods not over 40 periods?
And Ehler’s wrote “endif” where I placed it (on line 10), yet by moving that first “endif” to the very end of the calculations it now uses all the different components of the indicator to give that final output of FisherFilt,… so why is Ehler’s code not written with the “endif” moved to the very bottom?
Also is there a way of normalising the output to only values between -3 and +3 std deviations?
Cheers
Bard
I did not confirm that the code you wrote is the same as the original. I just solved the issue of why it was not displaying anything. About the barindex>period, it is necessary because otherwise the platform will not calculate it. We obviously need to have read at least more than the desired period to calculate it.
Normalization is an easy process, I’m sure you’ll be able to make it 🙂
Not too shabby results either, no optimisation, just bought on a crossover of -1 std deviation (and a cross under of 1 std dev to short it) and used the zero line as an exit.
I then stuck it on a 2 year test on mean reverting currencies from Jan 2016 to Dec 2017 Daily:
GBP/USD, EUR/HUF, GBP/EUR, & USD/CHF. (The USD/JPY had a 105% return but a 46% Drawdown). Pls See Screens.
Obviously it can get you in on the wrong side of a trend but I don’t know if I’d ever be comfortable leaving an automated system on “autopilot!”
Dev-Osc-Fisher-Transf-GBPUSD-Daily-15.8k58win75gainloss9.99DDown26.9-Jan16-Dec17.png
Dev-Osc-Fisher-Transf-EURHUF-Daily-31.6k216win68gainloss3.01DDown27.7-Jan16-Dec17.png
Dev-Osc-Fisher-Transf-GBPEUR-Daily-27.6k176win65gainloss2.26DDown36.1-Jan16-Dec17.png
Dev-Osc-Fisher-Transf-USDCHF-Daily-28.-The-k187win77gainloss7.68DDown16.6-Jan16-Dec17.png
I appreciate the “vote of confidence” lol, I tried using Ehler’s code from the third and last screenshot in this RocketRSI post: #6978 from https://www.prorealcode.com/topic/john-ehlers-rocket-rsi/
but it’d didn’t accept the “Then FisherFilt” part, particularly: FisherFilt was highlighted in red in the indicator code window:
If FisherFilt > 0.999 Then FisherFilt = 0.999
Endif
If FisherFilt < -0.999 Then FisherFilt = -0.999
Endif
I also saw @Despairs (Rocket RSI) version of code using “closes up” and “closes down:”
//Accumulate "Closes Up" and "Closes Down"
CU = 0
CD = 0
for count = 0 to Period -1 do
if Filt[count] - Filt[count + 1] > 0 then
CU = CU + Filt[count] - Filt[count + 1]
endif
if Filt[count] - Filt[count + 1] < 0 then
CD = CD + Filt[count + 1] - Filt[count]
endif
next
if CU + CD <> 0 then
FisherFilt = ( CU - CD ) / ( CU + CD )
endif
FisherFilt = min(max(FisherFilt,-0.999),0.999)
But that didn’t work either as I saw some std deviations of -3.5 and +4.0.
Conceptually the idea is to take those FisherFilt output results and normalise them to the new range parameters. My first thought though is if 99.7% of values lie between -3 and +3 std deviations then how would you express 4.0, or even 6.0, std deviation moves on an oscillators right hand range scale?
Actually I just refreshed my memory and looked this up: A 3-sigma event occurs 99.73 percent of the time under a normal distribution bell curve, a 4-sigma event: 99.999968 percent of the time and a 5-sigma outlier: 99.9999997 percent. (0.0000003 percent of the time). I’d like an oscillator scale with a 6 std deviation scale please and — assuming it’s not the end of the world — I’d take a largish bet on a reversion to the mean for that event. Double lol… Wait why am I laughing? I’ve seen a Kase 7.5 Dev Stop exceeded a few times! 😄
https://www.sixsigma-institute.org/Six_Sigma_DMAIC_Process_Measure_Phase_Process_Capability.php
You can try this below version, where +100 or -100 state for 3 standard deviations:
Period = 40
If Barindex>Period then
// Super Smoother Filter
a1= Exp(-1.414 * 3.14159 / (0.5*Period))
b1= 2*a1 * Cos(1.414*180 / (0.5*Period))
c2= b1
c3= -a1 * a1
c1= 1 - c2 - c3
// Produce nominal zero mean with zeros in the transfer response at DC & Nyquist with no spectral distortion
// Nominally whitens the spectrum because 6db per octave rolloff
Zeros= Close-Close[2]
// Super Smoother Filter
Filt= c1*(Zeros+Zeros[1])/2 + c2*Filt[1] + c3*Filt[2]
// Compute Standard Deviation
RMS= 0 //Root Mean Sqr
For Count=0 to Period-1
RMS= RMS + Filt[Count]*Filt[Count]
Next
RMS=SQRT(RMS/Period)
// Rescale Filter in terms of Standard Deviations
If RMS<>0 Then
ScaledFilt= Filt/RMS
endif
// Apply Fisher Transform to Establish Real Gaussian Prob Dist’n.
If Abs(ScaledFilt) < 2 Then
FisherFilt= 0.5*Log((1 + ScaledFilt/2) / (1-ScaledFilt/2))
Endif
result = (fisherfilt*100)/(rms*3)
endif
Return result coloured (66,66,255) as "Fisher Filter", 0 style(dottedline) as "0"
Thanks @nicolas, I see now that rms = the std deviation when there is a zero mean and the math looks right but the oscillator scale is not how I was expecting it? Pls see screens of the original code and the 3 std deviation code, cheers.
My code has a scale of +100/-100, so you did something wrong somewhere with your copy/paste.
Thanks for the screenshot, if it’s bounded by +/-100 why do the results go as high as 200, (it’s a 100% (covering 3 std devs)?
I used the copy icon in the top right here on PRC and pasted as normal into PRT, yet I get this on the Swissy:
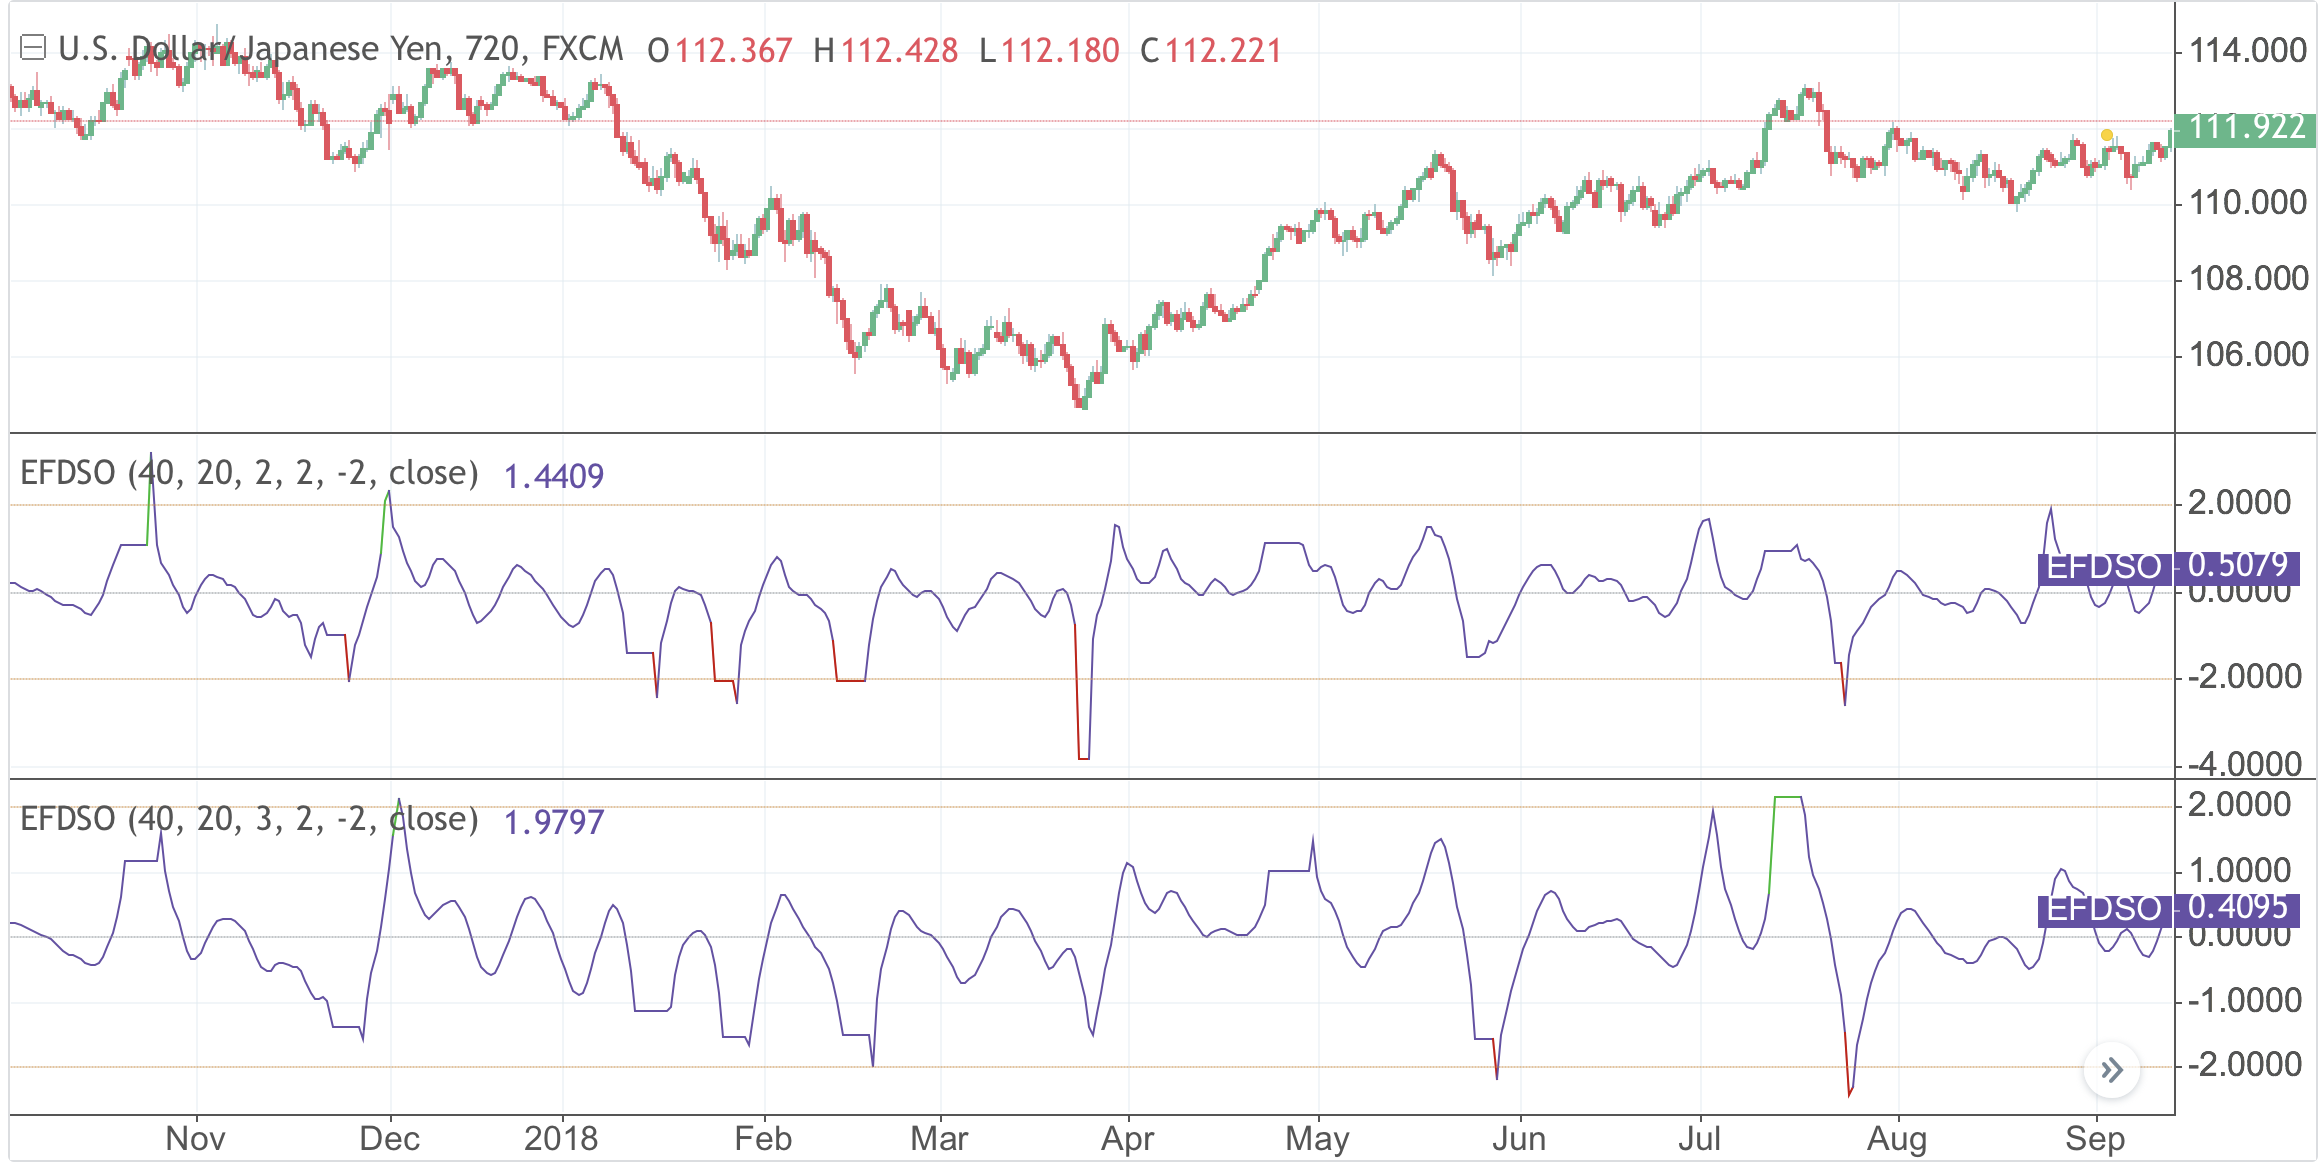
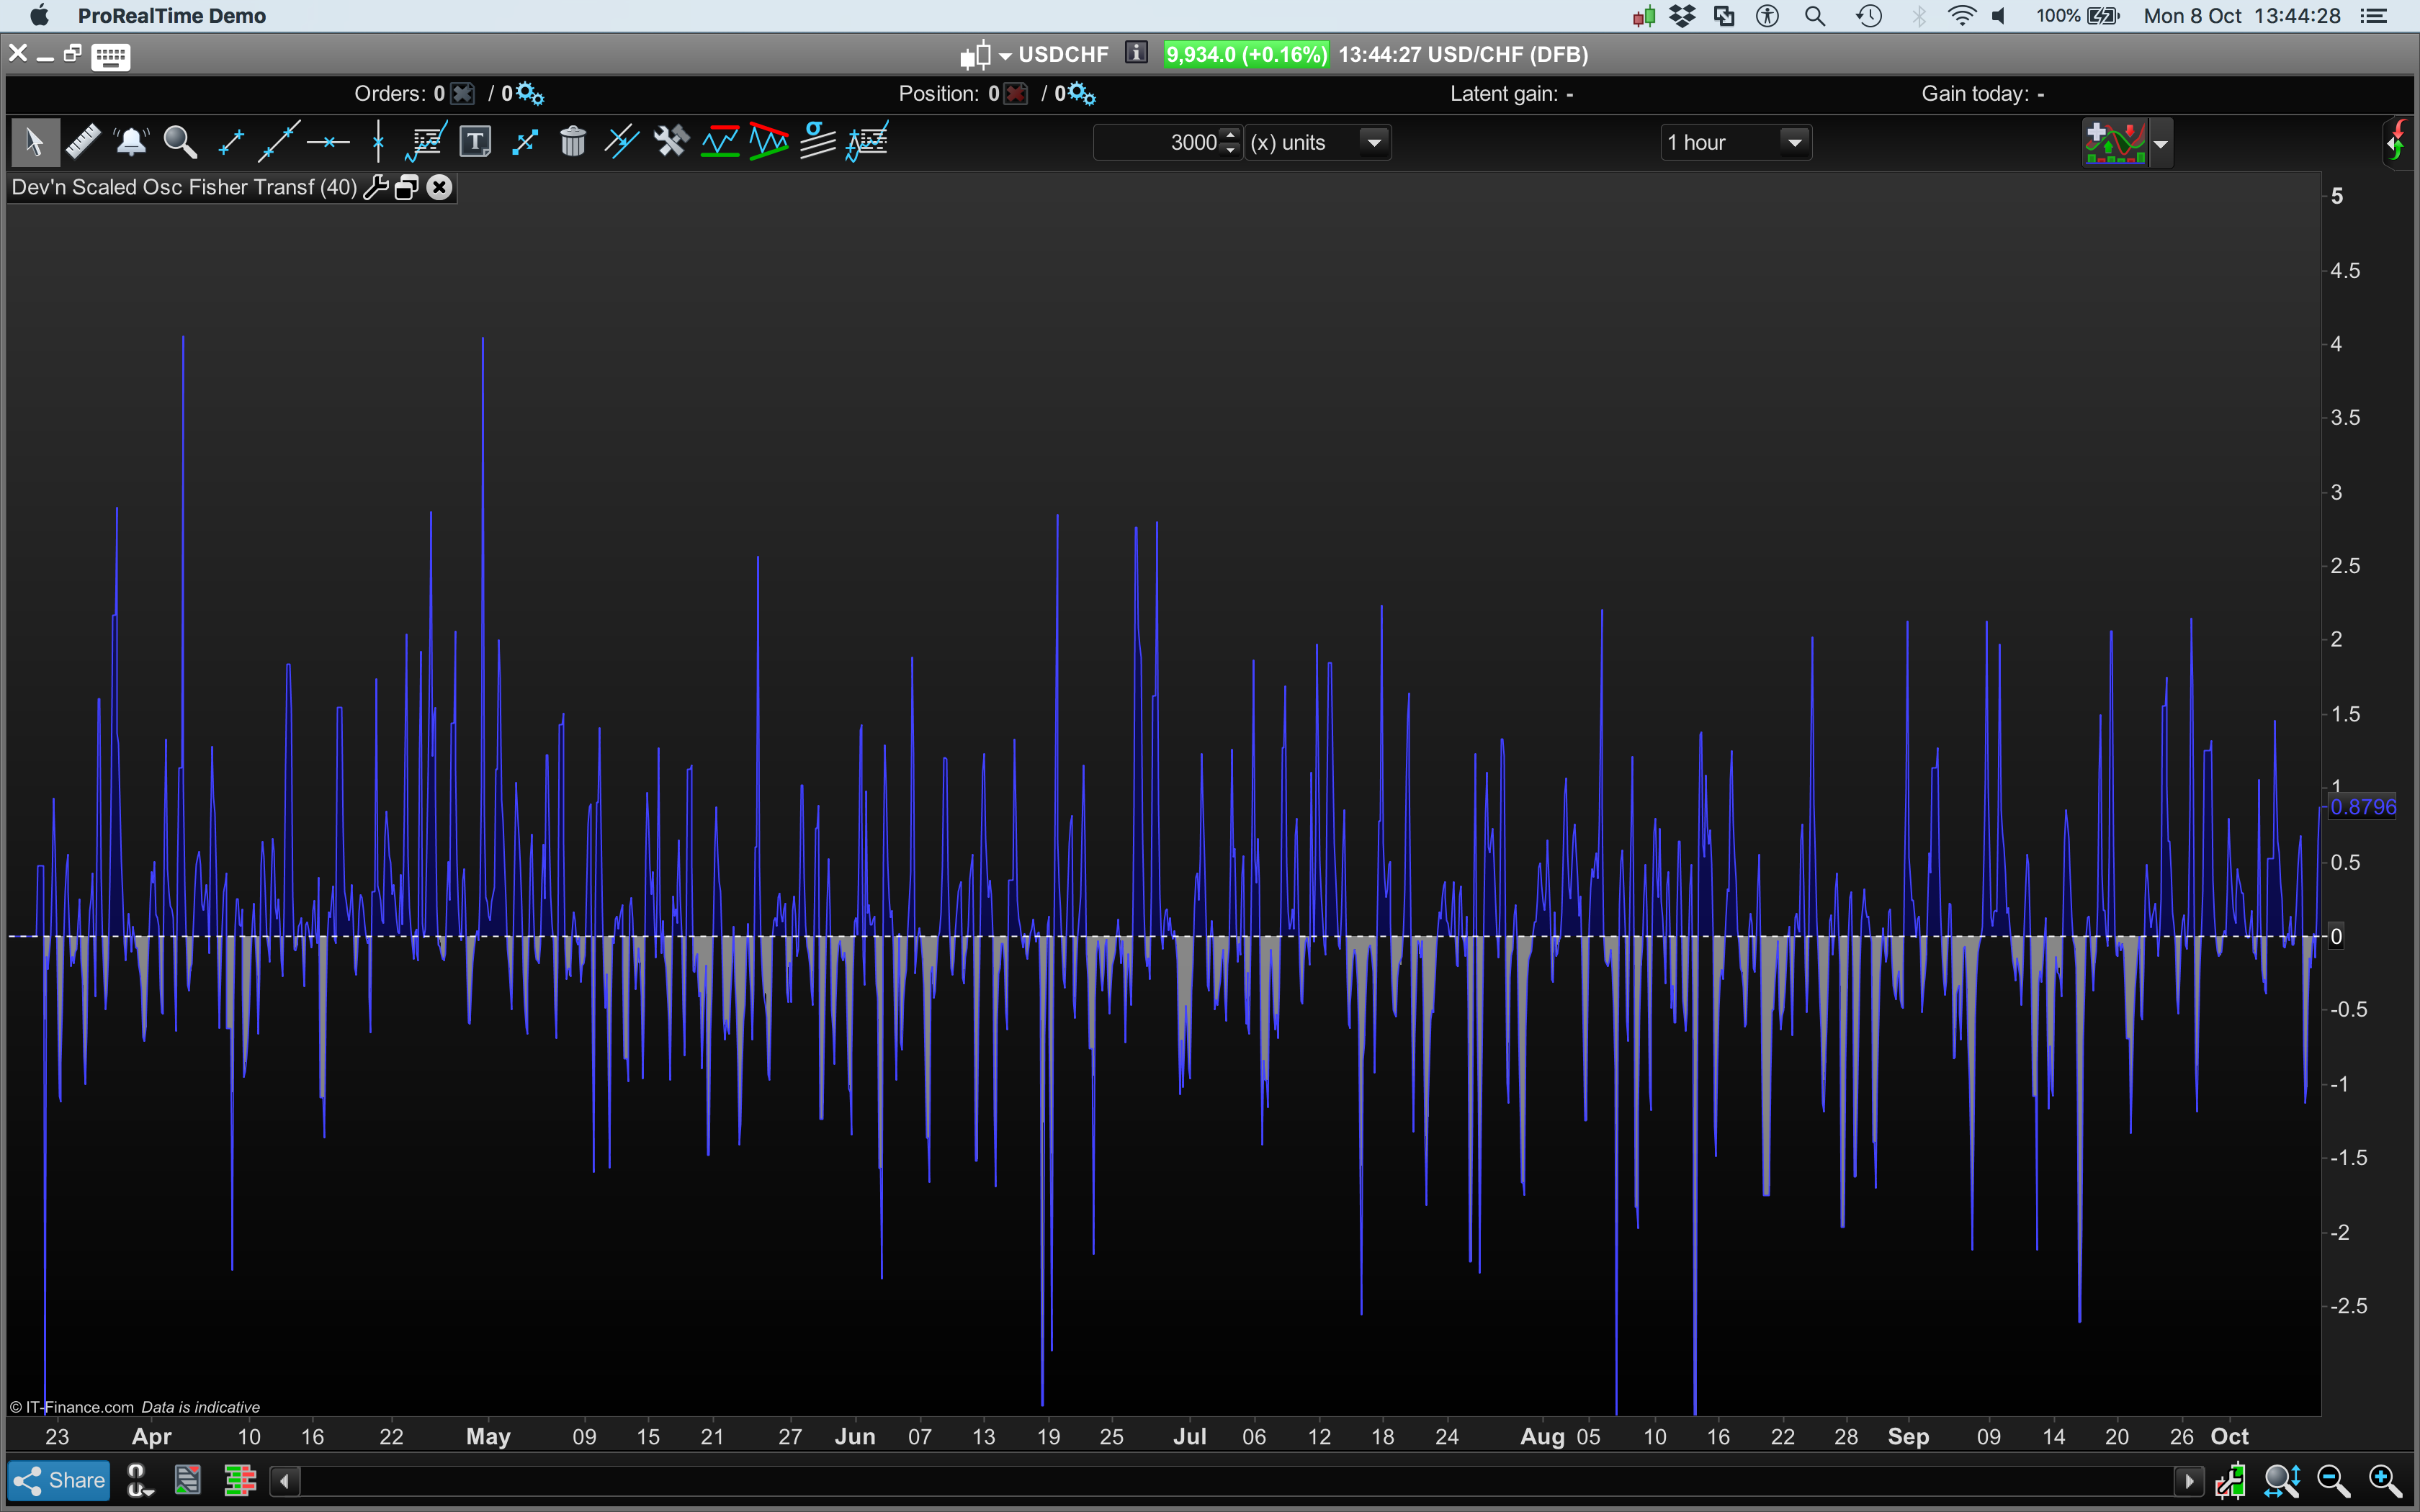
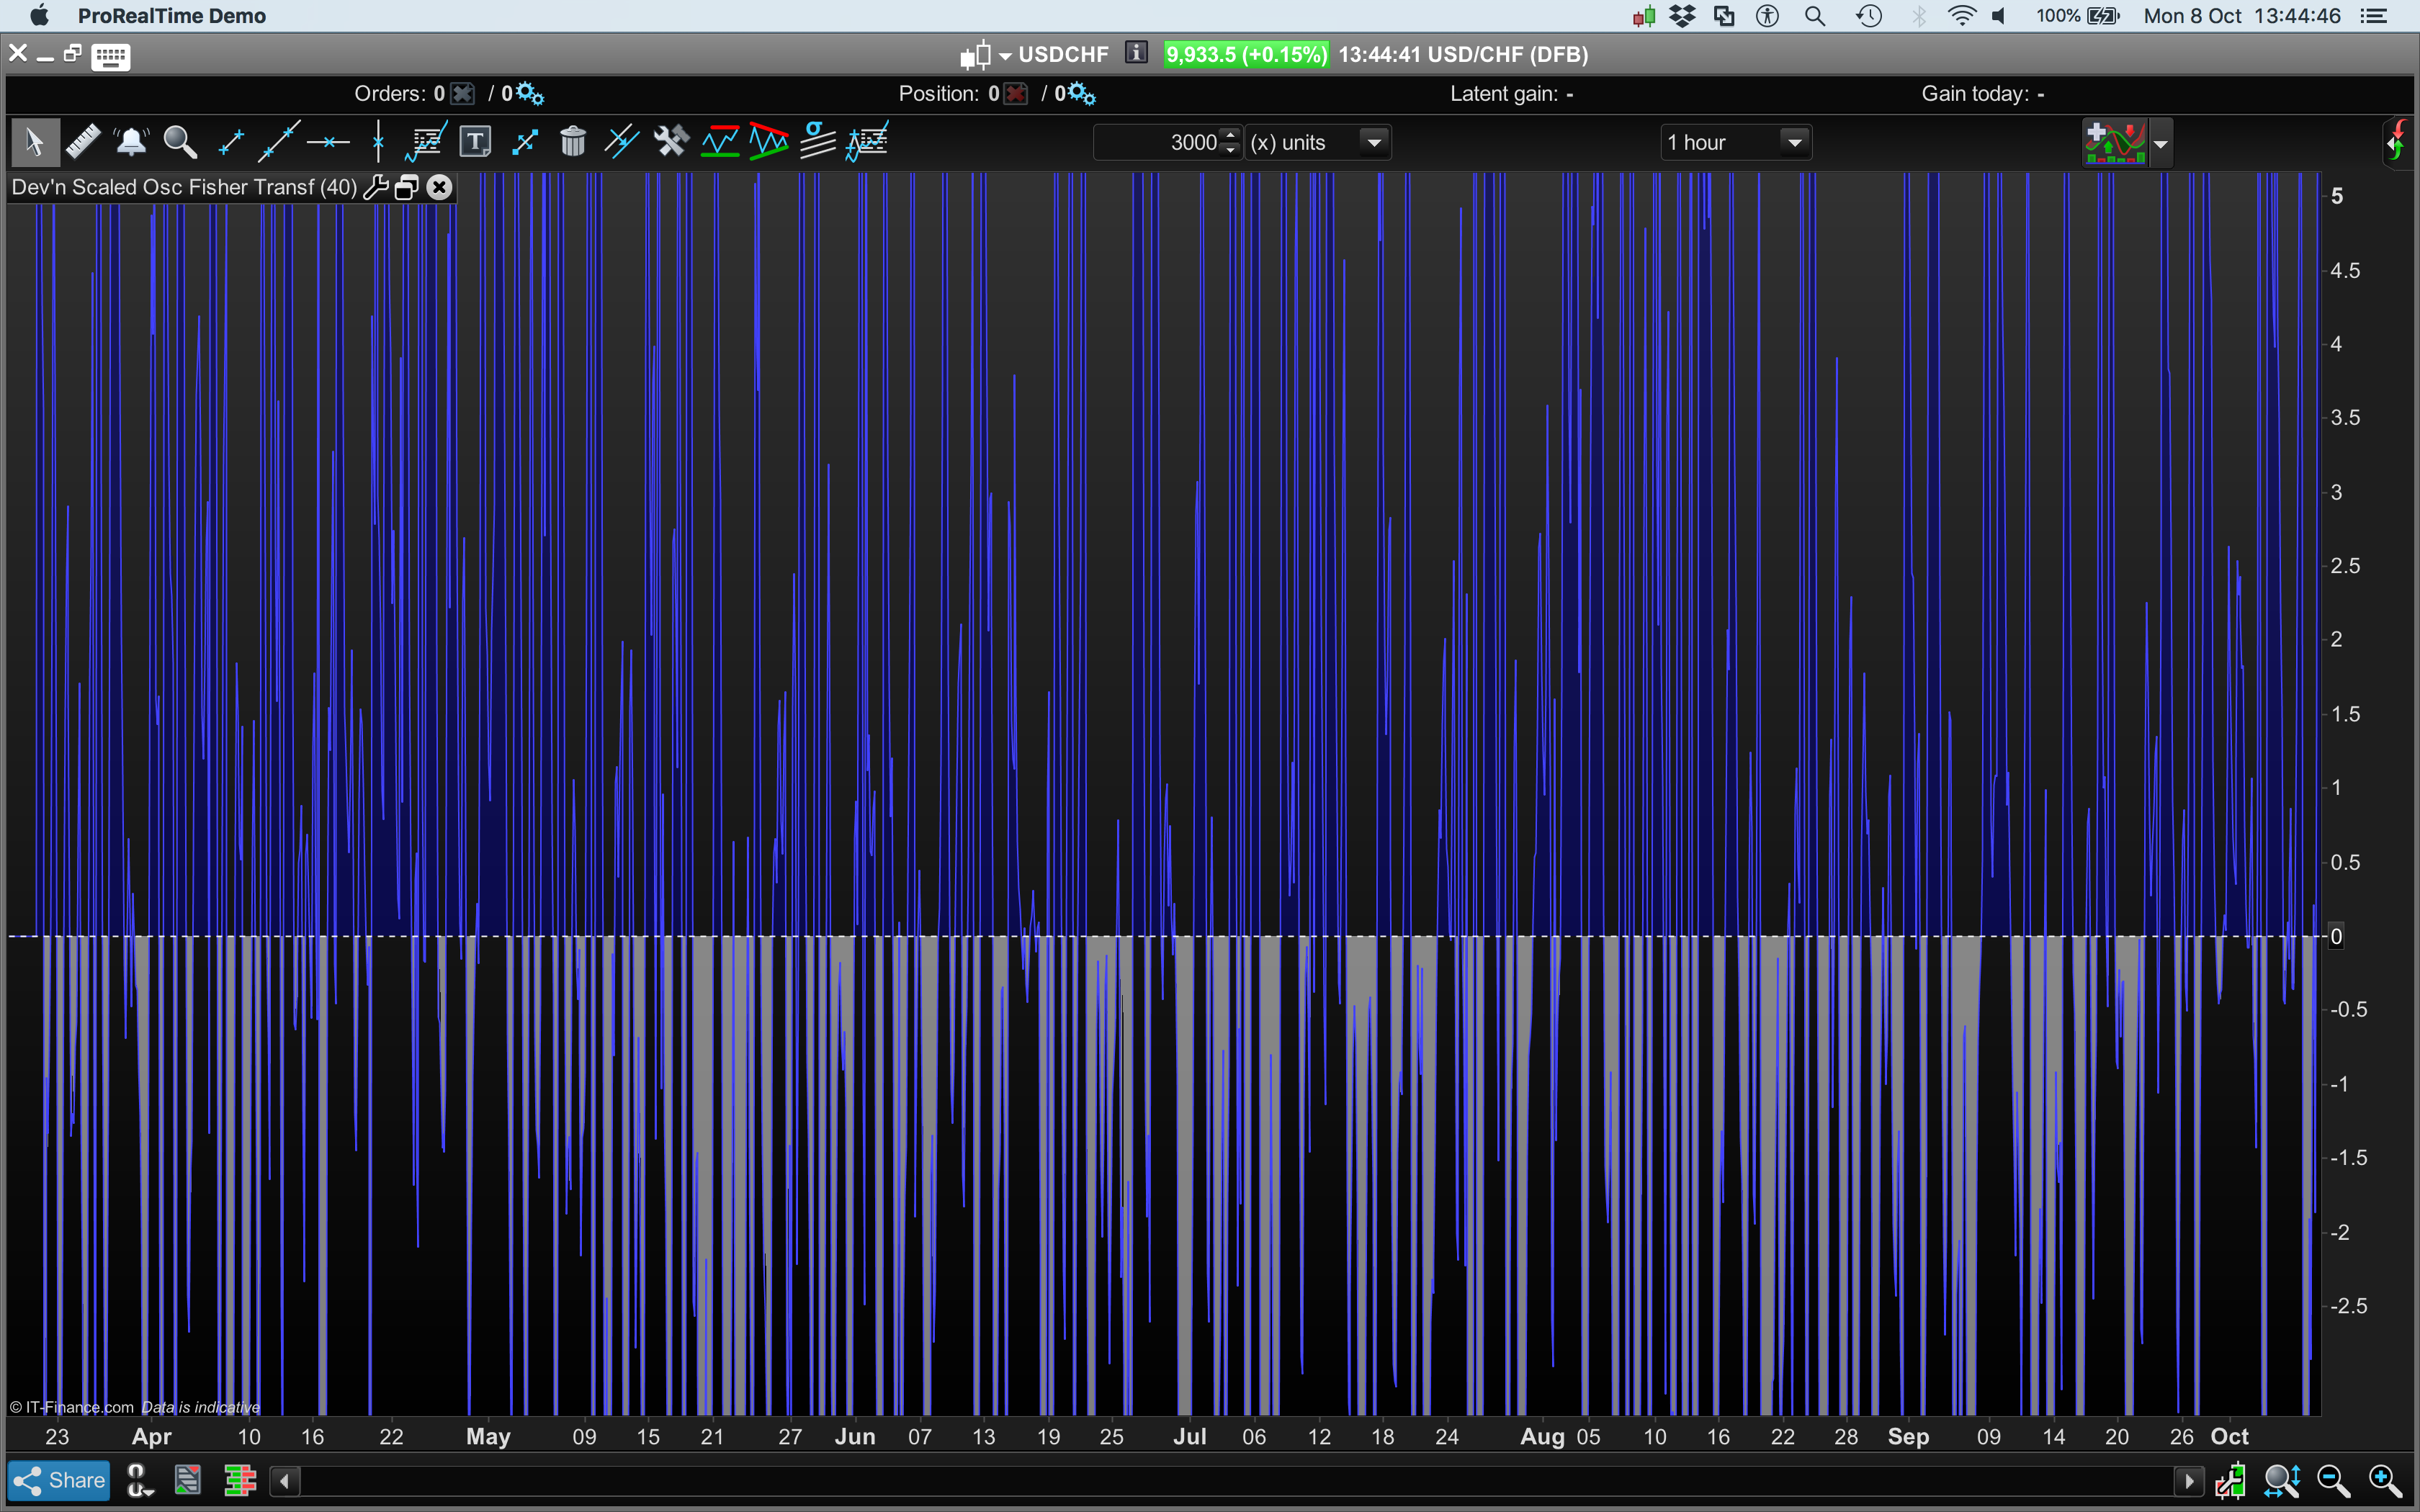
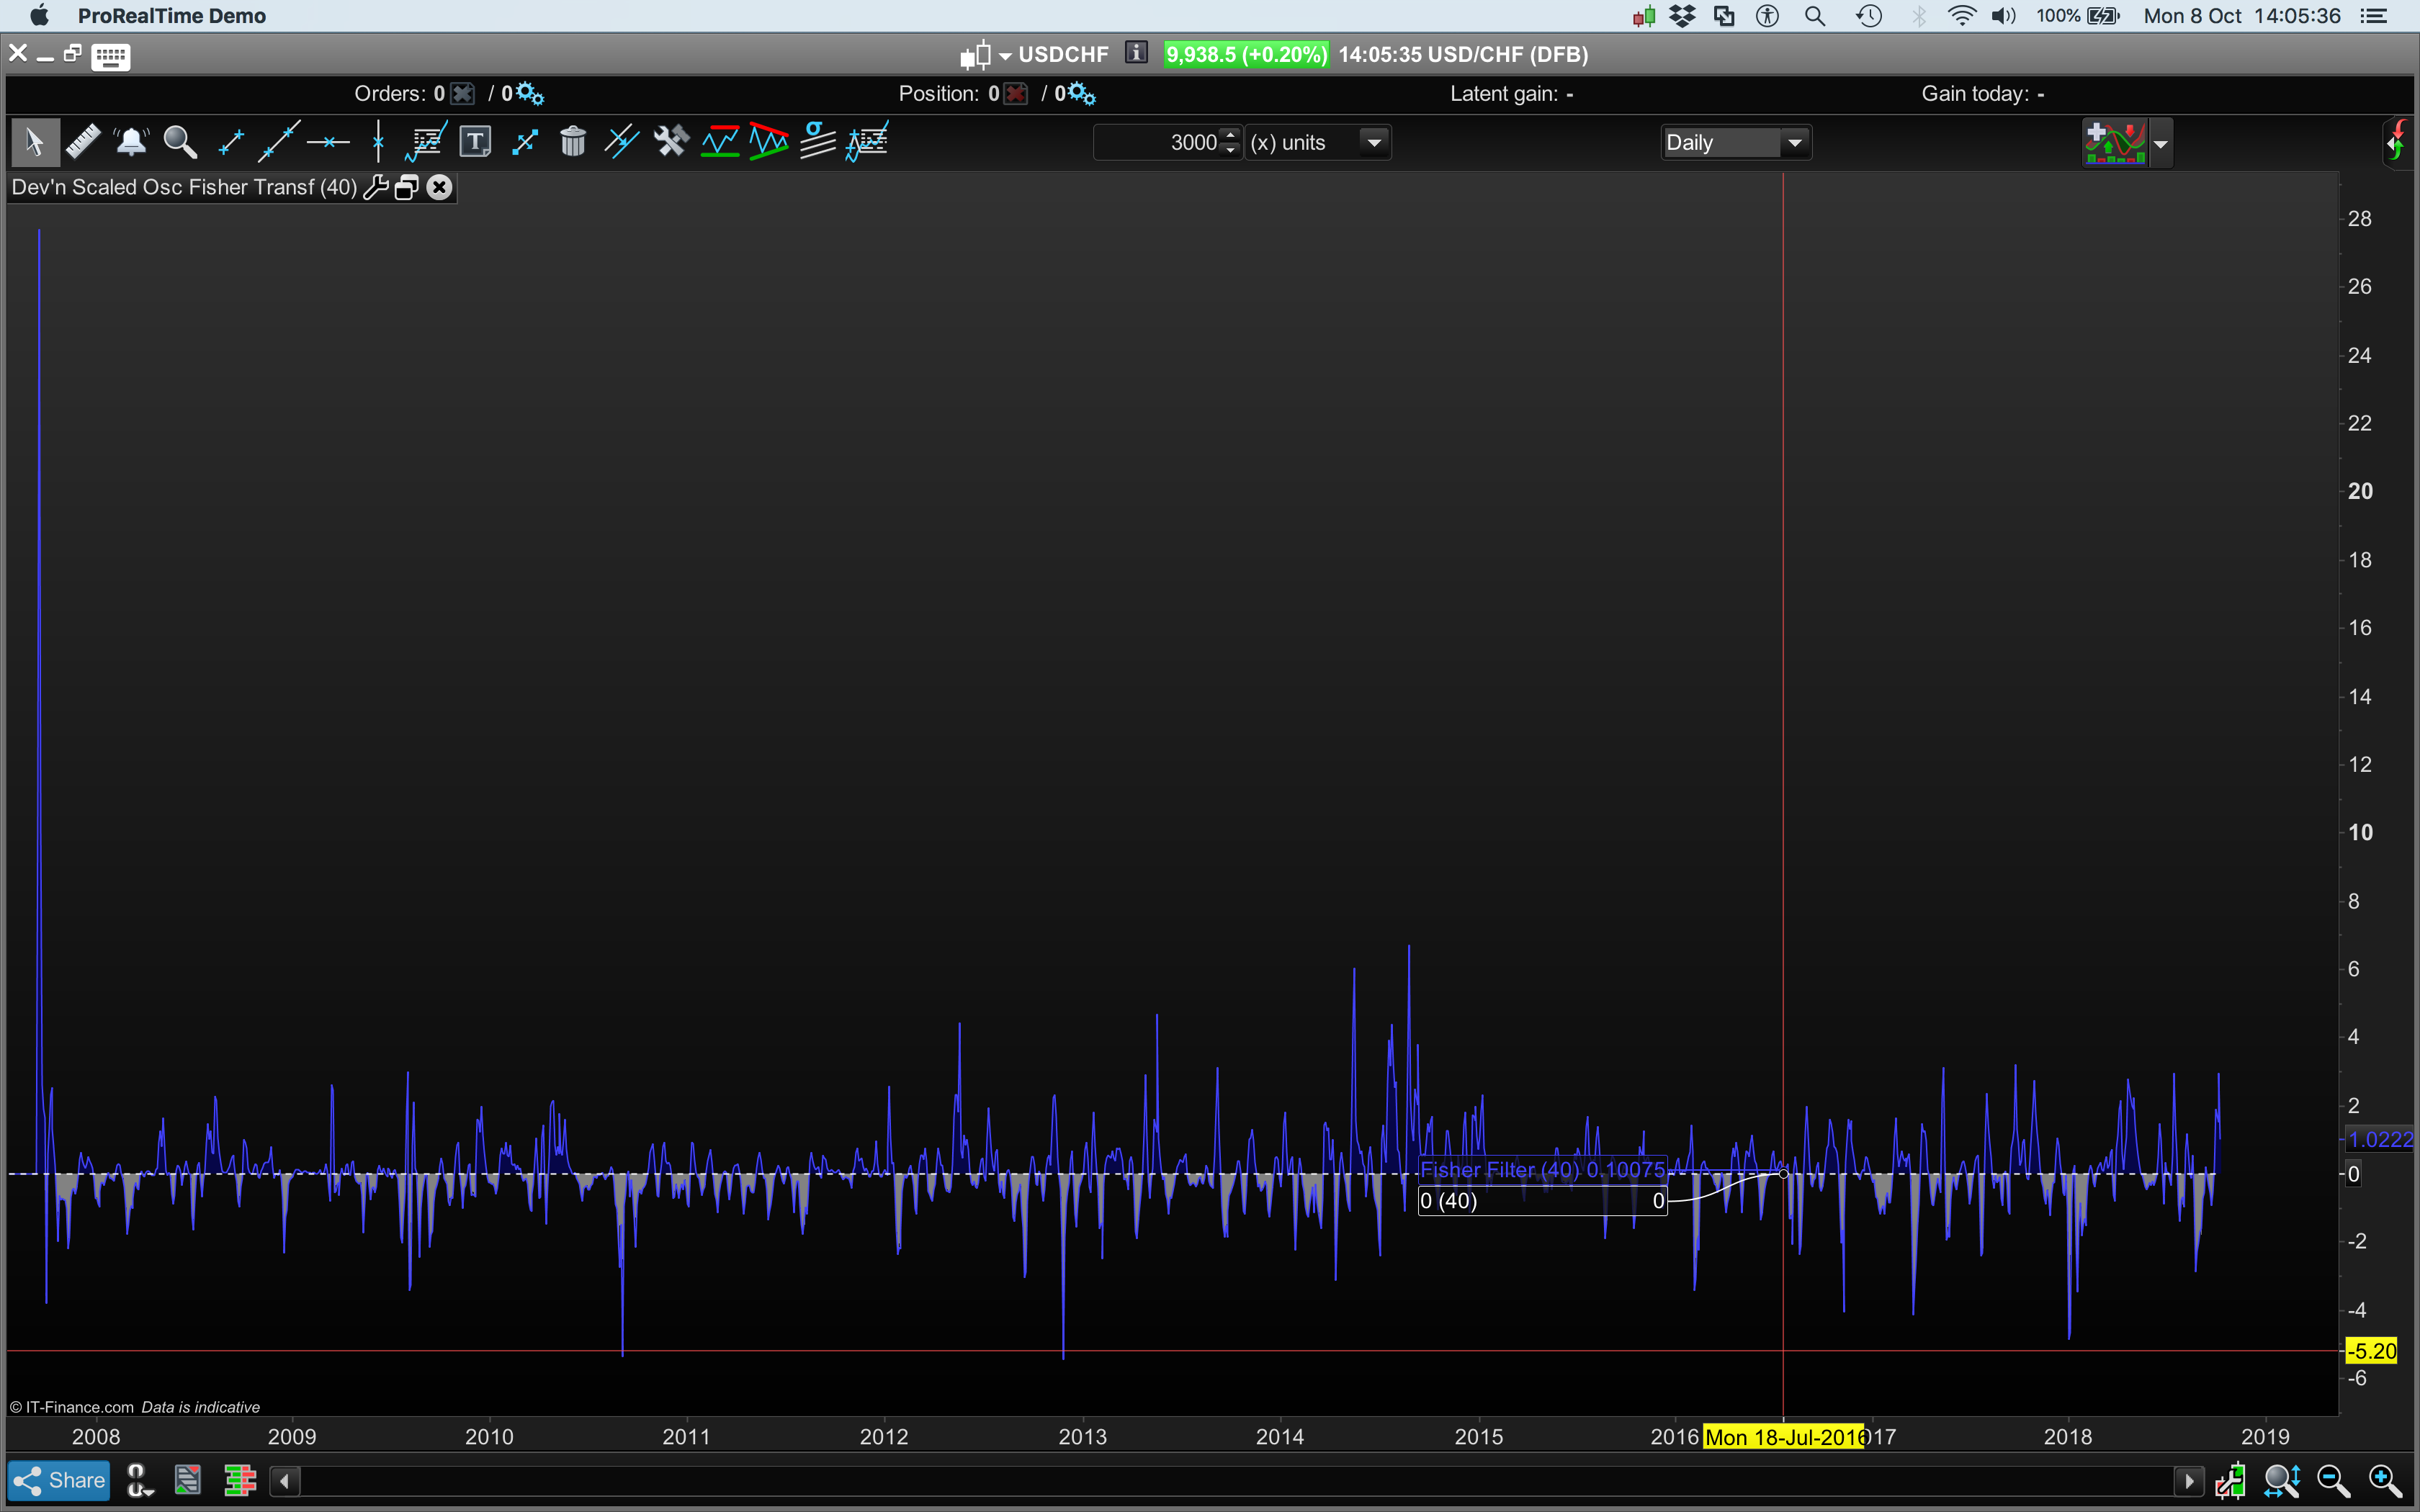
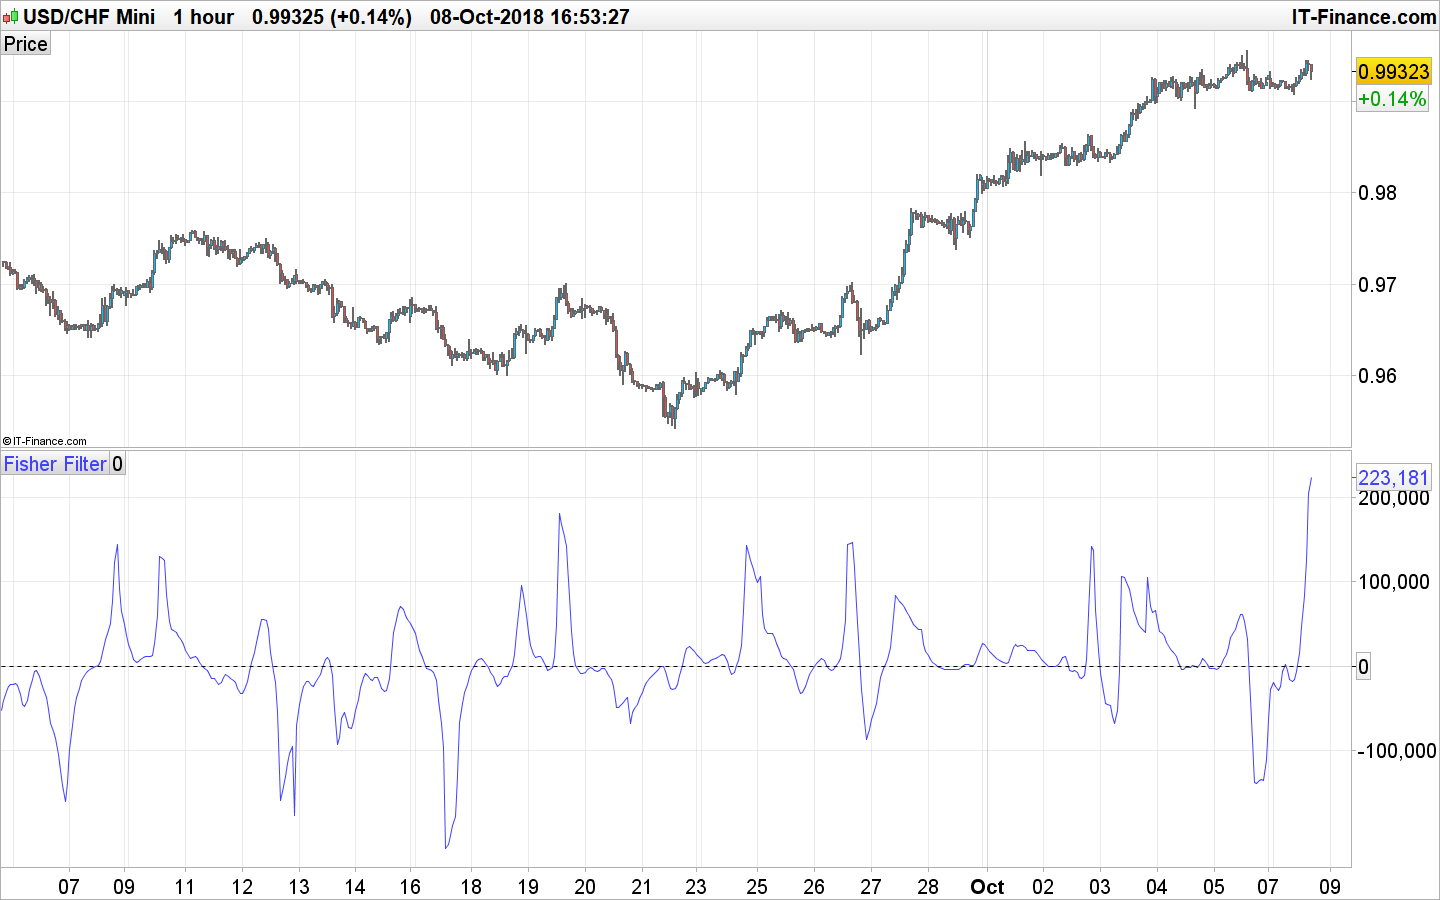
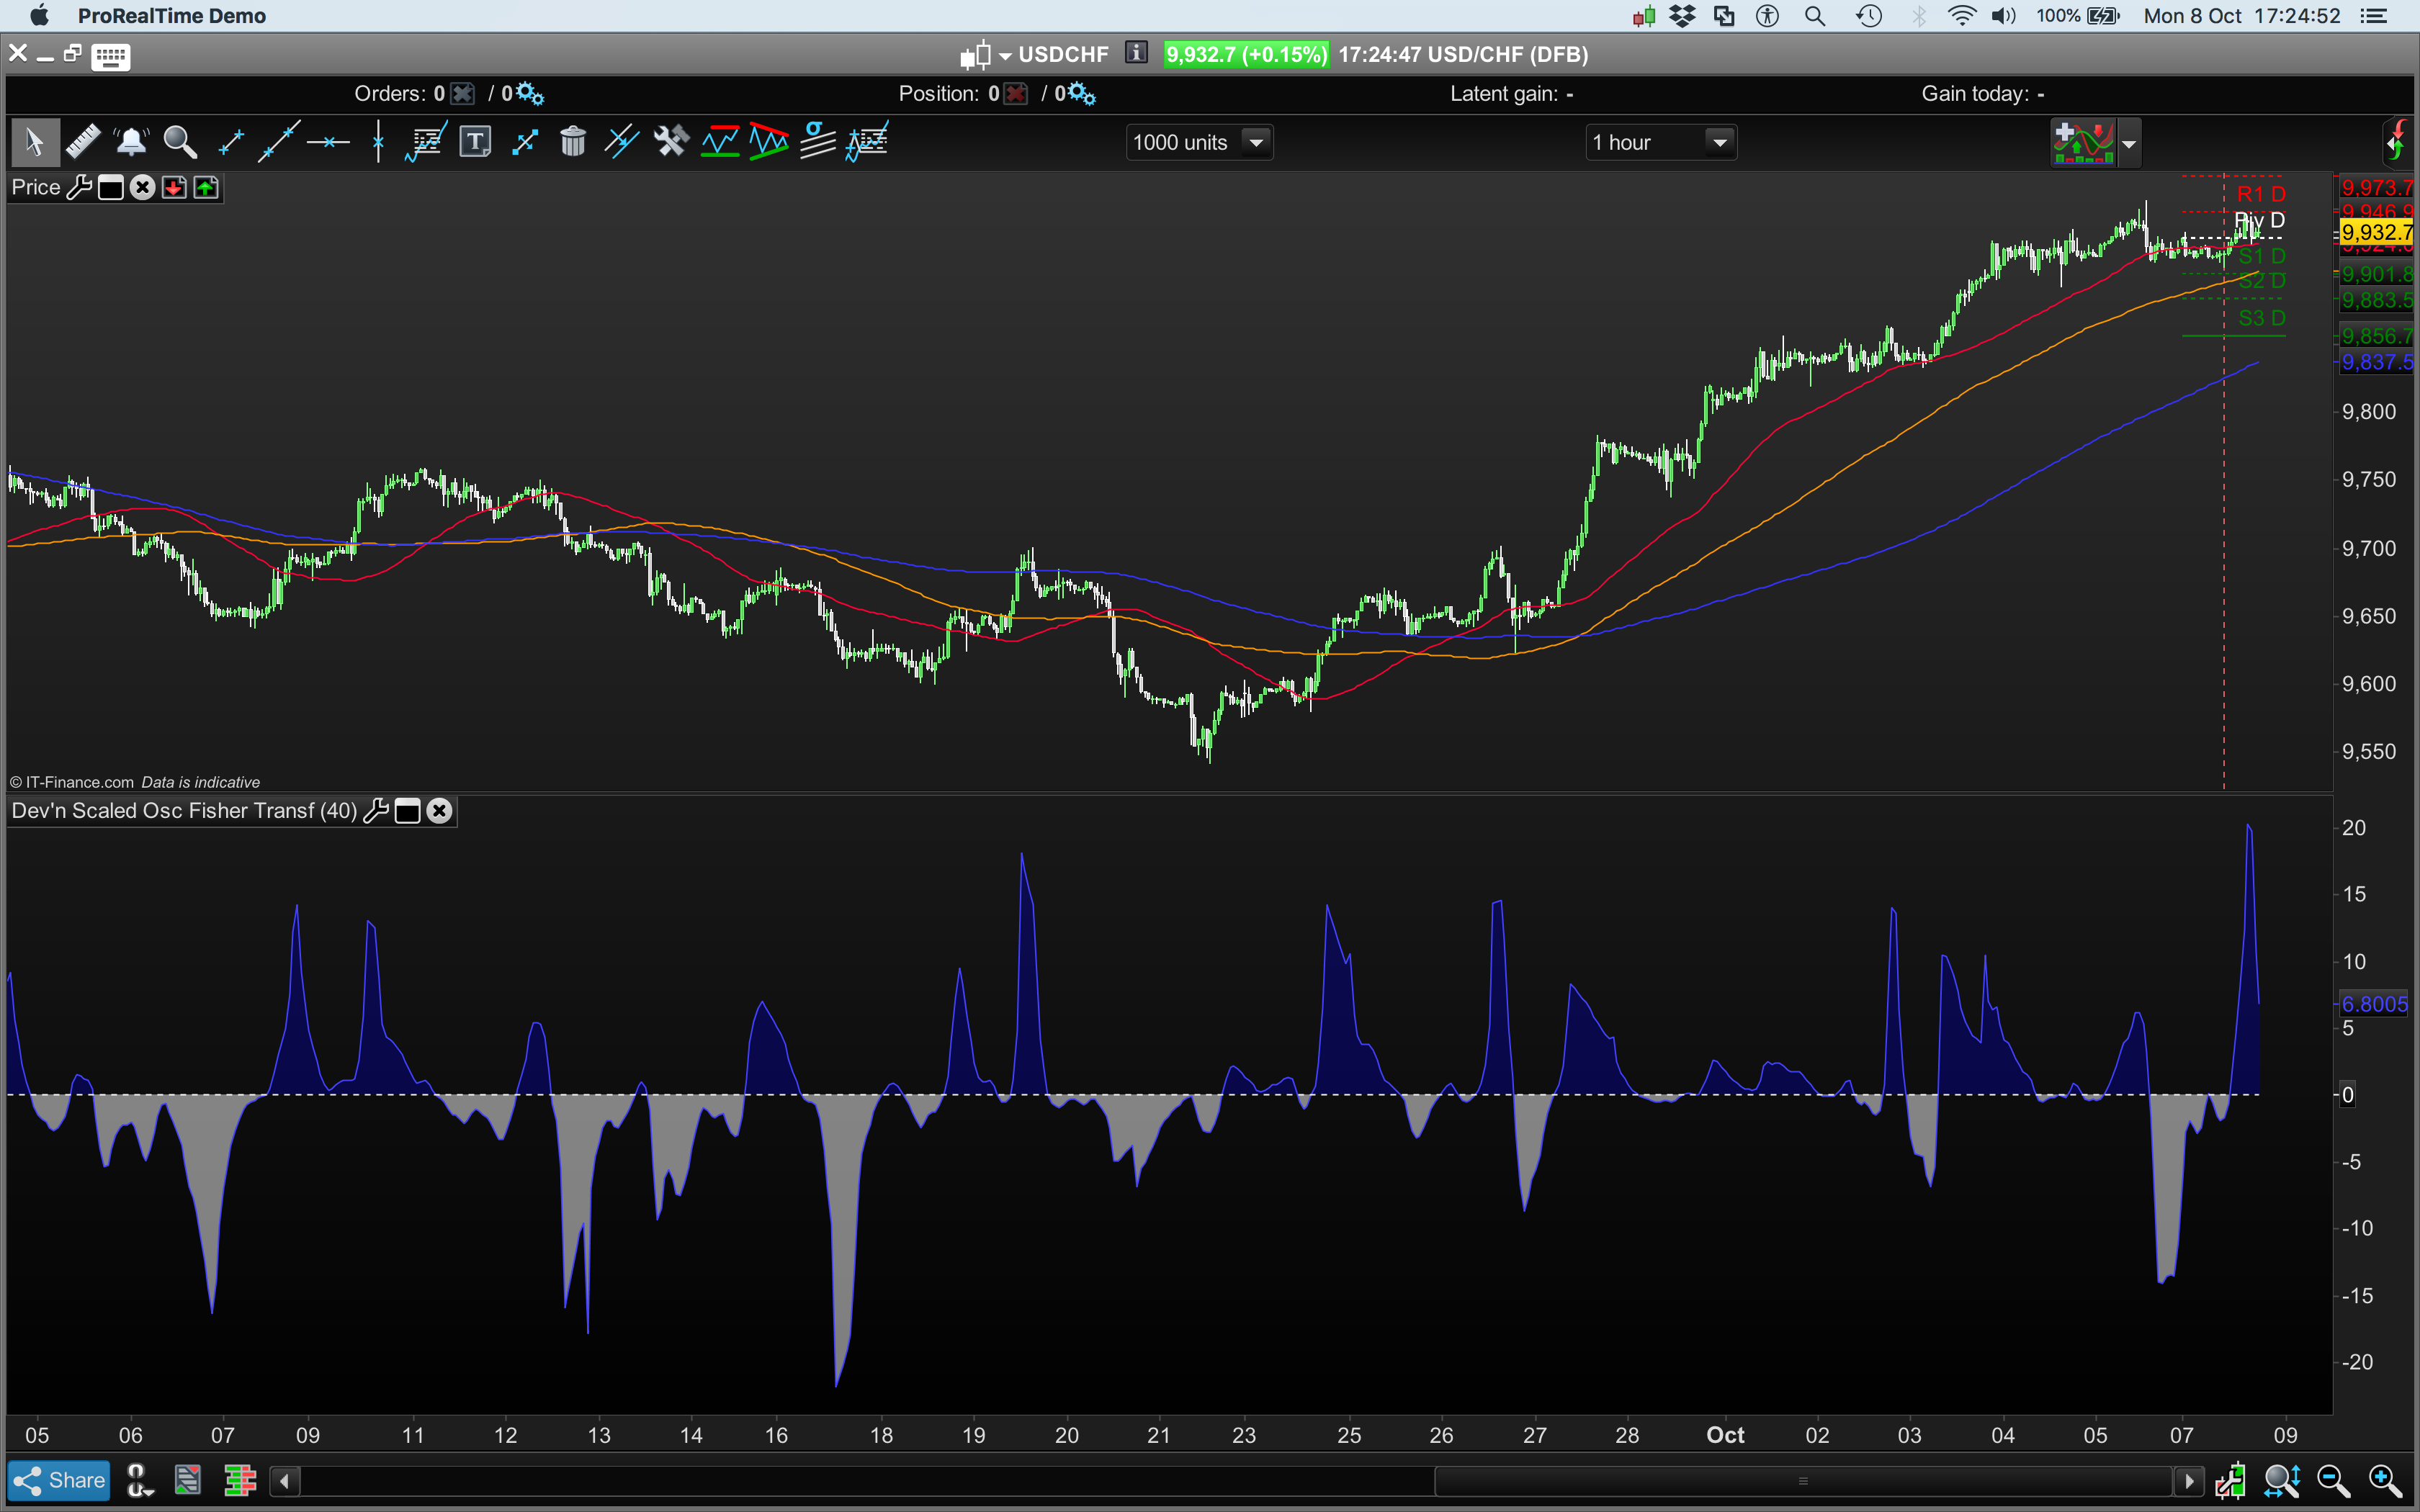
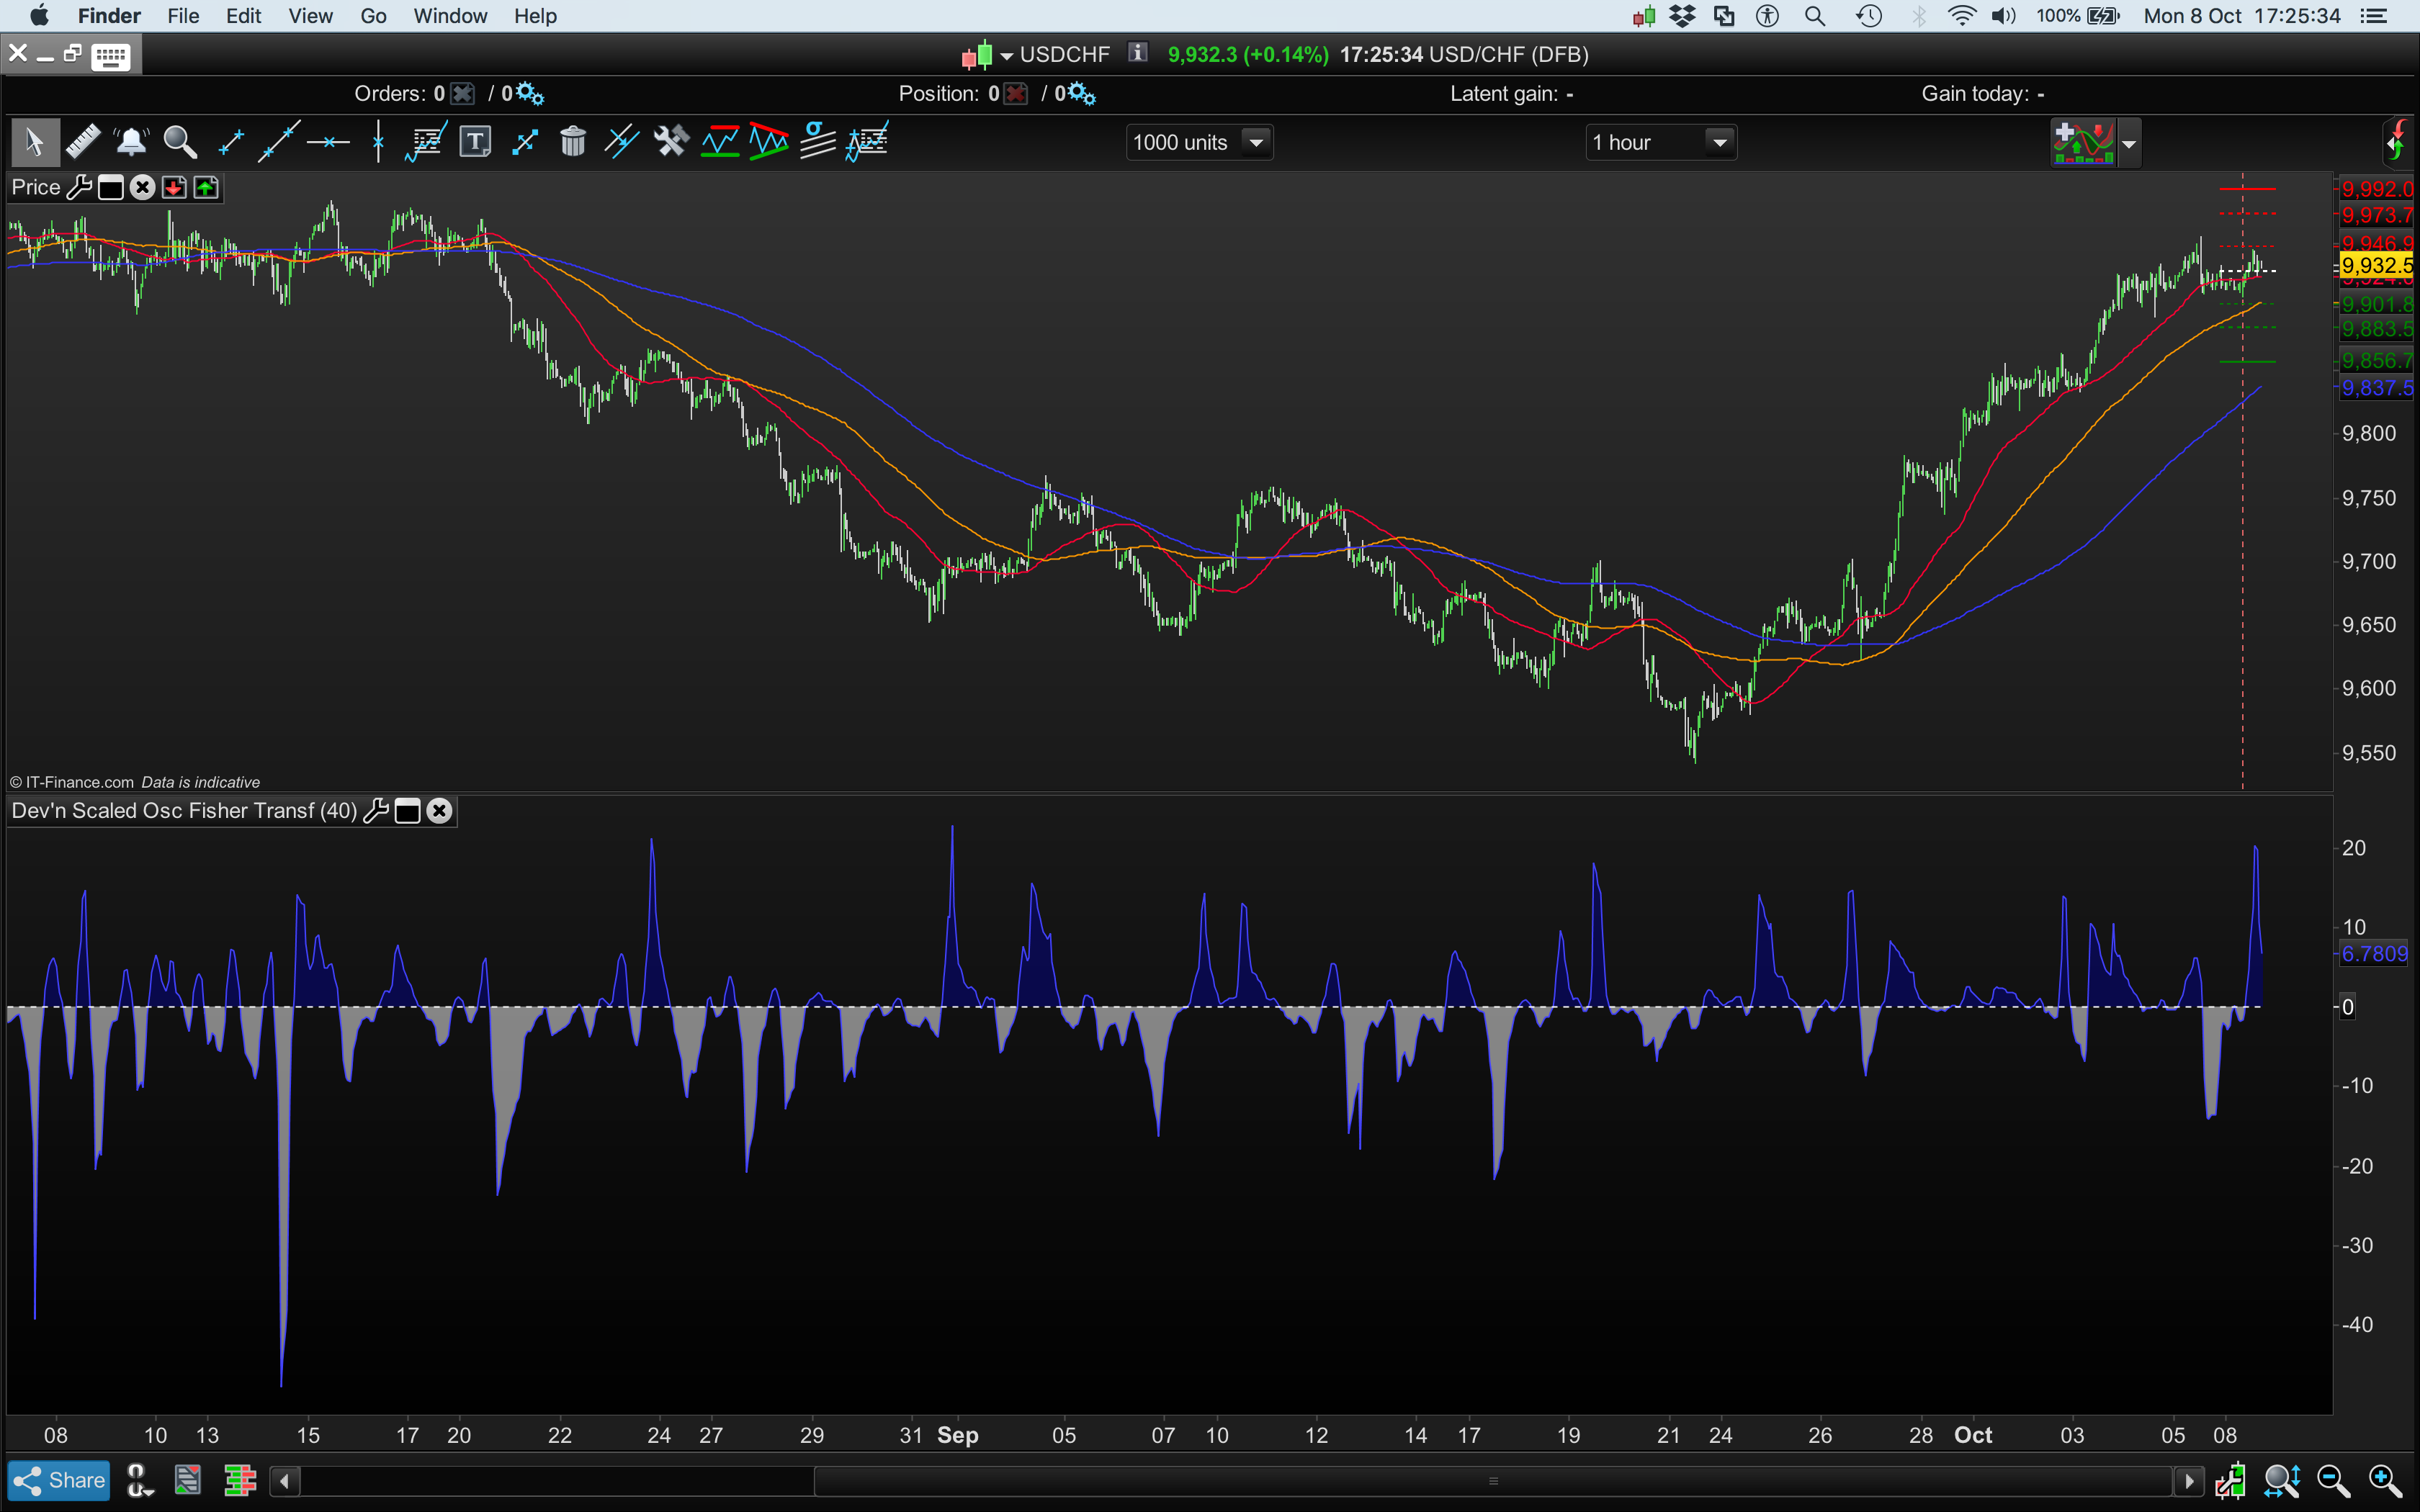
Ehler's Deviation-Scaled Fisher Transform Oscillator
This topic contains 12 replies,
has 2 voices, and was last updated by
Nicolas
7 years, 8 months ago.
| Forum: | ProBuilder: Indicators & Custom Tools |
| Language: | English |
| Started: | 09/22/2018 |
| Status: | Active |
| Attachments: | 18 files |
The information collected on this form is stored in a computer file by ProRealCode to create and access your ProRealCode profile. This data is kept in a secure database for the duration of the member's membership. They will be kept as long as you use our services and will be automatically deleted after 3 years of inactivity. Your personal data is used to create your private profile on ProRealCode. This data is maintained by SAS ProRealCode, 407 rue Freycinet, 59151 Arleux, France. If you subscribe to our newsletters, your email address is provided to our service provider "MailChimp" located in the United States, with whom we have signed a confidentiality agreement. This company is also compliant with the EU/Swiss Privacy Shield, and the GDPR. For any request for correction or deletion concerning your data, you can directly contact the ProRealCode team by email at privacy@prorealcode.com If you would like to lodge a complaint regarding the use of your personal data, you can contact your data protection supervisory authority.