John Ehler's Rocket RSI

Viewing 5 posts - 1 through 5 (of 5 total)

  • Author
    Posts
  • #69736 quote
    BardBard
    Participant
    Master

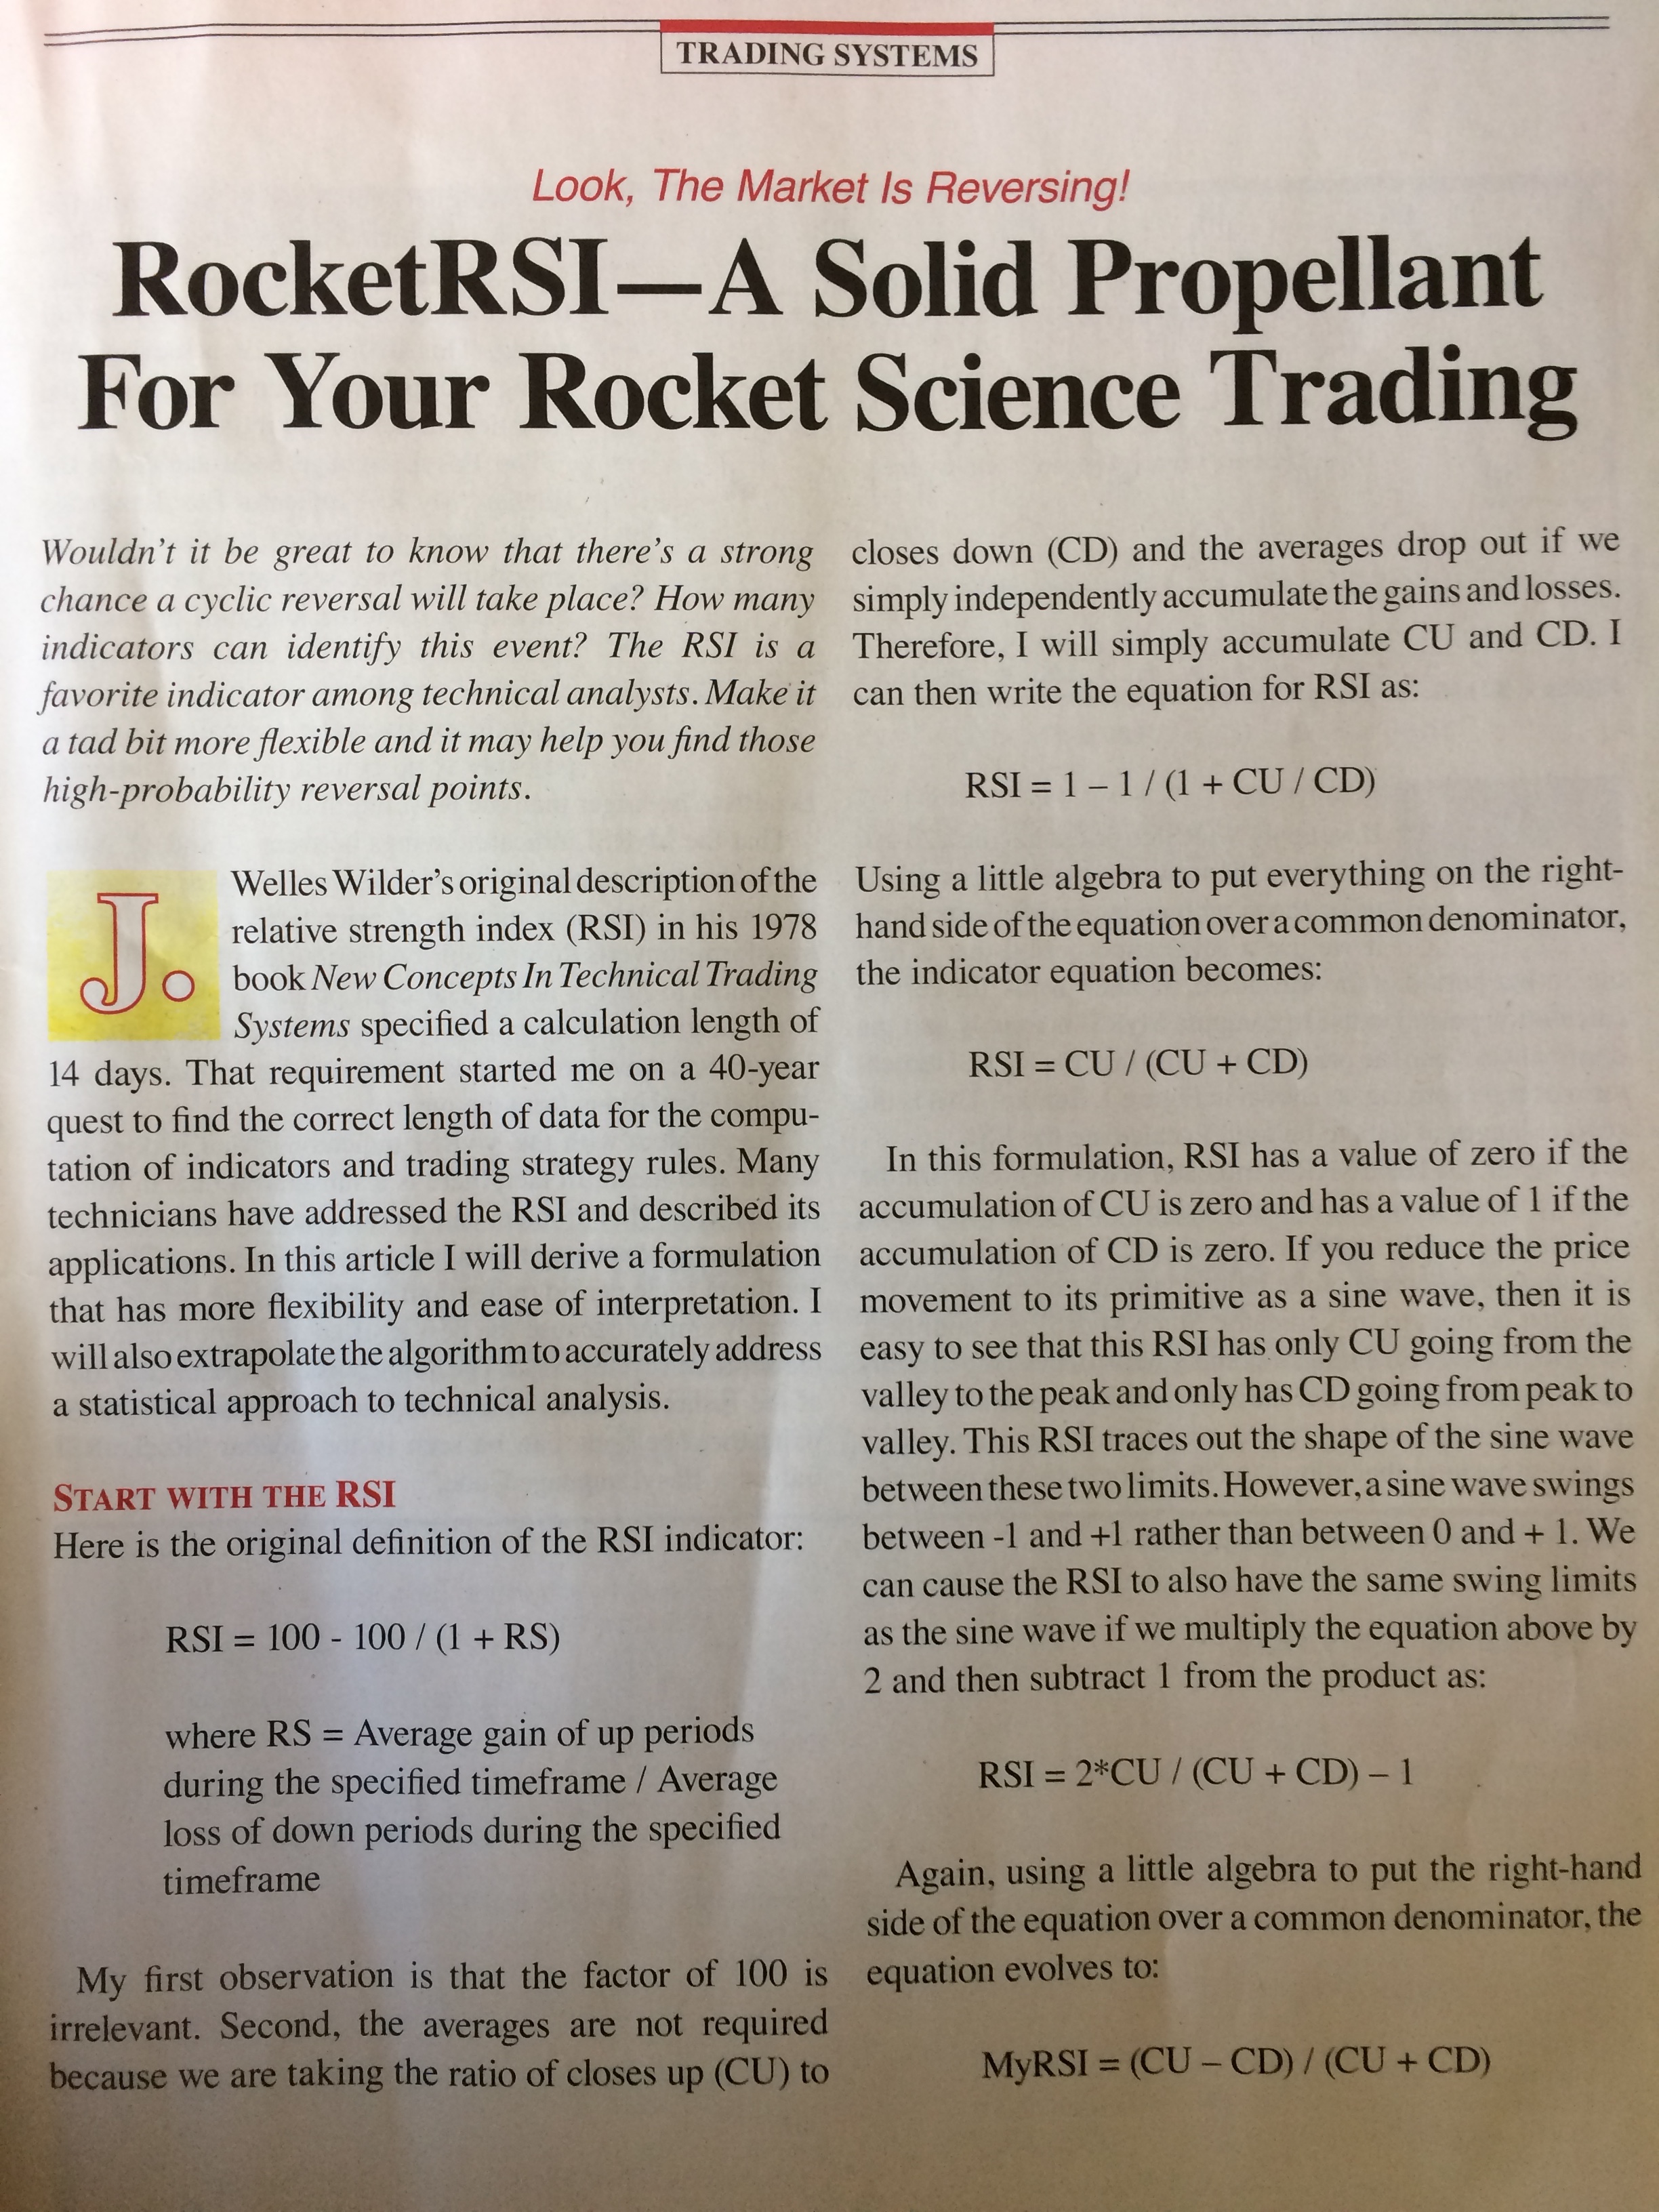
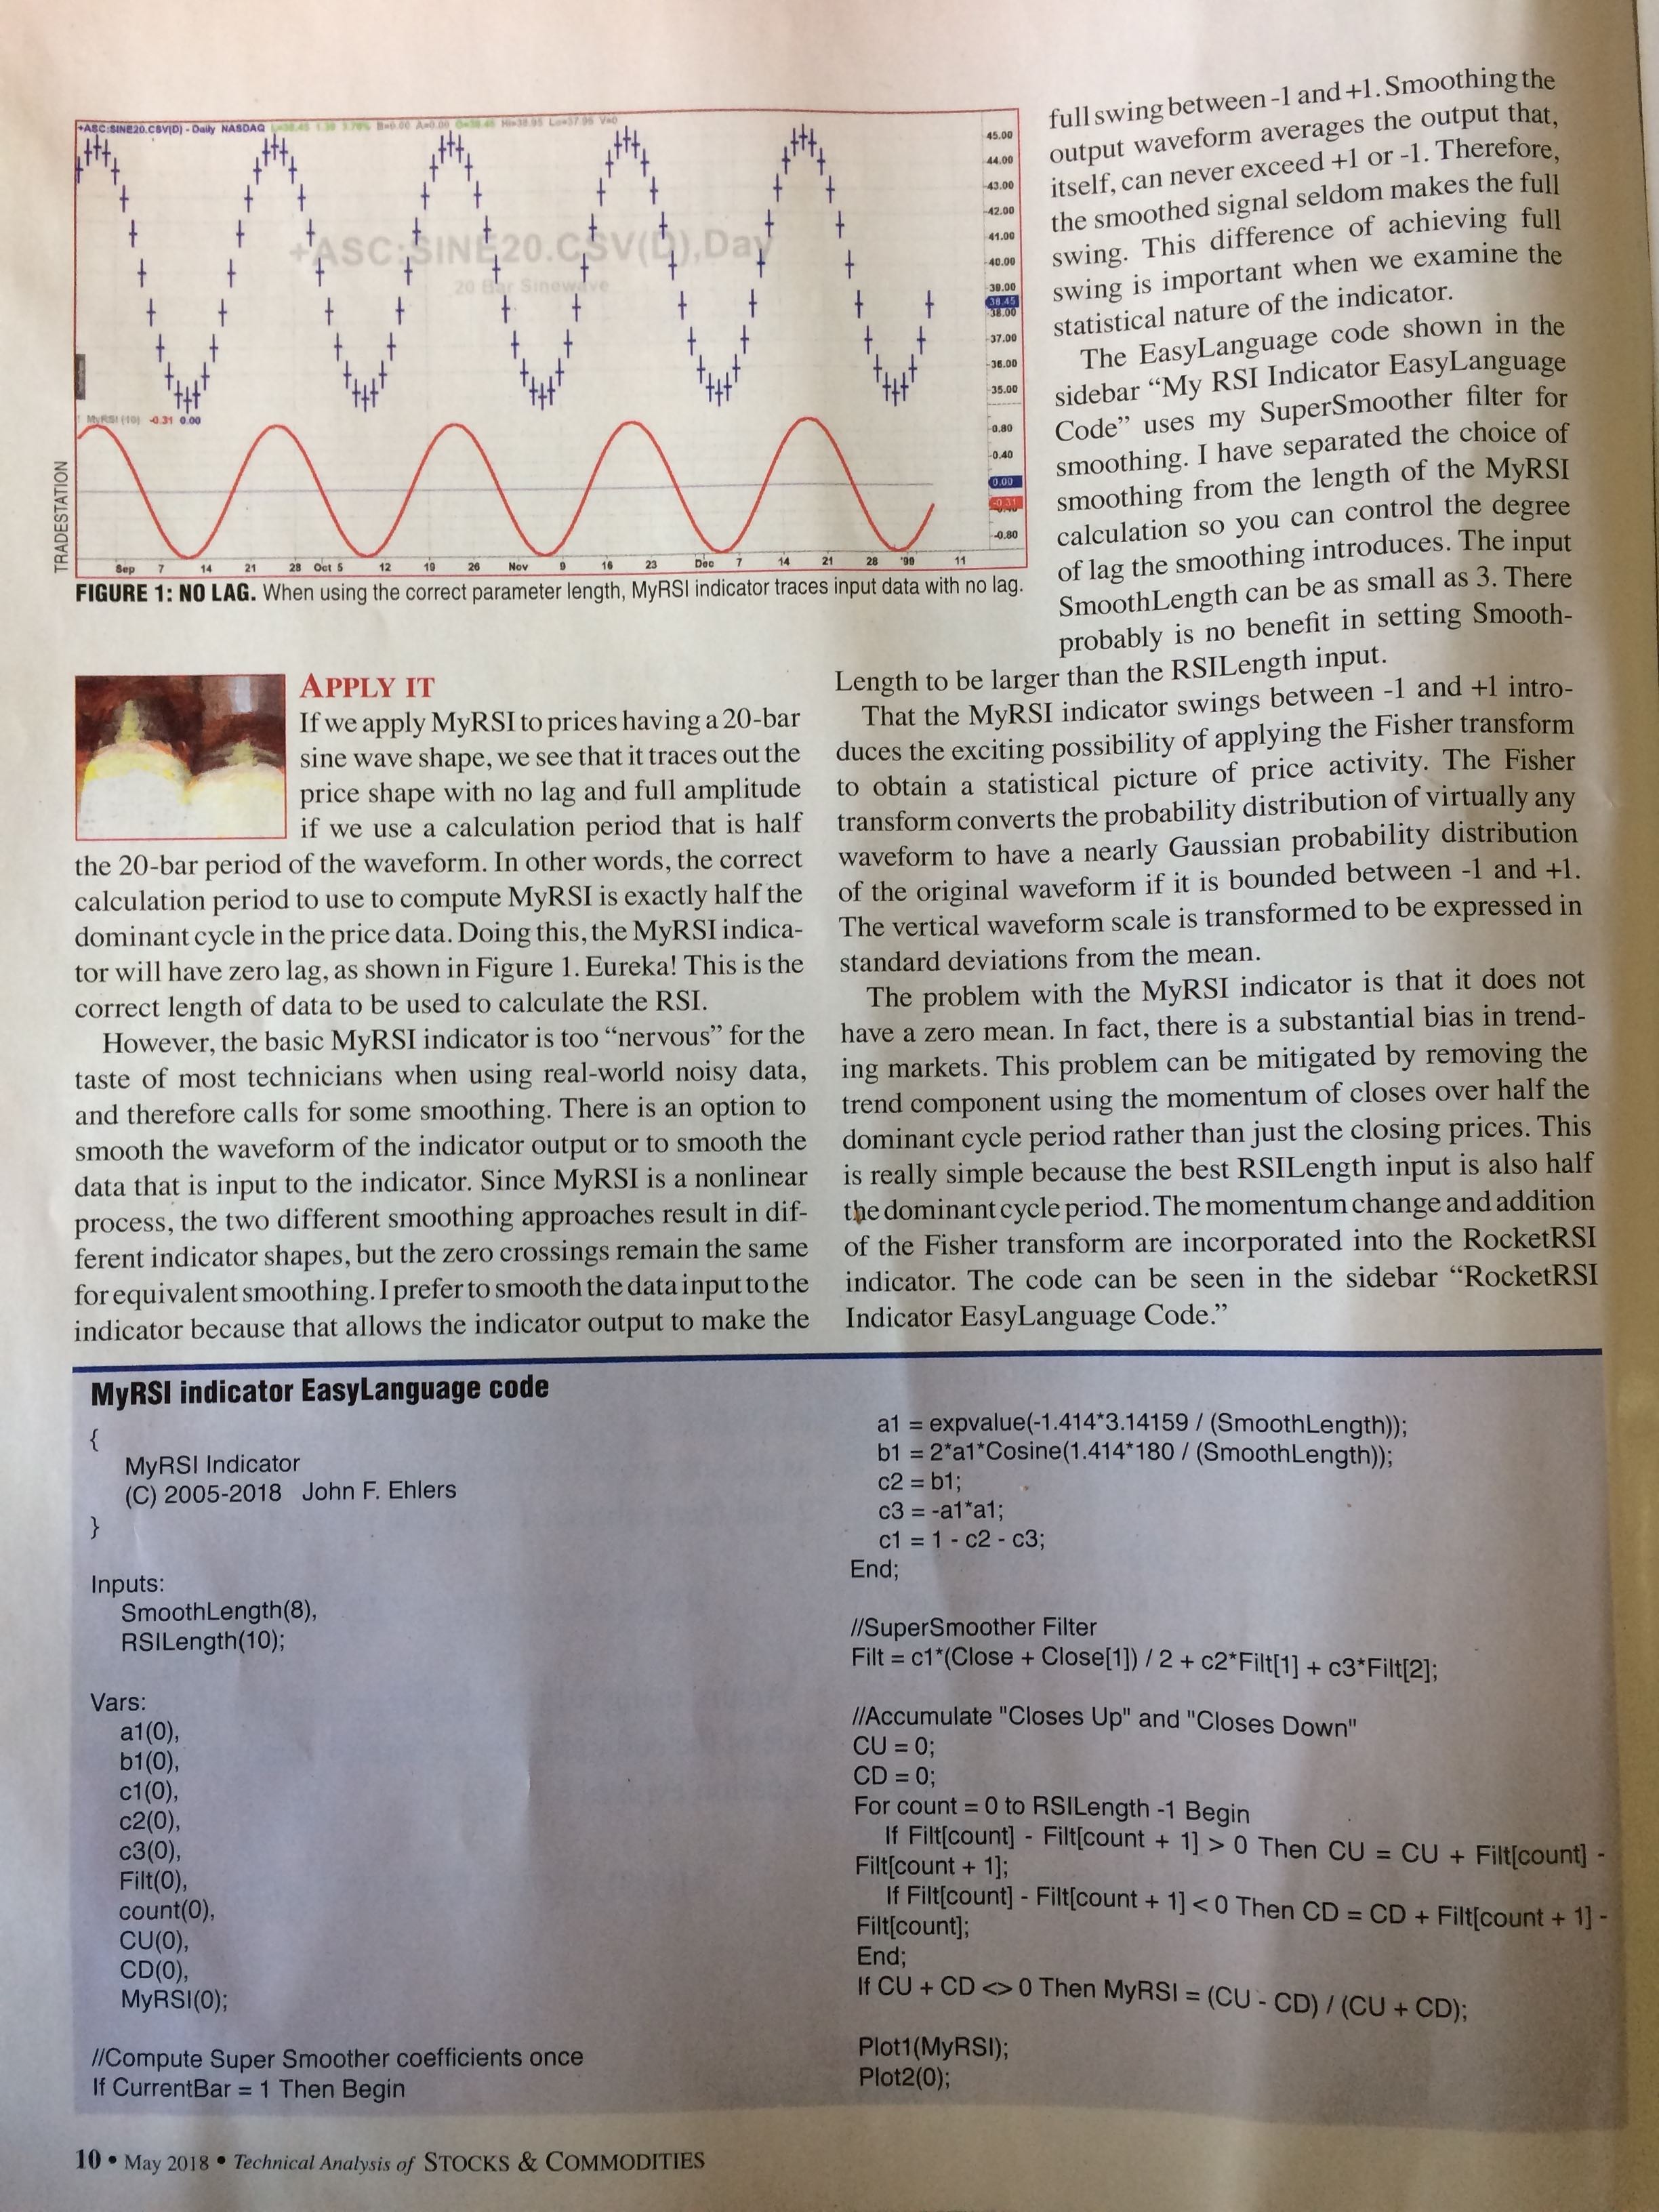
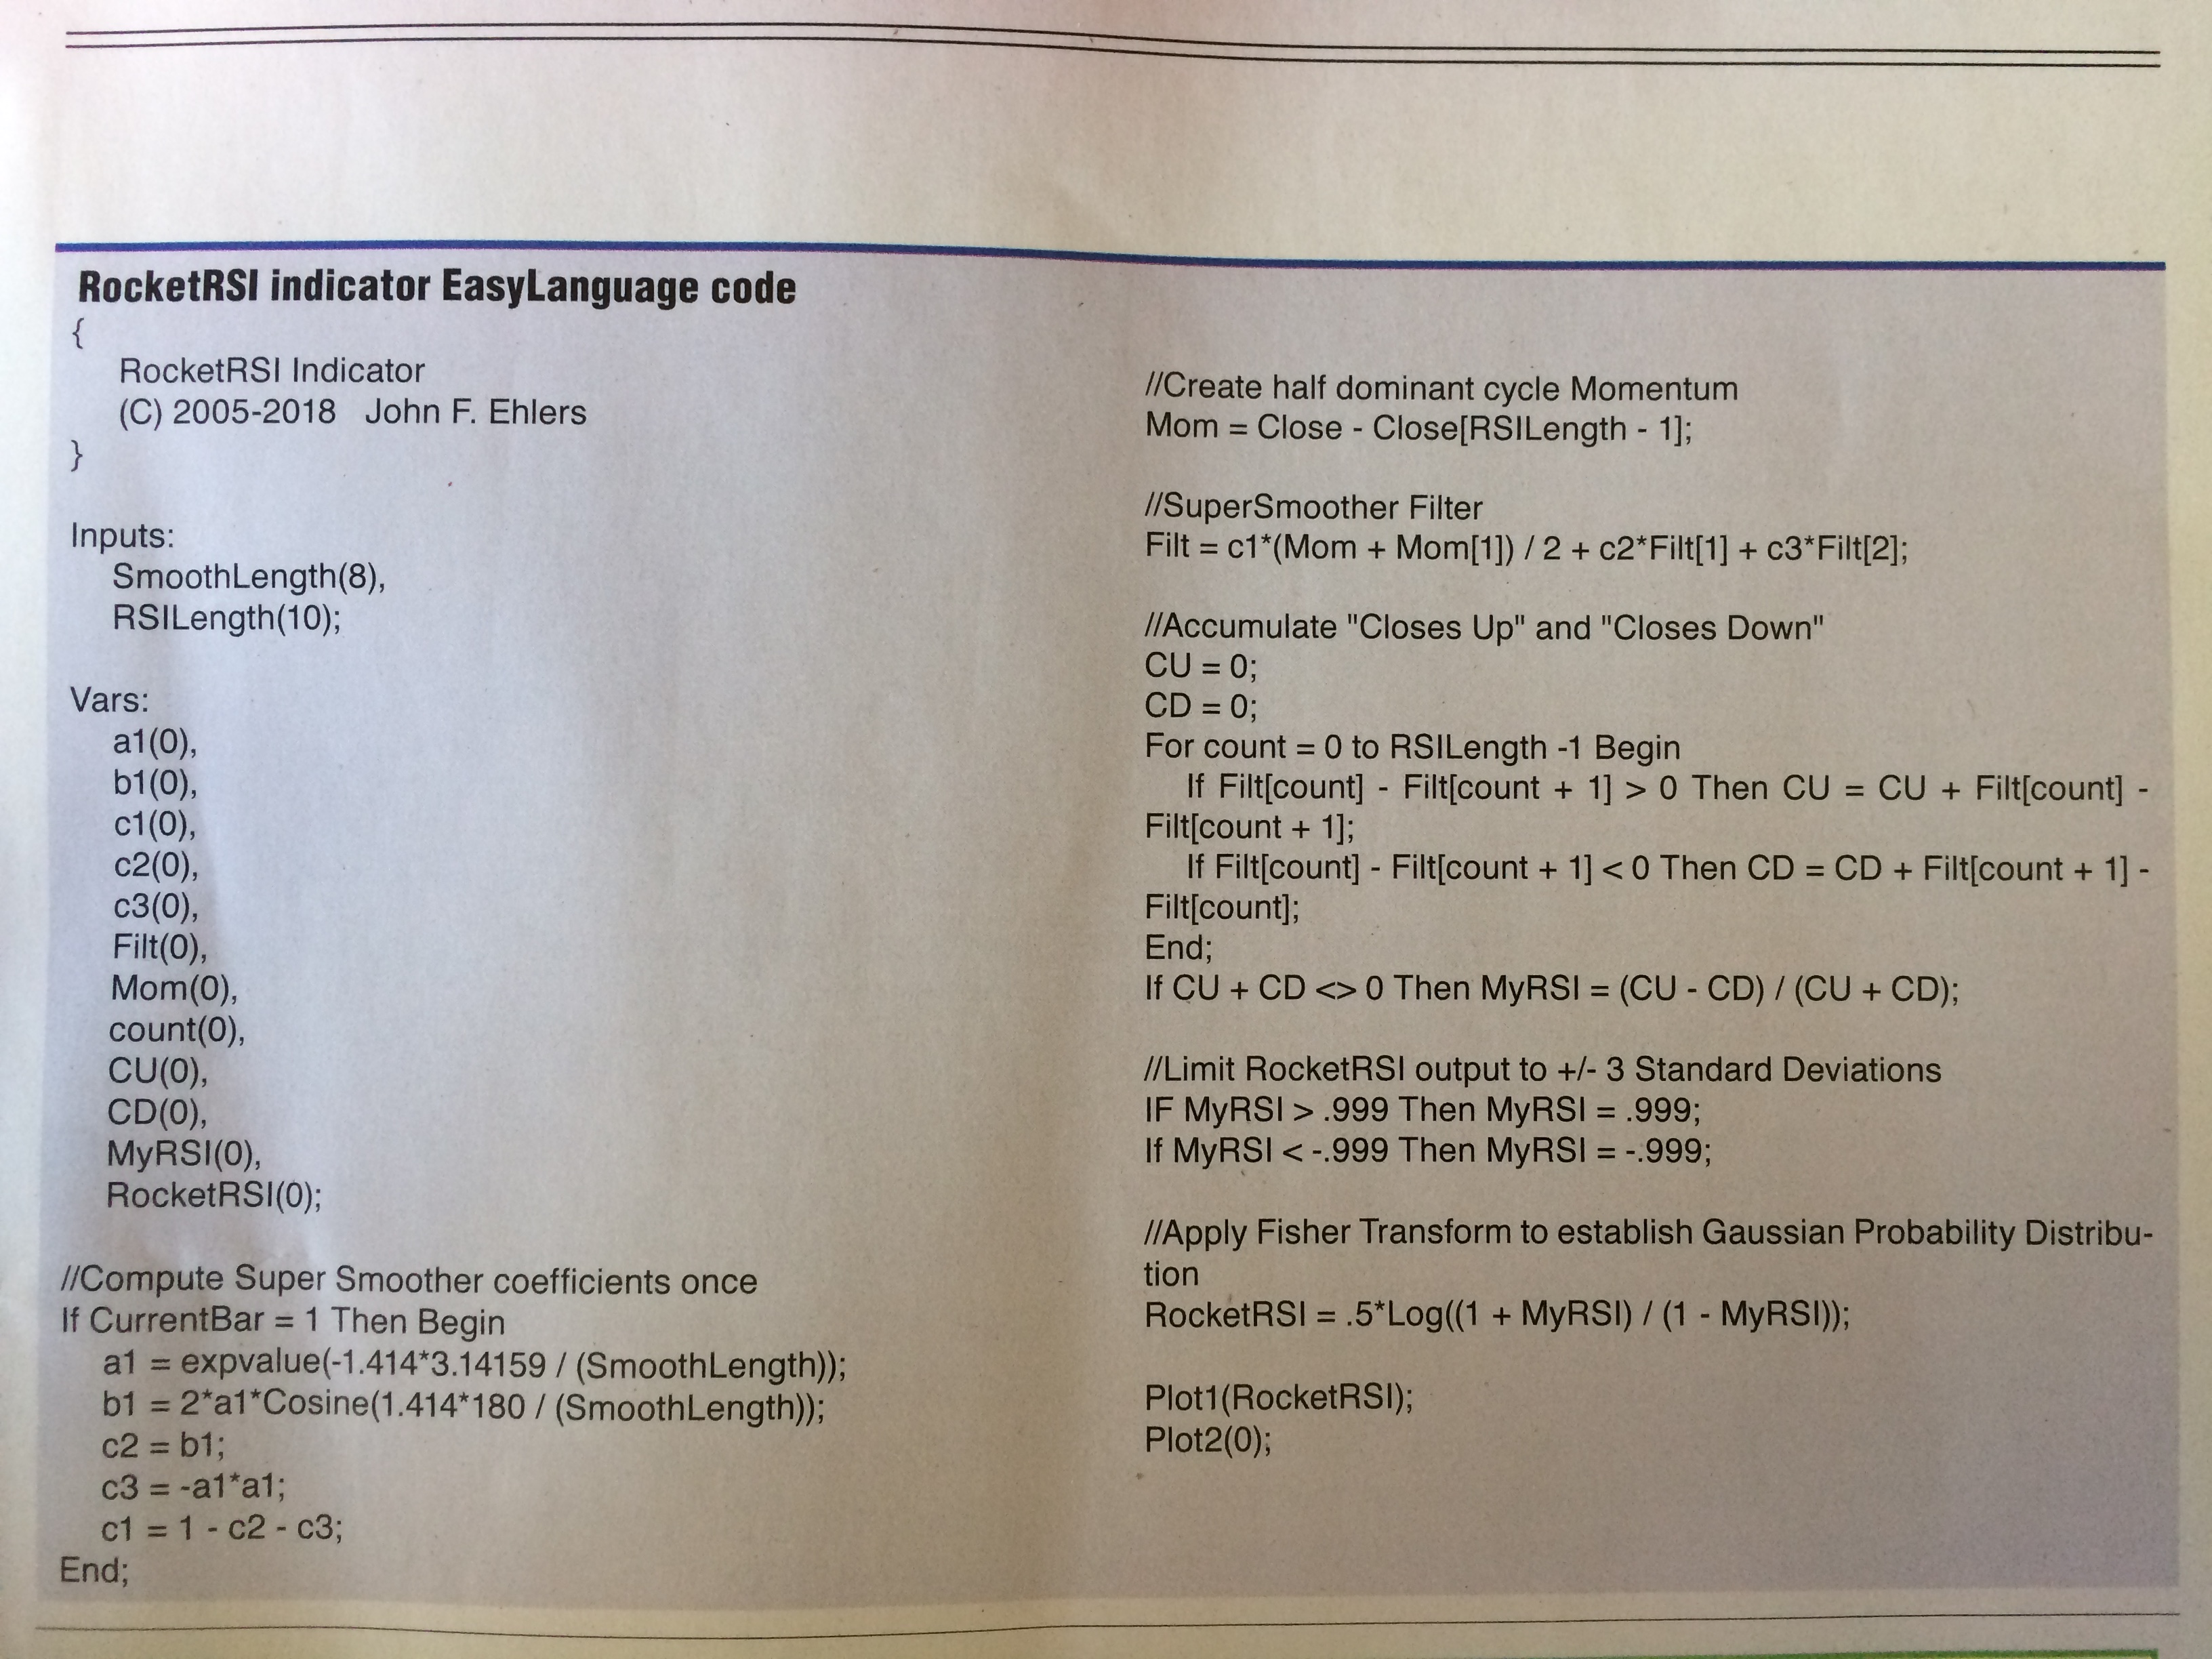
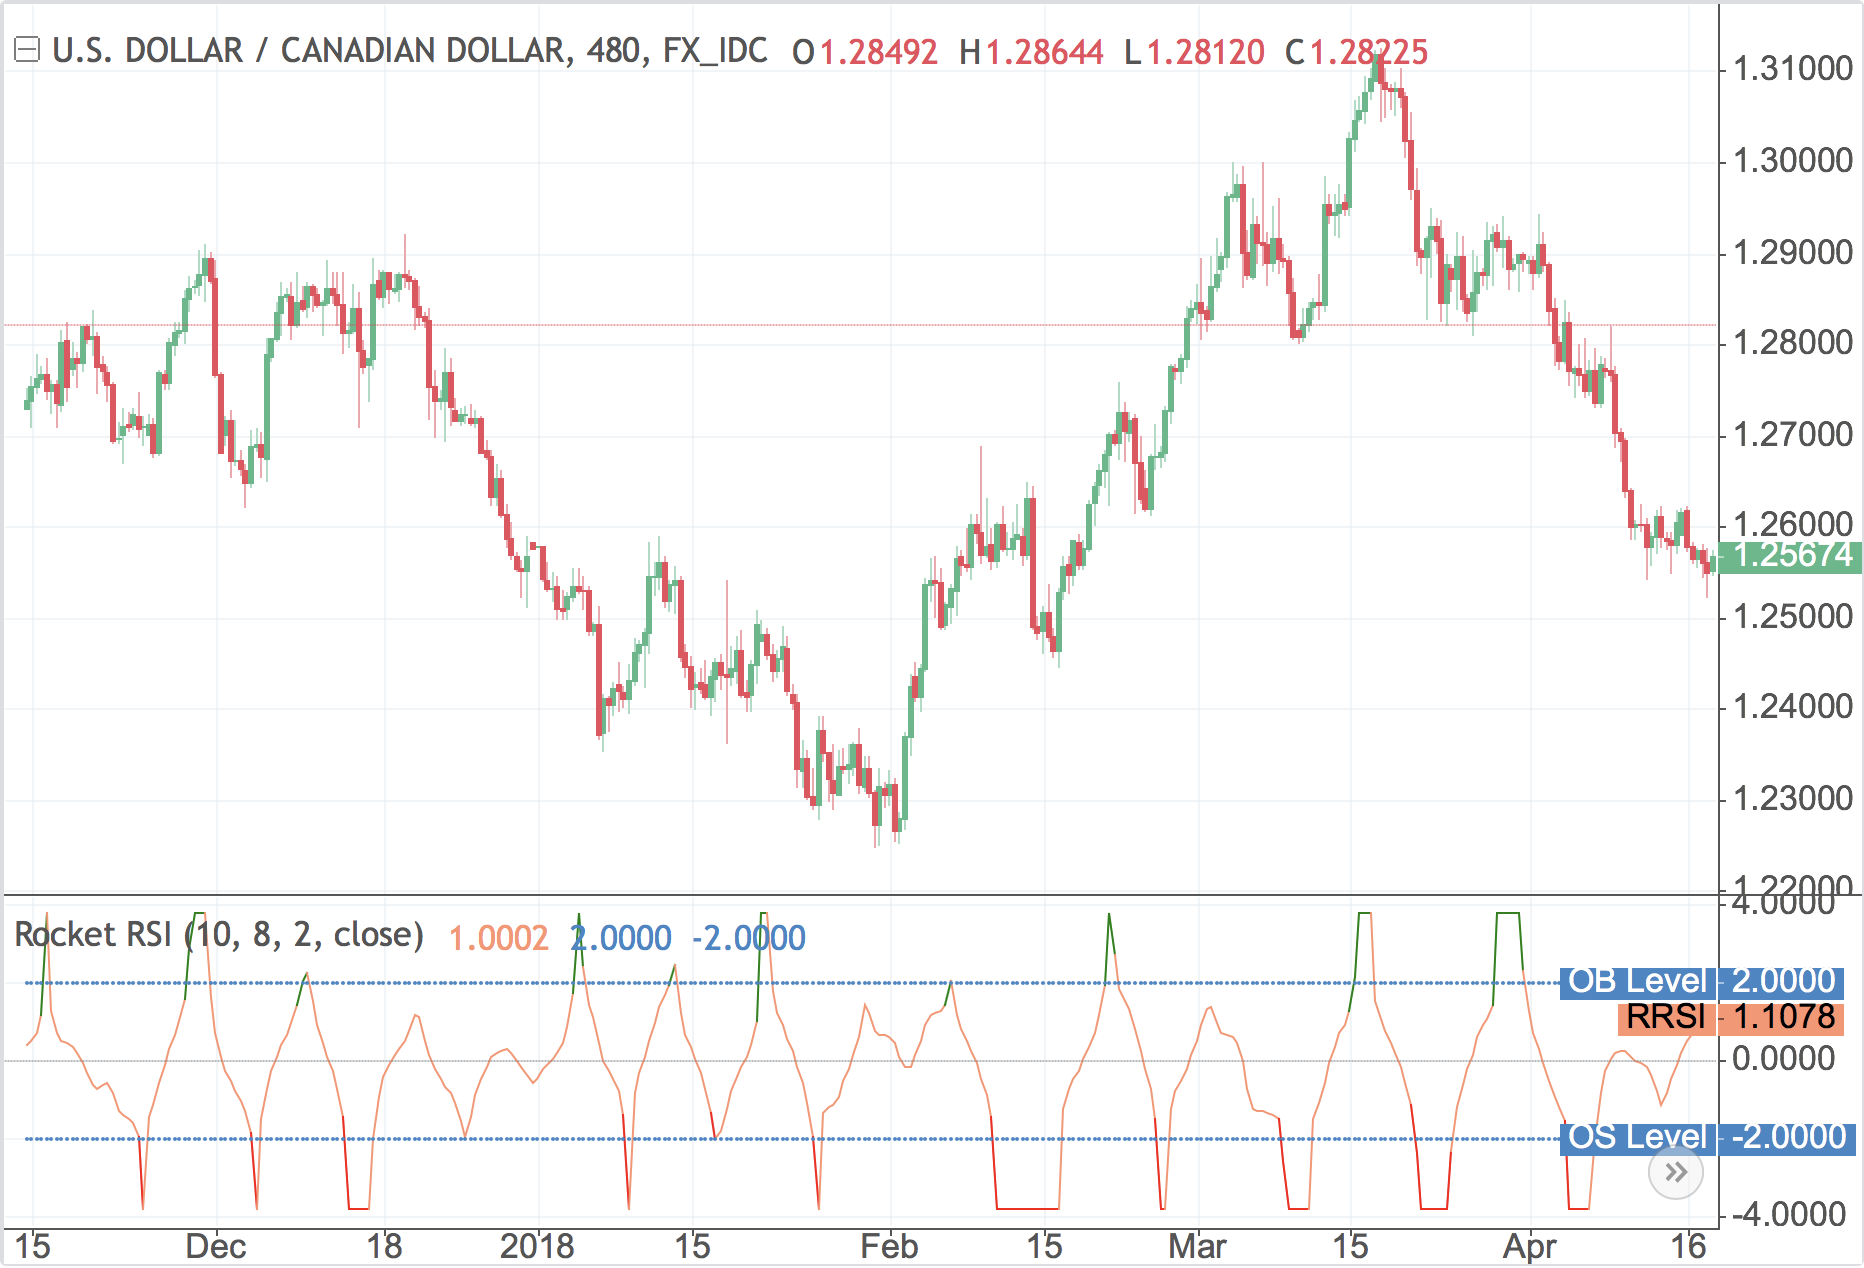
    Here is a version John Ehler’s Rocket RSI – originally from this May’s 2018 issue of Stocks & Commodities Magazine – and found on Trading View com, if anyone could modify the code for PRT?

    https://www.tradingview.com/script/VXOLWM61-Rocket-RSI/

    Thanks
    Bard

    //@version=3
    // Copyright (c) 2018-present, Alex Orekhov (everget)
    // Rocket RSI indicator script may be freely distributed under the MIT license.
    study("Rocket RSI", shorttitle="Rocket RSI")
    
    rsiLength = input(title="RSI Length", type=integer, defval=10, minval=1)
    smoothingLength = input(title="Smoothing Length", type=integer, defval=8, minval=1)
    obosLevel = input(title="Overbought / Oversold Level", type=float, defval=2.0, minval=0.0)
    applyNormalization = input(title="Apply Normalization to [-100, 100] values ?", type=bool, defval=false)
    src = input(title="Source", type=source, defval=close)
    
    PI = 2 * asin(1)
    
    a1 = 0.0
    b1 = 0.0
    c1 = 0.0
    c2 = 0.0
    c3 = 0.0
    
    // Compute Super Smoother coefficients
    a1 := exp(-1.414 * PI / smoothingLength)
    b1 := 2 * a1 * cos(1.414 * 180 / smoothingLength)
    c2 := b1
    c3 := -a1 * a1
    c1 := 1 - c2 - c3
    
    // Create half dominant cycle momentum
    mom = change(src, rsiLength - 1)
    
    // Super Smoother Filter
    ssf = 0.0
    ssf := c1 * (mom + nz(mom[1])) / 2 + c2 * nz(ssf[1]) + c3 * nz(ssf[2])
    
    // Accumulate Closes Up and Closes Down
    upSum = sum(change(ssf, 1) > 0 ? change(ssf, 1) : 0.0, rsiLength)
    downSum = sum(change(ssf, 1) > 0 ? 0.0 : abs(change(ssf, 1)), rsiLength)
    
    tmpRSI = 0.0
    tmpRSI := upSum + downSum != 0 ? (upSum - downSum) / (upSum + downSum) : nz(tmpRSI[1])
    
    // Limit RocketRSI output to +/-3 Standard Deviations
    if tmpRSI > 0.999
    	tmpRSI := 0.999
    
    if tmpRSI < -0.999 
        tmpRSI := -0.999
    
    // Apply Fisher Transform to establish Gaussian Probability Distribution
    rocketRSI = 0.5 * log((1 + tmpRSI) / (1 - tmpRSI))
    rocketRSI := applyNormalization ? rocketRSI * 25 : rocketRSI
    
    overboughtLevel = applyNormalization ? obosLevel * 25 : obosLevel
    oversoldLevel = applyNormalization ? obosLevel * -25 : obosLevel * -1
    
    rocketRSIColor = rocketRSI > overboughtLevel ? green : rocketRSI < oversoldLevel ? red : #ff9370
    
    plot(rocketRSI, title="RRSI", linewidth=2, color=rocketRSIColor, transp=0)
    
    plot(overboughtLevel, title="OB Level", style=circles, color=#3d85c6, transp=0)
    hline(0, title="Zero Level", linestyle=dotted)
    plot(oversoldLevel, title="OS Level", style=circles, color=#3d85c6, transp=0)
    Rocket-RSI.png Rocket-RSI.png
    #69741 quote
    DespairDespair
    Blocked
    Master

    Do you have a link to the original article?

    #69775 quote
    DespairDespair
    Blocked
    Master

    I uploaded the indicator to the library.

    #69780 quote
    BardBard
    Participant
    Master

    Hi Despair,

    Thanks very much for coding it. I took some copies of my magazine if that helps.

    Cheers
    Bard

    Rocket-RSI-1.jpg Rocket-RSI-1.jpg 2a.jpg 2a.jpg Rocket-RSI-3.jpg Rocket-RSI-3.jpg
    #69784 quote
    DespairDespair
    Blocked
    Master

    Thanks, I found the the indicator in traders tips for this month.

    Here is the code in case you are impatient and can’t wait for Nicolas to approve it for the library:

    // RSILength = 10
    // SmoothLength = 10
    // OBOSLevel = 2
    
    //Compute Super Smoother coefficients once
    if barindex = 1 then
    a1 = exp( -1.414 * 3.14159/ ( SmoothLength ) )
    b1 = 2 * a1 * Cos( 1.414 * 180/ ( SmoothLength ) )
    c2 = b1
    c3 = -square(a1)
    c1 = 1 - c2 - c3
    endif
    if barindex > RSILength then
    //Create half dominant cycle Momentum
    Mom = Close - Close[RSILength - 1]
    
    //SuperSmoother Filter
    Filt = c1 * ( Mom + Mom[1] ) / 2 + c2 * Filt[1] + c3 * Filt[2]
    
    //Accumulate "Closes Up" and "Closes Down"
    CU = 0
    CD = 0
    for count = 0 to RSILength -1 do
    if Filt[count] - Filt[count + 1] > 0 then
    CU = CU + Filt[count] - Filt[count + 1]
    endif
    if Filt[count] - Filt[count + 1] < 0 then
    CD = CD + Filt[count + 1] - Filt[count]
    endif
    next
    
    if CU + CD <> 0 then
    MyRSI = ( CU - CD ) / ( CU + CD )
    endif
    
    //Limit RocketRSI output to
    //+/- 3 Standard Deviations
    MyRSI = min(max(MyRSI,-.999),.999)
    
    //Apply Fisher Transform to establish
    //Gaussian Probability Distribution
    RocketRSI = .5 * Log( ( 1 + MyRSI ) / ( 1 - MyRSI ) )
    endif
    return RocketRSI coloured(0,0,255) as "RocketRSI", 0 as "Zero Line", OBOSLevel coloured(255,0,0) as "OverBought", -OBOSLevel coloured(255,0,0) as "OverSold"
    
    GraHal, robertogozzi and Bard thanked this post
Viewing 5 posts - 1 through 5 (of 5 total)
  • You must be logged in to reply to this topic.

ProRealAI ProRealAI New

Stuck on this ProBuilder code?

Describe what this topic is trying to build, in plain English, and ProRealAI writes the ProRealTime™ indicator, screener or system for you.

Available in 7 languages
Try ProRealAI

John Ehler's Rocket RSI


ProBuilder: Indicators & Custom Tools

New Reply
Author
author-avatar
Bard @brad Participant
Summary

This topic contains 4 replies,
has 2 voices, and was last updated by DespairDespair

8 years, 5 months ago.

Topic Details
Forum: ProBuilder: Indicators & Custom Tools
Language: English
Started: 05/03/2018
Status: Active
Attachments: 4 files
ProRealCode ProRealCode
Loading...