Hello,
I mainly do streaming/storing of market data, strategy research and automated trading via a custom cloud-based ecosystem, but from time to time I use ProRealTime to verify calculations or to visualize things.
Now I’m at the point that I want to generate tick bars (n ticks per bar) for IG tick data and I decided to try to keep these tick bars as close as possible to ProRealTime’s tick bars. However, having a look at ProRealTime’s tick bars for IG market data I found some ambiguities. So I’m reaching out in this forum to hopefully get some clarity how ProRealTime’s tick bar timeframes are calculated internally. Here are my following questions:
- If I choose a tick bar timeframe (e.g. 1000 ticks), which “origin” is used in ProRealTime to generate this timeframe? If I show a specific data interval (e.g. last 25k data points) in a chart window, how is the first tick bar determined? Does the first tick bar start with the first tick within this time interval? Or is a bigger time interval (or even all available data) used to calculate the tick bars and then only a necessary subset of bars is shown? I hope it is clear that the start of the first tick bar has direct impact on all other following tick bars as each consecutive (e.g. 1000) ticks are consolidated into one bar -> changing the start of the first tick bar would change all other bars as well.
- Is the “flow” of tick bars reset each day (or each week or at all) at 00:00 UTC? What I mean with that: For example, if the timeframe is 1000 ticks and it is 23:59 UTC and the current tick bar contains 77 ticks – is a new tick bar started at 00:00 UTC regardless of the current tick bar only containing 77 ticks or is this ignored at all -> which means that the current tick bar is filled with 1000 ticks, ignoring the fact that a new day/week/month has started? I think it gets clear that this point has also strong impact on the overall structure of tick bars.
- I stream IG tick data directly from their API and in very rare cases I get ticks with only a timestamp and volume, but no bid and ask and nothing else. Are these ticks counted as a full-fleged tick for a tick bar in ProRealTime (increasing the count of collected ticks in the current tick bar, reducing the count of ticks left for the current tick bar)?
I know these are really detailed questions but I haven’t found any ProRealTime documentation how tick bar timeframes are calculated in general nor was I able to determine by hand how these are calculated. So I hope to find some clarity here.
Thanks in advance for any answers and best regards!
Hi Artur,
I don’t have ready answers to your questions. But what I do know is that the ticks from IG are “calculated” from volume or something. So they are no real ticks.
Hopefully others know more.
Regards,
Peter
 JS
JSParticipant
Veteran
Hi @Artur
Tick data is independent of time…
There is no relationship between tick data and a (certain) time frame…
What ambiguities have you encountered?
- When you select a certain number of ticks (for example 1000 ticks) then from these 1000 ticks a candlestick can be formed with an Open / High / Low / Close…
The number of selected units then displays the amount of candlestick displayed in your screen…
The formation of the candlestick always starts with the first tick…
- Nothing needs to be reset in time because the tick data has no relation to time…
Tick data is independent of time…
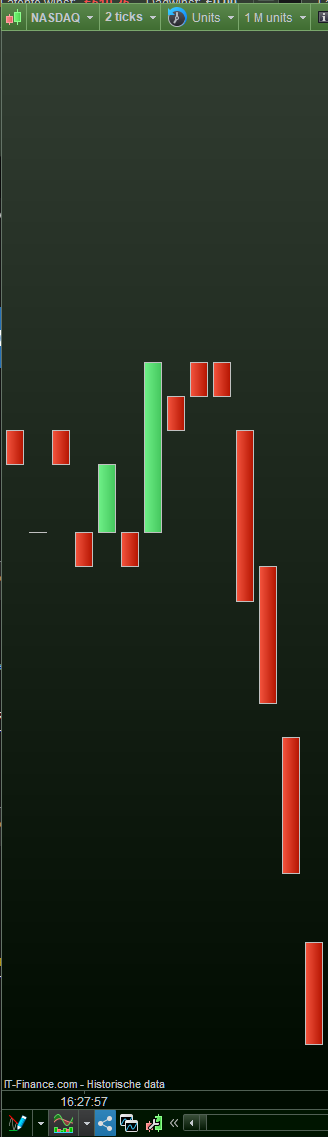
This is the relation to time. It is the very first (build up of) tick data. Thus, my chart is scrolled all the way to the left.
What Artur (IMO justified) says is that when this chart is asked for somewhat later (restart PRT), then e.g. the 10th bar you see will be different (of length-of-ticks). It may be the 2nd bar then, but it will be different now. Or it
should be different …
Then maybe somewhat more towards the question :
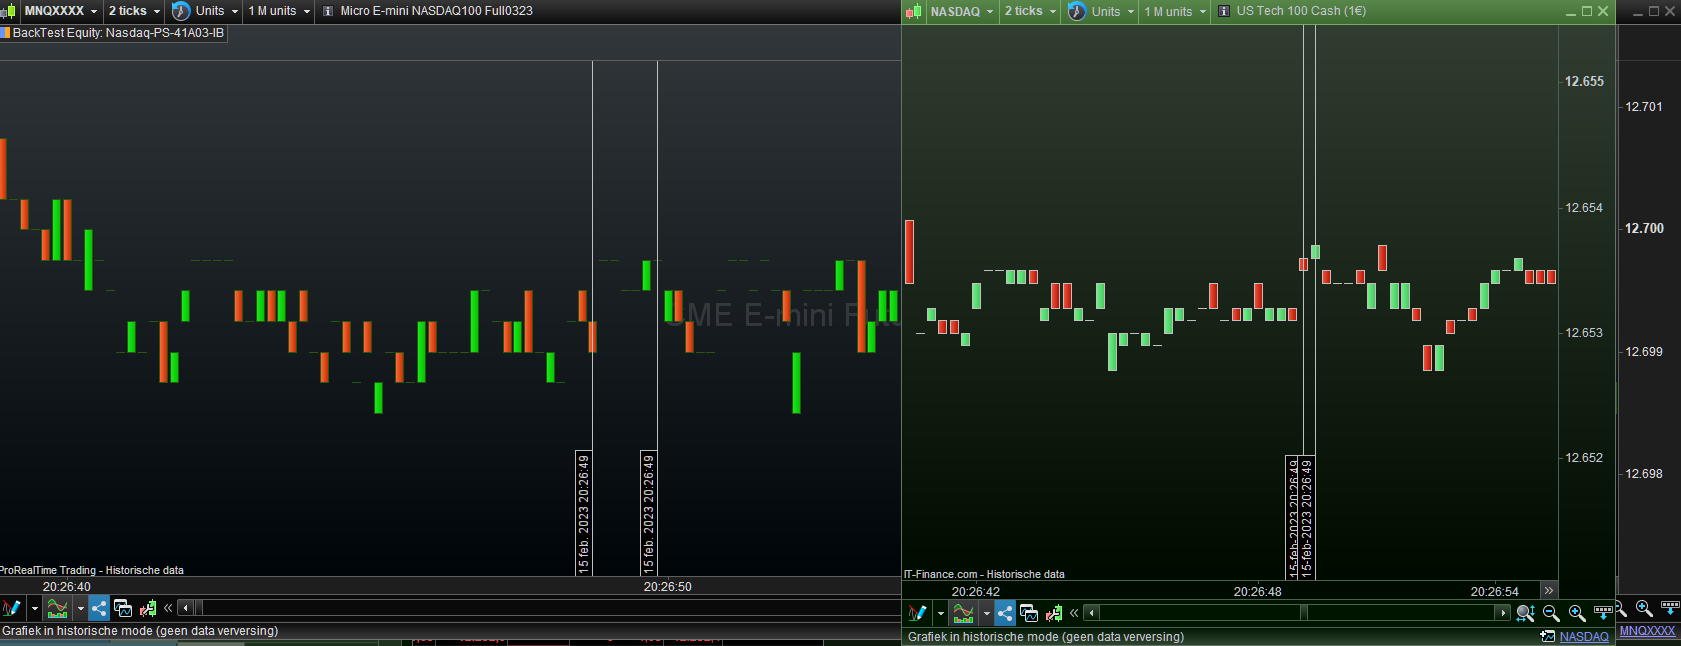
Left is IB, right is IG. Vertical scaling distance is the same (points of both same underlaying instruments are not equal anyway).
I put vertical lines on the first and last tick within the same second (randomly chosen).
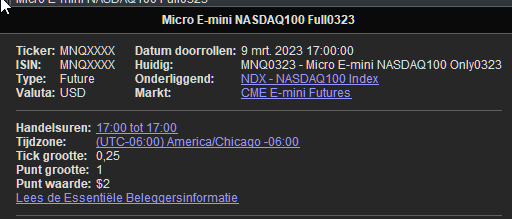
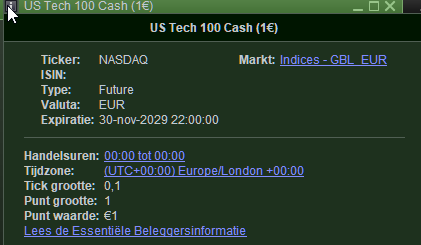
With some imagination you can see the difference in the bar lengths on both charts is 1 tick or 2 ticks (charts are both set to 2 ticks), or 0 ticks. But there is no resemblance in the two charts (IB vs IG). N.b.: Comparison is not all the way easy because IB uses a tick size of 0.25 and IG uses a tick size of 0.1.
For me IB is the better truth; IG just does what it likes (trading with itself) and this can be seen when the tick data charts are compared (IG bears way many more ticks).
Hi @Artur
Tick data is independent of time…
There is no relationship between tick data and a (certain) time frame…
What ambiguities have you encountered?
- When you select a certain number of ticks (for example 1000 ticks) then from these 1000 ticks a candlestick can be formed with an Open / High / Low / Close…
The number of selected units then displays the amount of candlestick displayed in your screen…
The formation of the candlestick always starts with the first tick…
- Nothing needs to be reset in time because the tick data has no relation to time…
Hi
@JS
I only called it “timeframe” because the tick bar representation setting resides in the same tab as all other (time-interval based) timeframes and overall a series of tick bars is still a time series (however, often with unequal time intervals per bar).
Let’s say I have a chunk of 10500 ticks and want to generate 1000 ticks tick bars: now I have two options:
- starting at the first tick (1) and building tick bar buckets (with 1000 ticks each) from “left to right” to calculate OHLC from
- starting at the last tick (10500) and building tick bar bucktes (with 1000 ticks each) from “right to left” to calculate OHLC from
The results will be different as in 1. I will end up with 500 ticks in the last bar and in 2. I will end up with 500 ticks in the first bar (as I split the ticks into 1000 ticks from right to left in this case). All tick bars in between will be different as well if one compares option 1 with option 2.
So
@PeterSt is right that the “origin” matters. There can also be the case that I use a chunk of 6300 ticks now for example. Even if these ticks are a subset of the previous 10500 chunk and even if I still use 1000 ticks per bar again, the resulting tick bars can be vastly different when calculated on the 6300 ticks chunk instead of the 10500 ticks chunk (as my starting point (“origin”) to devide the chunk into tick bars can easily be different).
So I’m wondering if ProRealTime has a general solution to these issues internally and how it is solved so that I can replicate it for my own software ecosystem. – That’s why I also mentioned the 00:00 UTC stuff: to remove the ambiguities, a solution might be to treat each day of tick data as an independent chunk of ticks to calculate tick bars on. Then the same tick bars can be generated no matter how much tick bars I want to show in a chart or how big the overall chunk of ticks is where the tick bars are calculated on.
I hope I made the ambiguities clear enough and wonder if ProRealTime tackles these or how else they approach the generation of tick bars.
I wonder whether something like
If NewDay and Time > 00:00 then
would work.
Possibly you will catch the first tick in that second and this would be unambiguous ?
But still … I don’t think AutoTrading is possible with Ticks as unit …
Is this a show stopper now ?
JSParticipant
Veteran
@PeterSt
What you show in your first screenshot are candlesticks that are made up of 2 ticks with an Open and Close. To be able to show the next candlesticks on your screen the graph is slide to the left but this has no relation to time…
There would be a relationship with time when each candlestick is formed within a certain time frame, for example, every minute a candlestick is formed…
The length of the candlestick only has to do with the price difference between the two ticks…
A candlestick of 1 tick does not exist, when you select 1 tick it is not possible to use the candlestick option…
Tick size of 0.25 or 0.1 ????
Tick data has no tick size…
@Artur
It is not that difficult, when you have 10500 ticks, first 10 candlesticks of 1000 ticks are drawn with an O/H/L/C… and the last candlestick (right) is forming…
The formation of candlesticks always runs from left to right…
Well, if it is done this way, it’s of course an “easy” solution. However, the problem with the starting point / origin of the tick bars remains: let’s say I have these 10500 ticks with 1000 ticks consolidated in a tick bar. Then, as you said, the last bar is currently made of 500 ticks. But: if I select a subset of these 10500 ticks now, let’s say tick 5300 to tick 8300 (so 3000 ticks), I will get 3 tick bars which don’t equal any of the bars generated from 10500 ticks. And that’s exactly my problem I’m trying to solve here: does ProRealTime not care about that or do they apply some additional tricks to make the generation of tick bars replicable (same tick bars even if the chunk of ticks is increased or decreased and the first tick changes)?
If there is no additional logic in place, the generation of tick bars is not really replicable as it fully depends on the chunk of ticks that is used: as soon as the chunk is changed in size (even slightly) or if I select a subset of this chunk as demonstrated, completely different tick bars are generated (which sometimes might be similar but not equal). The question is if this makes sense. If I got three tick bars of 1000 ticks each between 10am and 11am (because 3000 ticks appeared within the hour), and now append 1500 previous ticks to the LEFT (so ticks before 10am), then the tick bars between 10am and 11am change. Do I really want that and does ProRealTime do it in this way?
To make the example more clear, bars between 10am and 11am: 3000 = 1000 (A) + 1000 (B) + 1000 (C)
1500 previous ticks (before 10am) appended to the left: 4500 = 1000 (A’) + 1000 (B’) + 1000 (C’) + 1000 (D’) + 500 (E’)
C’, D’ and E’ still appear within 10am and 11am and half of B’ appear within 10am and 11am as well. However, using this “simple” technique to generate tick bars doesn’t allow me to reliably reconstruct A, B and C if the chunk of ticks changes. But usually I would like to get the same bars within a certain time interval, even if I change some settings, wouldn’t I?
But usually I would like to get the same bars within a certain time interval, even if I change some settings, wouldn’t I?
Usually maybe, but possible no. Unless you can force your chart to start at the exact same time always – which you can’t.
May I ask : what are you actually going to do with it, might we be able to find some sort of solution ?
There is no official ticks chart, so bars are built with the history loaded on your charts.