Bard
BardParticipant
Master
Hey Hasardeur,
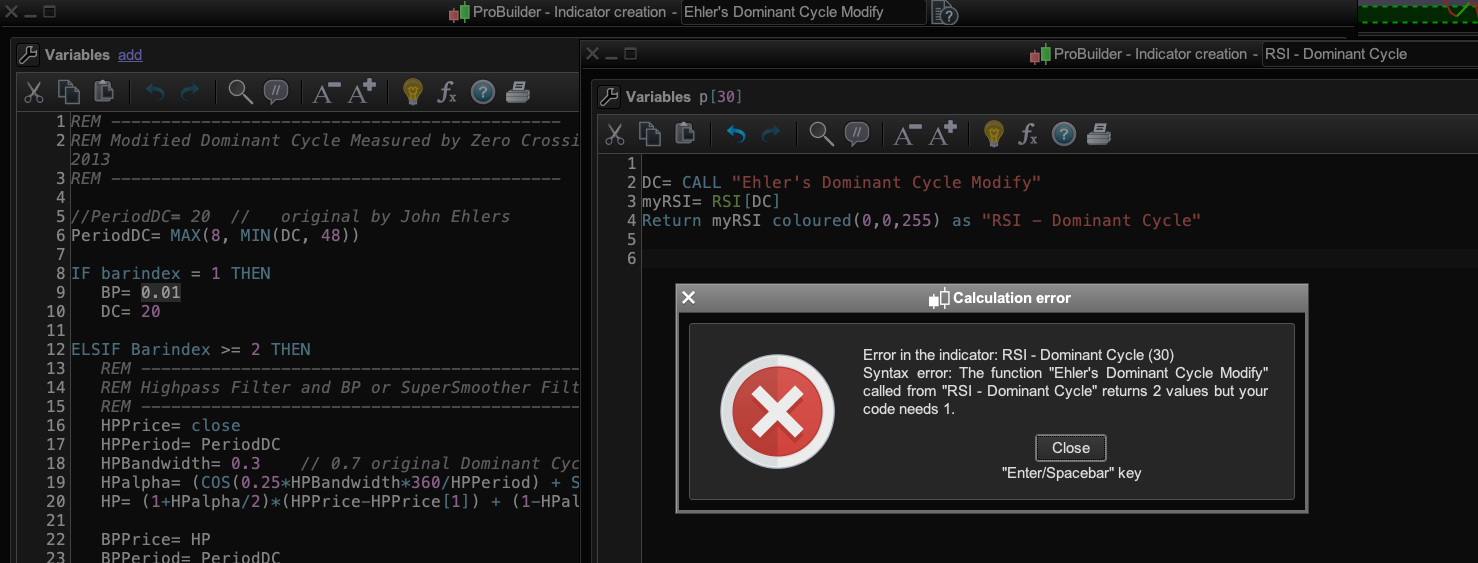
Thanks for the code, I get an error that your indicator returns two function but my new RSI indicator needs one? Pls see screenshot. I’ve tried adding [DC] to the the end of line 2 in my RSI and also the variations of values from you line 6.
I also took out the Return BP as Bandpass (please see screenshot RSI #2) but then get “a positive integer is expected” so I am still unsure how to get it to work. Any ideas!?
Cheers
Bard
Hallo Bard,
sorry about my typing error.
Please try as follows:
myRSI= RSI[DC](close)
Best Regards
Hasardeur
BardParticipant
Master
Great, thanks, I’ll give it a go tomorrow.
BardParticipant
Master
I found a moment just now to test it. I was wondering how would the RSI need to be coded if I wanted to keep the BP? .
(RETURN DC coloured(0,255,255) as “DomCyclePeriod”, BP coloured(255,0,0) as “BandPass”)
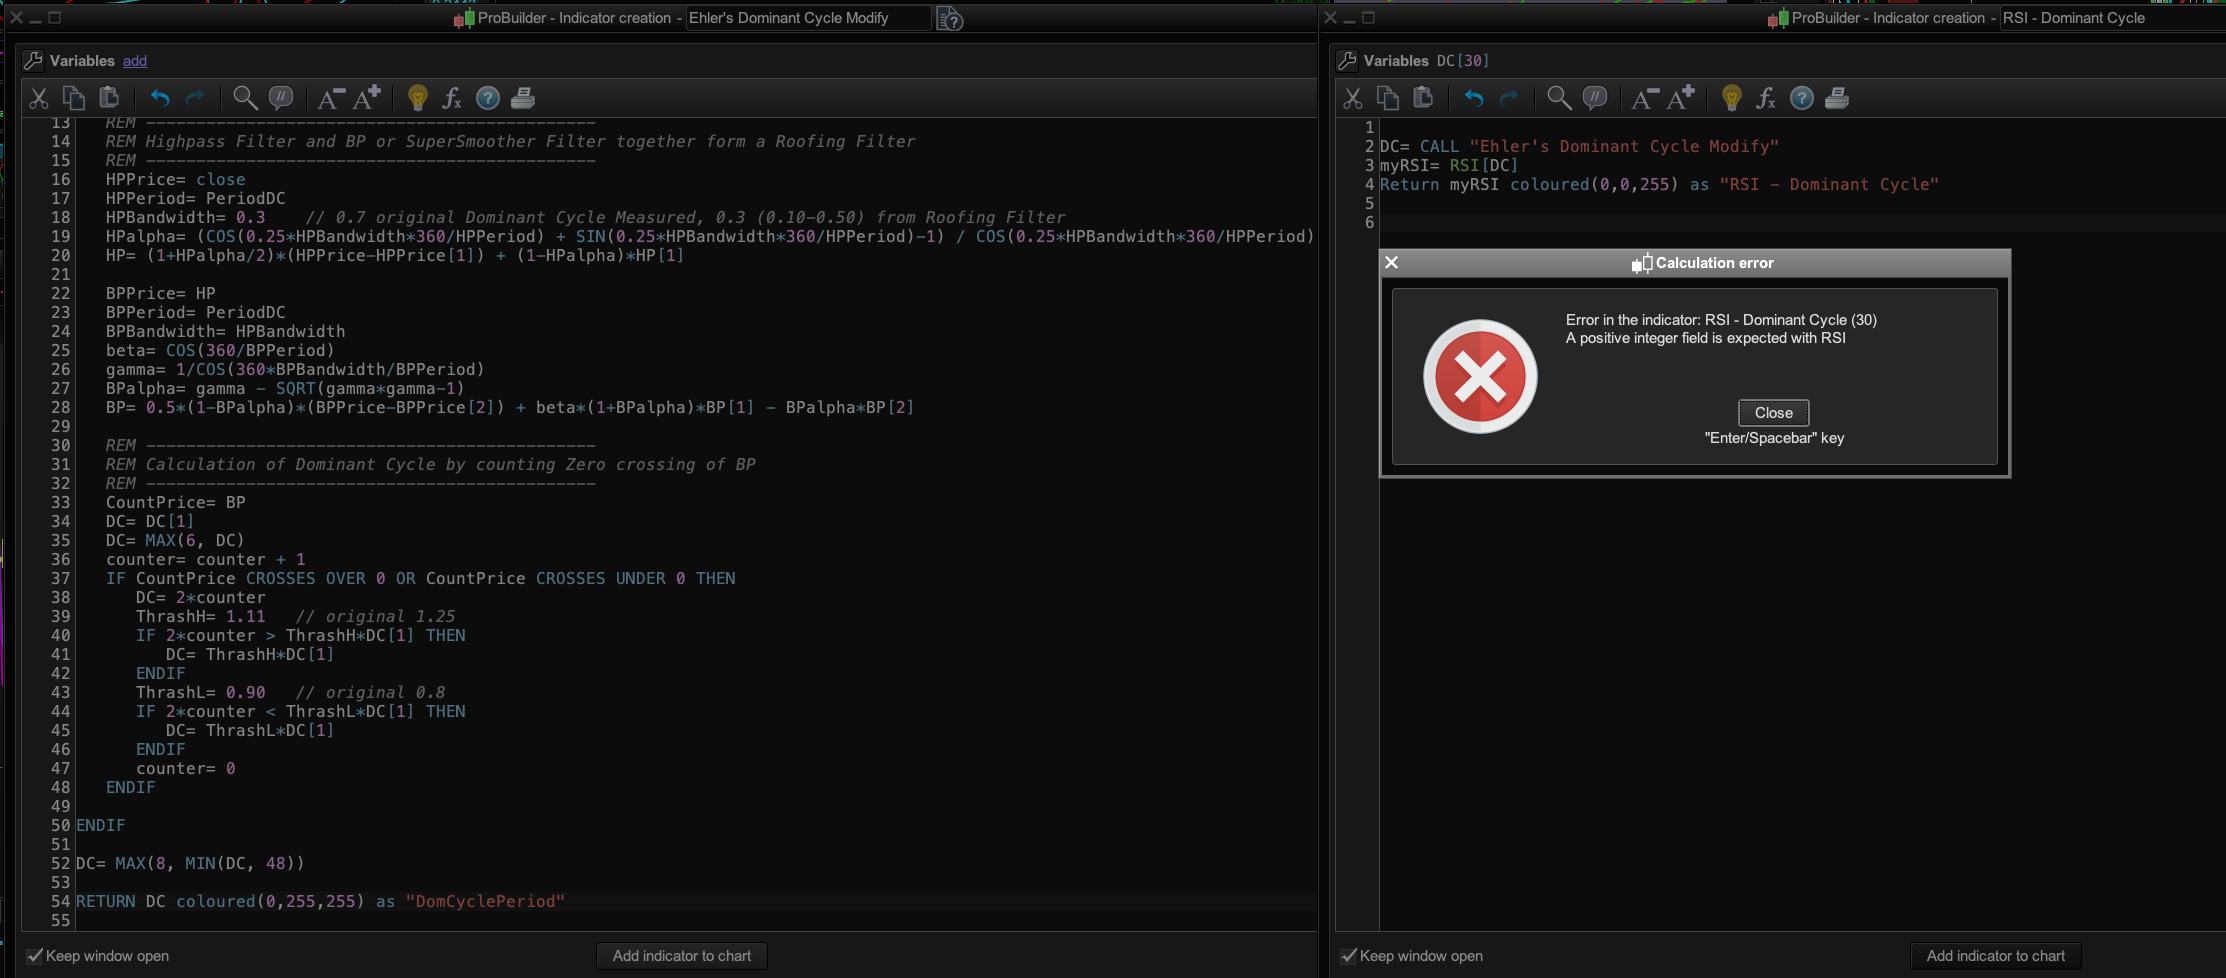
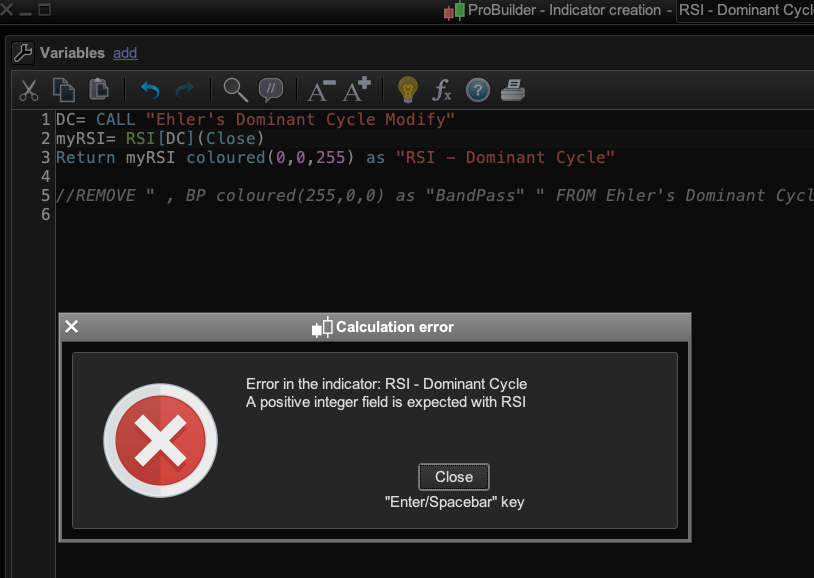
Also I still get the positive integer error even when I strip out the BP from your indicator and add (close)? Pls see screenshot:
Cheers.
Hi Bard,
you are right. If you code this in the “Ehlers dominant cycle” code you will see the BP and the DC.
I would be interested in your experiance with the “adaptive” behavior.
Best regards
Hasardeur
BardParticipant
Master
Hi Hasardeur,
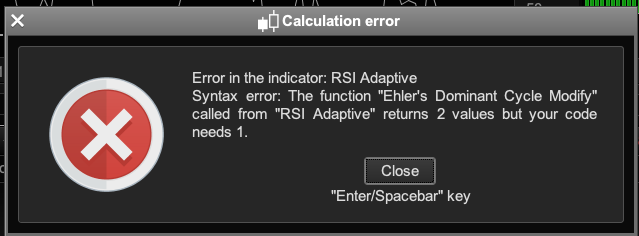
As explained I cannot get your code to work for an adaptive RSI. Please see my last comment.
Hi Bard,
try as follows
Period= CALL "Ehlers's Dominant Cycle"
DC= MAX(8, MIN(Round(Period),48) )
myRSI= RSI[DC](close)
Return myRSI coloured(0,0,255) as "RSIdc"
BardParticipant
Master
Thanks Hasardeur,
To get the Adaptive RSI to work I have to strip out Return BP part of the code from your Dominant Cycle Indicator to get the Adaptive RSI to work?
How can I have your original cycle indicator (with BP) AND an adaptive RSI? This code below works great – thanks.
Period = CALL "Ehler's Dominant Cycle Modify"
DC = MAX(8, MIN(Round(Period),48) )
myRSI = RSI[DC](close)
Return myRSI coloured(0,0
Cheers,
Bard
Hallo Bard,
its easy, the not used variable can be ignored.
You have to look which variable is first and second in your return of “Ehler’s Dominant Cycle Modify”.
depending by the position you are going to ignore the forst or second variable in you call as shown.
Period = CALL “Ehler’s Dominant Cycle Modify”<br />
DC = MAX(8, MIN(Round(Period),48) )<br />
myRSI = RSI[DC](close)<br />
Return myRSI coloured(0,0
Period, ignored = CALL "Ehler's Dominant Cycle Modify"
DC = MAX(8, MIN(Round(Period),48) )
myRSI = RSI[DC](close)
Return myRSI coloured(0,0, 255)
BardParticipant
Master
Thanks Hasardeur, For future reference there is a code insert button – please see image. From what I can see I posted a slightly wrong version above as the Return line 4 wasn’t complete with the colour code. Yes this same RSI code works but I thought I had to remove the BP from the Dominant Cycle indicator Return to get the RSI to work. I added the “BP Return” code back into your Dominant Cycle indicator today so I have the DC and BP lines showing in the Dominant Cycle indicator and when I go to add a new Adaptive RSI to other charts I am not getting the errors like the ones I posted earlier, so the new RSI code it definitely all good. Thanks!
I had a few questions about the DC indicator if you don’t mind? What did you find happened when the bandwidth was left at the original setting of 0.7? (HPBandwidth= 0.3 // 0.7 original Dominant Cycle Measured, 0.3 (0.10-0.50) from Roofing Filter). If I’ve interpreted the DC code correctly, it’s looking for cycle crossings of the BP to work out the number of periods in a full cycle?
How were the search periods of 8 periods to 48 decided? And why does the code have: DC= MAX(6, DC) but then later at the end: DC= MAX(8, MIN(DC, 48))?
How exactly is this varying period (DC) working within the RSI? Normally it’s looking for momentum and price changes over a fixed period but I suppose now it’s taking the most recent dominant cycle result and then using that number to work out the momentum and price changes and if they are overbought or oversold, right?
Thanks again for your help, I will let you know how I get on.
Cheers Bard.
Hallo Bard,
niche to hear that it is now working well.
The market theory is working in waves,
longer and smaller waves are showing the different frequency.
Frequency analyses by spectral calculations have shown that the dominant frequencies are roughly in a distance of a multiplicator at about 2.3 by starting at 6 to 8.
Example: 1.) DC=8 2.) DC=8*2.3= 18.4 3.) DC= 18.4*2.3= 42.3 4.) DC= 18.4*2.3= 97.3
You see that it is near to the fix used Periods of 20, 50, and 100.
In addition in the literature is said, that the different periods to use should have a distance factor of about 4 to 6 (DC=8*6 –>48).
The intention of the DC is to find out the actual main dominant period.
The Bandwidth is width of the interval in a frequency spectrum.
The job of the Band pass is to filter out frequences above and under the Dominant Cycle Period in order to get the main/core frequency only.
A HPBandwidth 0.7 will show the Bandpass including a lot of “noise”, so I set it to a for me logic parameter of 0.3 (you can test).
The code has a DC= MAX(6, DC)
1.) to get full harmonic waves below 8 in order to ensure a “correct” 8 crossing over signal.
2.) To ensure that we will not get a noisy frequency below 6.
3.) In order to reach the Nyquist frequency you can set it also to Ny=DC8/2=4 (please test).
I hope this is helpful for you.
Best regards
Hasardeur
BardParticipant
Master
Hi Hasardeur, Thanks very much for the explanations.
I unfortunately got the same waring back: Pls see image #1. All I did was add back the Return BP code in the DC indicator the other day and then when I launched the charts today the warning came back and PRT would not load the RSI indicator? The RSI only works if I take out the BP line on your DC indicator? Do you know what code is needed within the RSI indicator so I don’t have to keep deleting the BP Return code in your indicator? Thanks.
I got the RSI DC indicator loaded (by deleting the BP code) and added a standard RSI indicator and set the generic standard RSI indicator to 8 periods and they both match because this is what your DC indicator shows (Period = 8) for the weekly £/$ – pls see RSI Weekly image. All good!
I then set the £/$ to daily and your DC indicator showed 20 but the RSI DC looked pretty similar to the generic RSI which was still set to 8 periods. I thought the RSI DC would be different to the generic standard RSI… so… I set the standard RSI to 20 and they match perfectly! Pls see Daily image “Daily RSI = 20 v’s RSI DC (with external DC indicator = 20).”
Cheers again!
Hi Bard,
attached you will find the code for download.
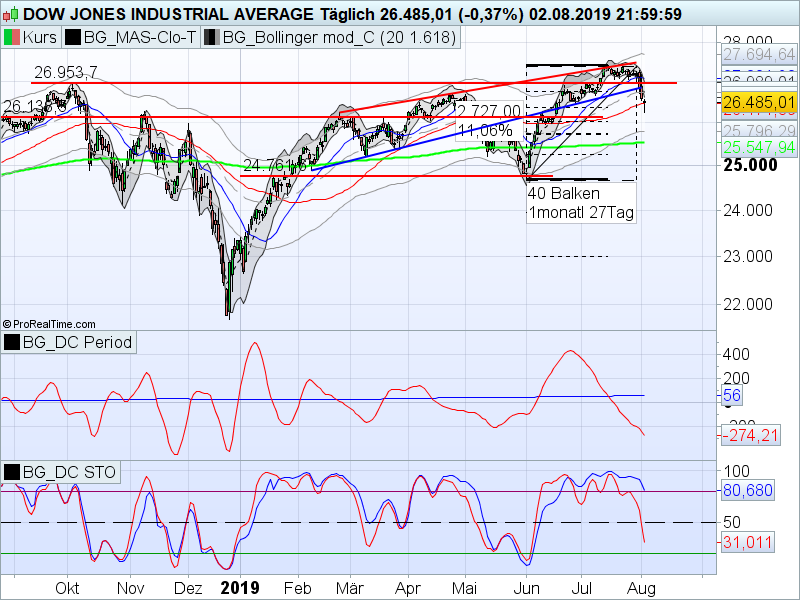
I have changed from sample RSI to STO because at STO you can better see the diffence between standart and DC STO.
Please dont forget to set the units in the chart (upper left corner) to 1k.
This is necessary to swing in the BP.
Best regards
Hasardeur
Here is the download.
The download will extract 2 files.
1.) BG_DC Period.itf
2.) BG_DC STO.itf
BardParticipant
Master
Hi Hasardeur,
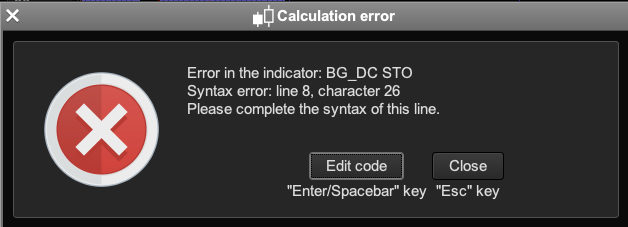
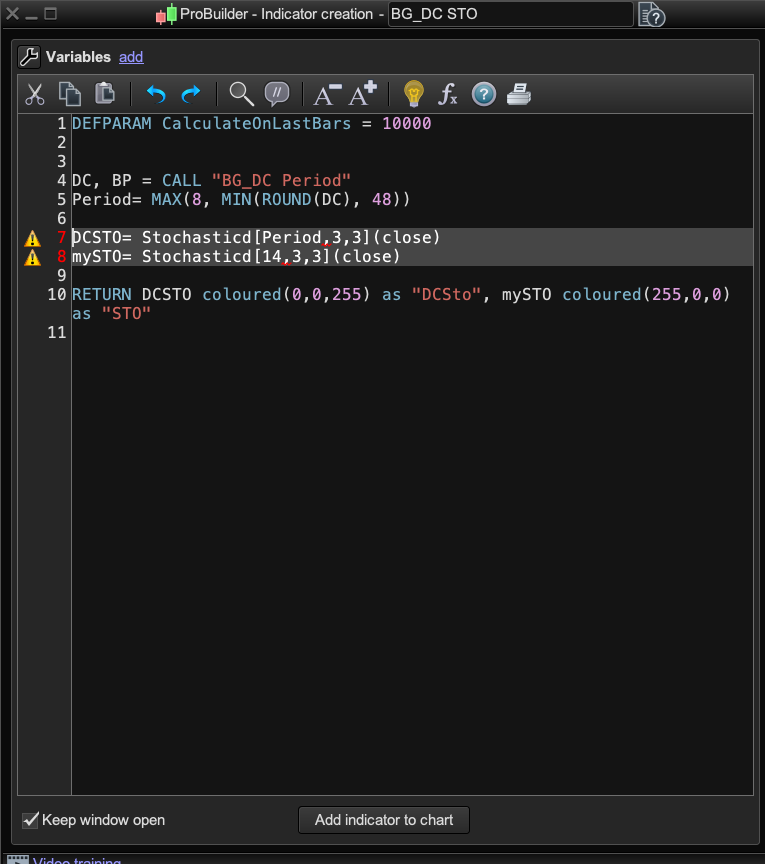
Thanks for the update. I set the units to 10,000. I get this error after importing and trying to install: Pls see images.
The syntax error is with these two lines and the commas:
DCSTO= Stochasticd[Period,3,3](close)
mySTO= Stochasticd[14,3,3](close)
Any ideas?
Cheers
Bard