//@version=4
study("Higher High Lower Low Strategy", overlay =true, max_lines_count = 500)
lb = input(5, title="Left Bars", minval = 1)
rb = input(5, title="Right Bars", minval = 1)
showsupres = input(true, title="Support/Resistance", inline = "srcol")
supcol = input(color.lime, title ="", inline = "srcol")
rescol = input(color.red, title ="", inline = "srcol")
srlinestyle = input(line.style_dotted, title = "Line Style/Width", options = [line.style_solid, line.style_dashed, line.style_dotted], inline ="style")
srlinewidth = input(3, title = "", minval = 1, maxval = 5, inline ="style")
changebarcol = input(true, title="Change Bar Color", inline = "bcol")
bcolup = input(color.blue, title ="", inline = "bcol")
bcoldn = input(color.black, title ="", inline = "bcol")

ph = pivothigh(lb, rb)
pl = pivotlow(lb, rb)

hl = iff(ph, 1, iff(pl, -1, na)) // Trend direction
zz = iff(ph, ph, iff(pl, pl, na)) // similar to zigzag but may have multiple highs/lows
zz :=iff(pl and hl == -1 and valuewhen(hl, hl, 1) == -1 and pl > valuewhen(zz, zz, 1), na, zz)
zz :=iff(ph and hl == 1  and valuewhen(hl, hl, 1) == 1  and ph < valuewhen(zz, zz, 1), na, zz)

hl := iff(hl==-1 and valuewhen(hl, hl, 1)==1 and zz > valuewhen(zz, zz, 1), na, hl)
hl := iff(hl==1 and valuewhen(hl, hl, 1)==-1 and zz < valuewhen(zz, zz, 1), na, hl)
zz := iff(na(hl), na, zz)

findprevious()=>  // finds previous three points (b, c, d, e)
    ehl = iff(hl==1, -1, 1)
    loc1 = 0.0, loc2 = 0.0, loc3 = 0.0, loc4 = 0.0
    xx = 0
    for x=1 to 1000
        if hl[x]==ehl and not na(zz[x])
            loc1 := zz[x]
            xx := x + 1
            break
    ehl := hl
    for x=xx to 1000
        if hl[x]==ehl and not na(zz[x])
            loc2 := zz[x]
            xx := x + 1
            break
    ehl := iff(hl==1, -1, 1)
    for x=xx to 1000
        if hl[x]==ehl and not na(zz[x])
            loc3 := zz[x]
            xx := x + 1
            break
    ehl := hl
    for x=xx to 1000
        if hl[x]==ehl and not na(zz[x])
            loc4 := zz[x]
            break
    [loc1, loc2, loc3, loc4]

float a = na, float b = na, float c = na, float d = na, float e = na
if not na(hl)
    [loc1, loc2, loc3, loc4] = findprevious()
    a := zz
    b := loc1
    c := loc2
    d := loc3
    e := loc4

_hh = zz and (a > b and a > c and c > b and c > d)
_ll = zz and (a < b and a < c and c < b and c < d)
_hl = zz and ((a >= c and (b > c and b > d and d > c and d > e)) or (a < b and a > c and b < d))
_lh = zz and ((a <= c and (b < c and b < d and d < c and d < e)) or (a > b and a < c and b > d))

plotshape(_hl, text="HL", title="Higher Low", style=shape.labelup, color=color.lime, textcolor=color.black, location=location.belowbar, offset = -rb)
plotshape(_hh, text="HH", title="Higher High", style=shape.labeldown, color=color.lime, textcolor=color.black, location=location.abovebar, offset = -rb)
plotshape(_ll, text="LL", title="Lower Low", style=shape.labelup, color=color.red, textcolor=color.white, location=location.belowbar, offset = -rb)
plotshape(_lh, text="LH", title="Lower High", style=shape.labeldown, color=color.red, textcolor=color.white, location=location.abovebar, offset = -rb)

float res = na, float sup = na
res := iff(_lh, zz, res[1])
sup := iff(_hl, zz, sup[1])

int trend = na
trend := iff(close > res, 1, iff(close < sup, -1, nz(trend[1])))

res := iff((trend == 1 and _hh) or (trend == -1 and _lh), zz, res)
sup := iff((trend == 1 and _hl) or (trend == -1 and _ll), zz, sup)
rechange = res != res[1]
suchange = sup != sup[1]

var line resline = na
var line supline = na
if showsupres
    if rechange
        line.set_x2(resline, bar_index)
        line.set_extend(resline, extend = extend.none)
        resline := line.new(x1 = bar_index - rb, y1 = res, x2 = bar_index, y2 = res, color = rescol, extend = extend.right, style = srlinestyle, width = srlinewidth)

    if suchange
        line.set_x2(supline, bar_index)
        line.set_extend(supline, extend = extend.none)
        supline := line.new(x1 = bar_index - rb, y1 = sup, x2 = bar_index, y2 = sup, color = supcol, extend = extend.right, style = srlinestyle, width = srlinewidth)

barcolor(color = iff(changebarcol, iff(trend == 1, bcolup, bcoldn), na))
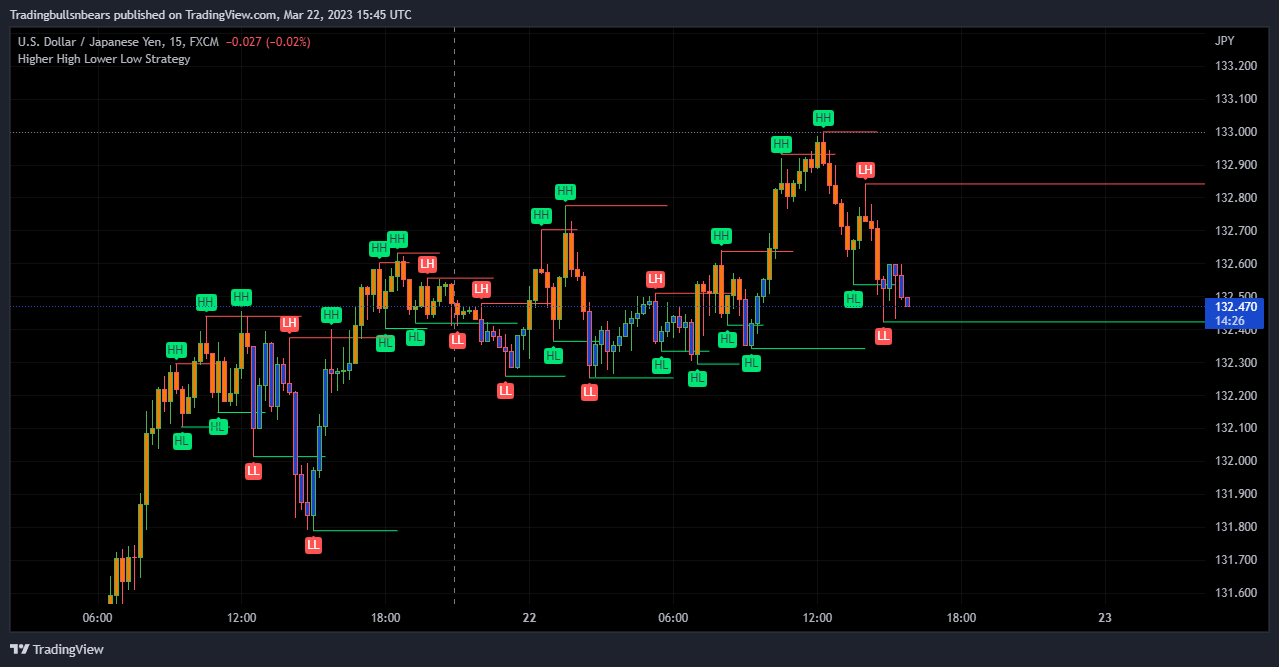
Hi Guys I am looking for an indicator / strategy like the one shown in the attachment, where the highs and lows are shown, along with an indication on direction when the highs or lows are first broken, by colouring the inside of the candle ( blue for short & Orange for long ) . I use this on another platform and wondered if it exsisted or could be produced ??
R’s S