Hello,
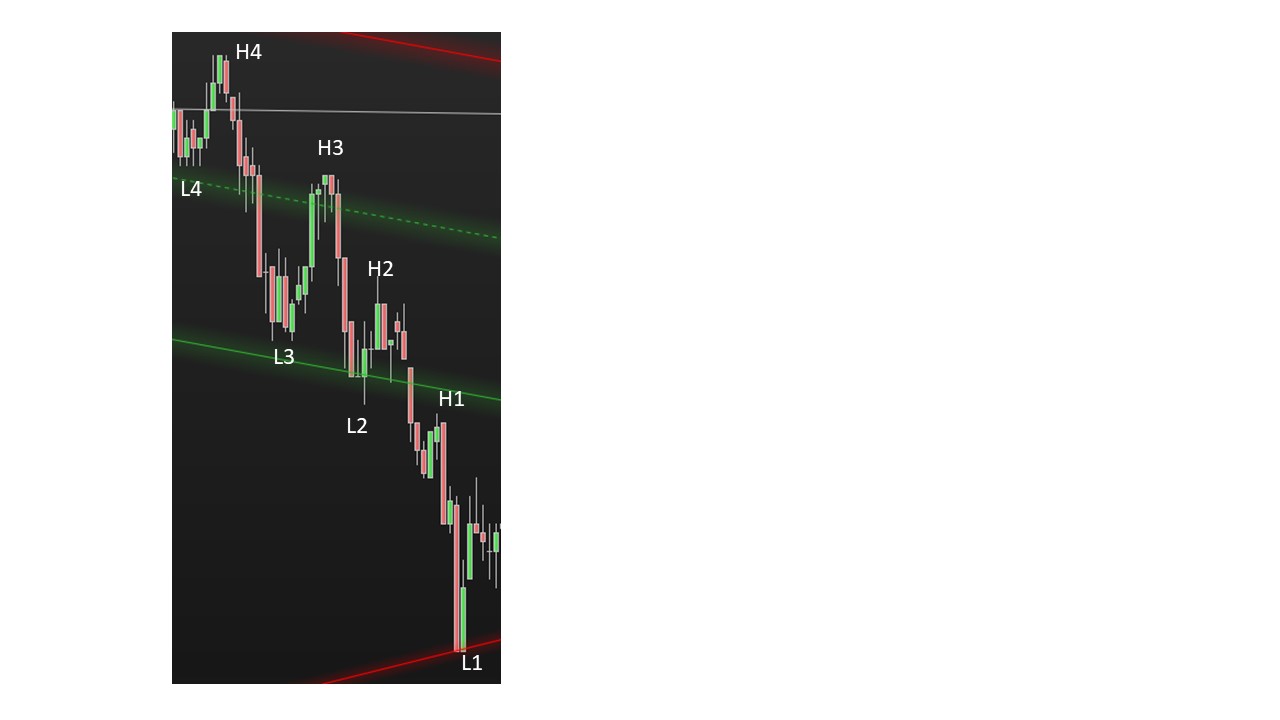
I am new to Pro Real Time but it looks really good so far. Does anyone know how to code an indicator that would track the last 4 Higher High, Lower Low values on a chart please based on the close price?
I have an attached image HHLL.jpg to show what I mean.
Thanks in advance
There you go:
DEFPARAM DrawOnLastBarOnly   = True
DEFPARAM CalculateOnLastBars = 1000
LookBack = 15
N        = 4
Idx      = 1
IF BarIndex = 0 THEN
   FOR i = 1 TO N
      $hh[i]    = 0
      $hhBar[i] = 0
      $ll[i]    = 0
      $llBar[i] = 0
   NEXT
ENDIF
Bullish  = close[Idx] > open[Idx]
Bearish  = close[Idx] < open[Idx]
Opposite = (Bullish[Idx] AND Bearish[Idx + 1]) OR (Bullish[Idx + 1] AND Bearish[Idx])
MyHI     = highest[LookBack](high[Idx])
MyLO     = lowest[LookBack](low[Idx])
NewHI    = summation[2](high[Idx] = MyHI) AND Bearish AND Opposite
NewLO    = summation[2](low[Idx]  = MyLO) AND Bullish AND Opposite
IF NewHI THEN
   FOR i = N DOWNTO 2
      $hh[i]    = $hh[i - 1]
      $hhBar[i] = $hhBar[i - 1]
   NEXT
   $hh[1]    = MyHI
   $hhBar[1] = BarIndex[Idx]
ENDIF
IF NewLO THEN
   FOR i = N DOWNTO 2
      $ll[i]    = $ll[i - 1]
      $llBar[i] = $llBar[i - 1]
   NEXT
   $ll[1]    = MyLO
   $llBar[1] = BarIndex[Idx]
ENDIF
FOR i = 1 TO N
   IF $hh[i] <> 0 THEN
      DrawText("H#i#",$hhBar[i],$hh[i] + range) coloured(0,128,0,160)
   ENDIF
   IF $ll[i] <> 0 THEN
      DrawText("L#i#",$llBar[i],$ll[i] - range) coloured(255,0,0,255)
   ENDIF
NEXT
RETURN
Thank you for the really quick response Roberto, I am excited to test this out and really grateful for your code. I think maybe my newness to the platform is an issue here but when I add this indicator to my chart it just creates a seperate panel in the bottom of the chart and it is completely black. Do you know if there is a way I can apply to the candlestick chart directly please? Thanks
You have to put it ON your chart, not below.
Click the PRICE tag on the upper left corner of your chart, then select properties, then ADD an indicator and select that indicator.
Thanks Roberto, that has allowed me to see the indicator now.
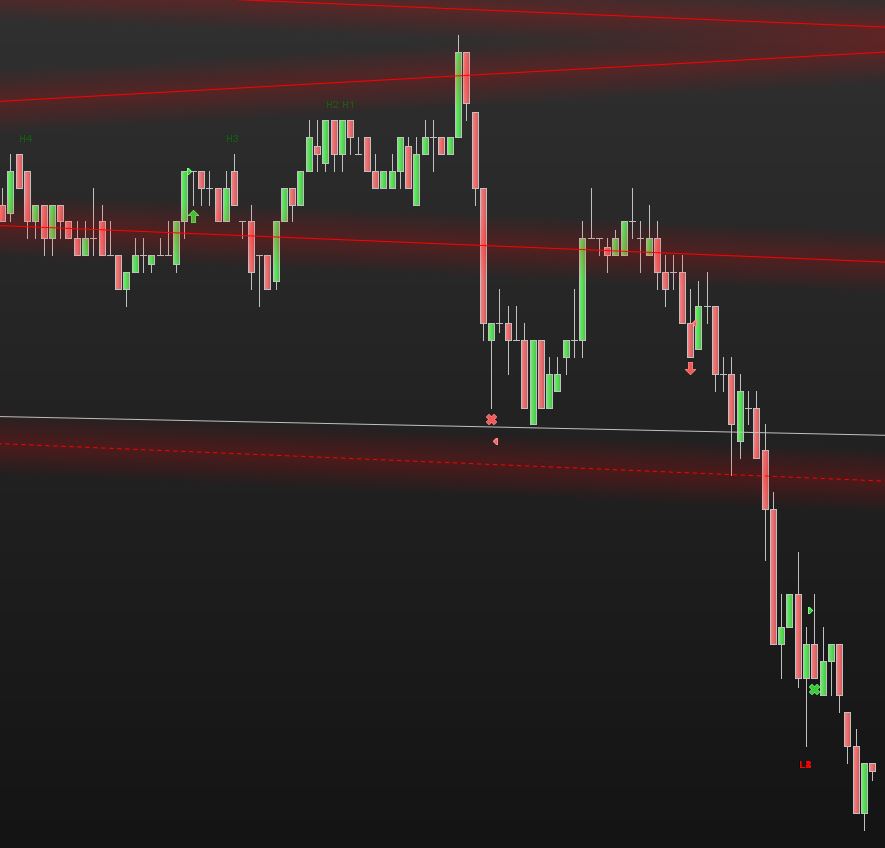
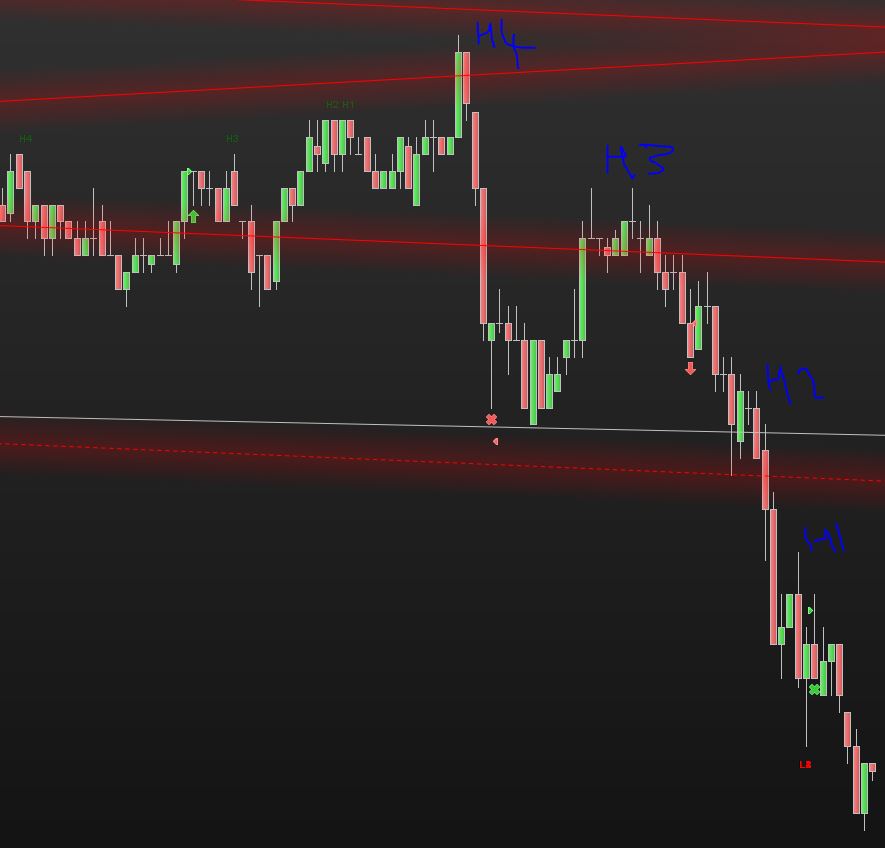
I am curious as to why I see the results sown in HH_1 attached, I was expecting to see the results in HH_2 (Blue mark up) attached, maybe it is a parameter I have set wrong?
DEFPARAM DrawOnLastBarOnly = True
DEFPARAM CalculateOnLastBars = 1000
LookBack = 100
N = 4
Many thanks for your help with this, really appreciated.
Hi Roberto,
I think I see what is happening now, it seems to only plot the HH when the market is going up and the LL when the market is going down, is this your understanding and I understand that to be true and valid?
I think that if we had the concept of Lower High (LH) and Higher low (HL) this would be the missing values when the market went up and went down?
When the market was going up you would have HH and LH
When the market was going down you would have LL and HL
Thanks once again, this is a great system and I can see how powerful people can develop trading systems
I’ll have a check at my code asap 😉
Can you define a HH and a LL, please?
When a new high can be identified a HH and when a new low can be identified as a LL? (shall they be preceded or followed by some pattern? are they allowed to occur one next to the previous?)
Hi Roberto,
Thanks for your response. For my explanation, I will use a line chart where each data point is the period close. I think there is an easier way for me to explain this using pictures rather than words. The attachement has some slides that you can view in order that will show what I am trying to acheive. Thanks for your help with this.
I’ll print and study your pics asap.
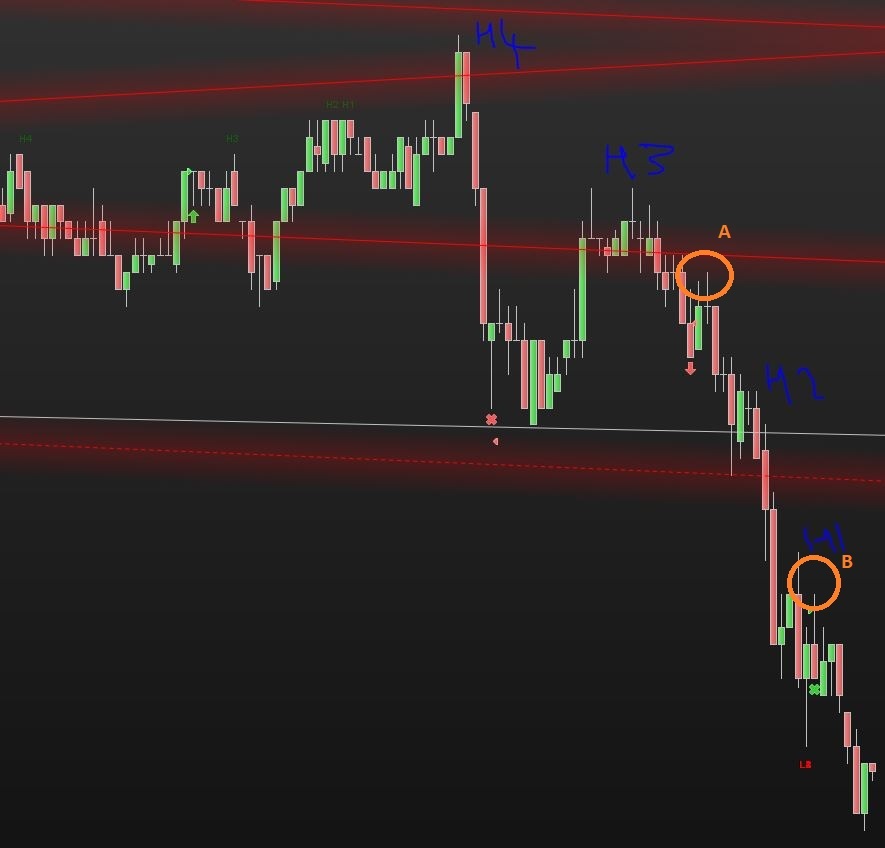
In the meantime I am attaching one of your first pics with points A and B highlighted. I need to know why point B is tagged as H1, while point A is not tagged.
Moreover, you only need to plot the latest 2 points for the Highs and 2 points for the Lows, not 4?
Hi Roberto,
With reference to your question – I need to know why point B is tagged as H1, while point A is not tagged. My thinking was that Point B has broken the previous low where the red X is on the chart. To be honest I dont want to be ambiguous in my requirements to you and want to make clear that I am new to this and stiff figuring out the requirements. I apologise for any confusion and will be much clearer going forward.
With reference to your question – you only need to plot the latest 2 points for the Highs and 2 points for the Lows, not 4? I do want 4 but for the purpose of illustration just gave 2 of each. the progression to H3, H4, L3, L4 would be the same logic / shift when 1 and 2 changed. I hope that makes sense, if not I will happily explain further for you?
many thanks for your interest and help with this work.
I am not asking you to be a coder.
I just want to know, when you are in front of yout chart, why do you tag a bar H1, H2, L1, L2, etc… I know it’s Higher Highs and Lower Lows, that’s exactly what I want you to define, what is a Higher High and what is a Lower Low? Maybe ANY candle above or below the previous one? or maybe when a new high or low is followed by a reversal candle?
Also new highs and lows must be higher or lower within a given number of bars or within the current day or else?
Hi Roberto,
I understand. Was my slide show useful to you in explaining the values that each variable HI, H2, L1, L2 gets as time goes forward?
These variables are only ever populated with the close value for any period, not the high or low value for a period, that is why I used a line chart to plot the close values.
Is that clear?
Thanks
I will describe the logic in words here to try and clarify your questions;
Evaluation happens on the every period close based on the closing price vs previous period closing price
I think these files should help to explain the logic better and we can maybe start with a vode sample for these rules and then I can explain the HH LL logic as we need to have this in place first.