Those looks great @grahal i’ll test them tomorrow! Maybe trying to diversify on some assetts.
@nonetheless your test is without tick by tick right?
Yes, it’s a nonsense. Refuses to run tick by tick.
//set Breakout
MA= CALL"Carver 1"[exponentialaverage[10](close)]
LongBO = CALL"Carver 1"[close >0.01 and close >  MA]
ShortBO= CALL"Carver 1"[close <-0.01 and close < MA]
Hello, There is an error on line 39 AND 40 the price cannot be less than 0. I would rather have written
//set Breakout
MA= CALL"Carver 1"
LongBO = MA >0.01
ShortBO= MA <-0.01
n=21

a = highest[n](high[0])
b = lowest[n](low[0])
c = (a+b)/2

scaledprice = (close-c)/(a-b)
//zero =0
return scaledprice as "scaled price"
There is an error on line 39 AND 40 the price cannot be less than 0. I
I did think same at first, but then convinced myself ( 🙁 ) that – as it was calling the Carver 1 on that same line of code – that Close refers to the Close of Carver 1??
But as ‘Close’ is a PRT Reserved Term then I guess you are correct?? How has such an error got perpetuated by us all on this Topic??
No wonder we found it difficult to understand how it was all working?? 🙂
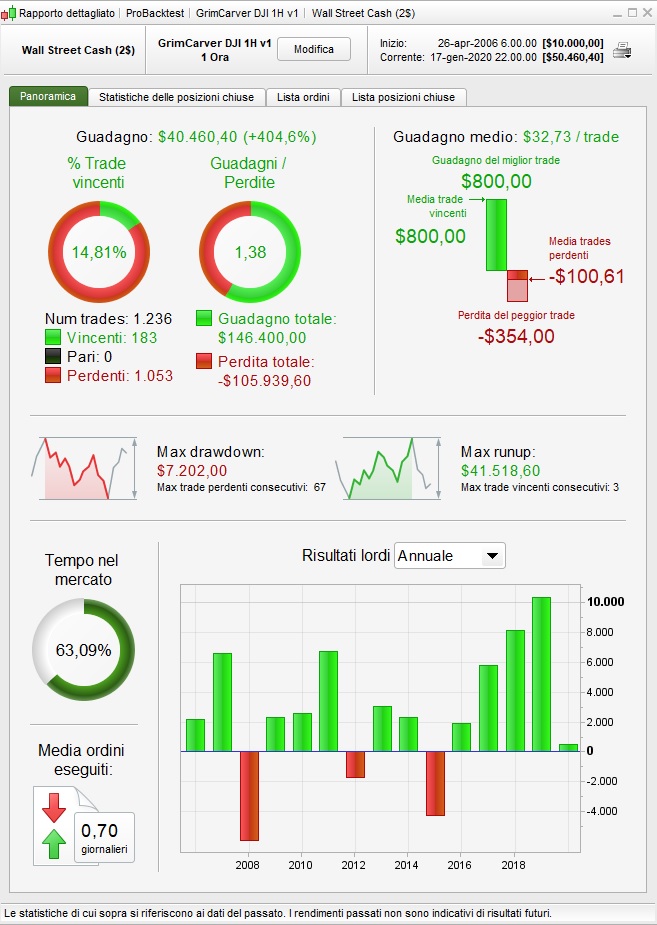
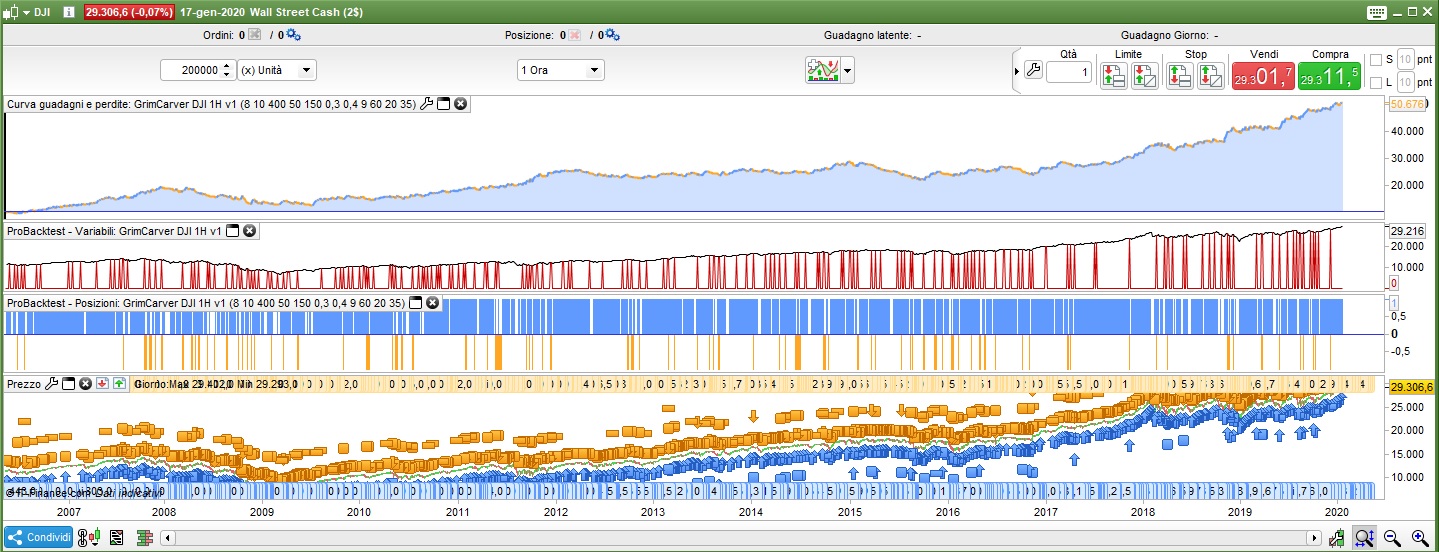
@grahal your two versions does not perform so well on 200K.
The 15 min version goes in bankrupt, and the 1h version is only optimized in the last years. Earlier, the curve is almost completely flat.
Earlier, the curve is almost completely flat.
That’s good and also understandable and maybe is a sign of potential?
I do not have 200k bars and so it would be good if you could optimise over 200k bars please?
All the variable values are set up in the optimiser and if you optimise 1 variable at a time it will run real quick so not a big onerous / time consuming task.
Thank You
Here’s the results of the optimization on 200k
Hey thanks for your work @Francesco
Could be worse … at least it stays above the water line / zero level over 200k bars.
Also it makes 40k over a period when buy and hold would have made 20k (DJI up from 10K to 30K)
Are you able to share the .itf file please then we will have the variable settings.
But if it’s a mither, it’s okay anyway as we can see the settings on your equity curve and these can easily fitted into a duplicate of my version here
https://www.prorealcode.com/topic/carver-hybrid-proorder-code/page/2/#post-117116
Thank You 🙂
Thks for your idea. Somebody understand why this working with high stock like BRK.A or AM but not with stock price low like BRK.B or FR for example ? I read the code but…
‘close’ was meant to pertain to the indicator value being above/below 0!
It must be as above else the strategy wouldn’t have given meaningful results if Close only refers to full normal Price Close??
What their risk range takes into account is the 3 major variables, being Price, Volume and Volatility.
Surely an Indicator must exist already? Money Flow Index (MFI) uses Price and Volume, can we add volatility in some way?
What about a SMA of MFI together with X standard deviation for inner and outer bands so as to make MFI perform like a Bollinger band?
We could do with one of our resident coding wizards spotting this to help us?
I have tried, and so far failed, to come up with an indicator that wraps around price, that takes these 3 variables into account,
What about keeping it simple and using two Indicators, combine them maybe … MFI for Price and Volume and one of the many in the Library showing Volatility, for example …
https://www.prorealcode.com/prorealtime-indicators/directional-volatility/
Hi GraHal
Apologies for tardy response as I have been away for week!
Yes, I agree something around that sounds good. I receive daily updates from the provider with a high and low for the risk ranges, so we could model something and if it comes close enough then I think it might be good. The issue comes with FX volumes not being centralised and maybe the issue of dark pool volumes not being reported for stocks maybe?