//@version=3
study(title=”Better X-Trend / Volume”,shorttitle=”BXT/BV”, overlay=true)
//Better Volume Indicator no tickvolume
//EasyLanguage Code Version 19 August 2012 Copyright http://www.Emini-Watch.com All rights reserved
//Better Volume Indicator
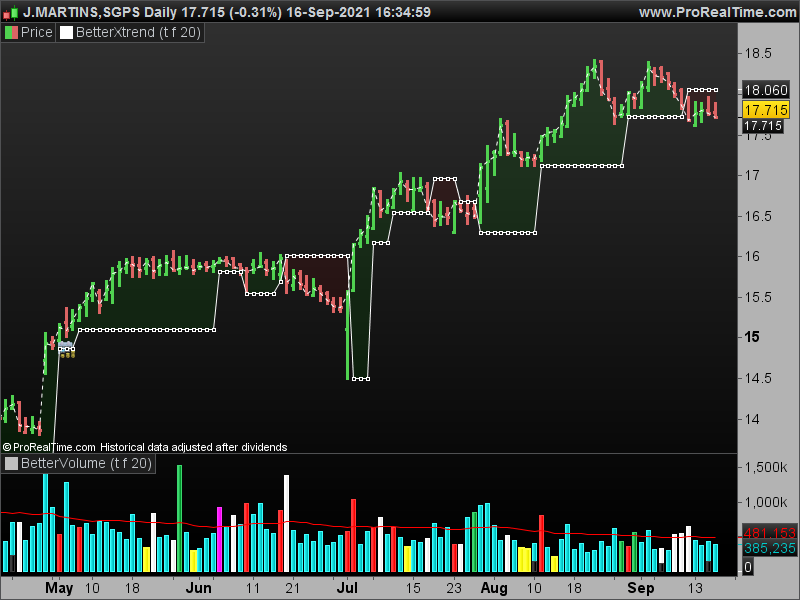
//http://emini-watch.com/the-better-x-trend-indicator/4408/
//http://emini-watch.com/free-stuff/volume-indicator/
enablebarcolors=input(false,title=”Enable bar colors”)
enablebaricons=input(true,title=”Enable bar icons”)
enabletrainline=input(false,title=”Enable bar Trainline”)
lowvol=input(true,title=”show low volume”)
climaxup=input(false,title=”show climax up”)
climaxdown=input(false,title=”show climax down”)
churn=input(true,title=”show churn”)
climaxchurn=input(false,title=”show climax churn”)
use2bars=input(true,title=”use 2 bars”)
lookback=input(20, type=integer, minval=1, maxval=100,title=”look back bars”)
range = high-low+0.000000001 // this way avoiding zero in the denominators
range2= (highest(high,2)-lowest(low,2))+0.000000001
value1=na
value1:= close > open and range != 0 ? (range/(2*range+open-close))*volume : value1
value1:= close < open and range != 0 ? ((range+close-open)/(2*range+close-open))*volume: value1
value1:= close == open ? 0.5*volume:value1 //value1 is up volume
value2 = volume-value1 //value2 is down volume
//using only one bar
value3 = abs(value1+value2)
value4 = value1*range
value5 = (value1-value2)*range
value6 = value2*range
value7 = (value2-value1)*range
value8 = value1/range
value9 = (value1-value2)/range
value10 = value2/range
value11 = (value2-value1)/range
value12 = value3/range
// Using two bars
value13 = use2bars?( value3+value3[1]):na
value14 = use2bars?(value1+value1[1])*range2:na
value15 = use2bars?(value1+value1[1]-value2-value2[1])*range2:na
value16 = use2bars?(value2+value2[1])*range2:na
value17 = use2bars?(value2+value2[1]-value1-value1[1])*range2:na
value18 = use2bars ? (value1+value1[1])/range2:na
value19 = use2bars ? (value1+value1[1]-value2-value2[1])/range2:na
value20 = use2bars ? (value2+value2[1])/range2:na
value21 = use2bars ? (value2+value2[1]-value1-value1[1])/range2:na
value22 = use2bars ? value13/range2:na
// one bar conditions
condition1 = value3 == lowest(value3,lookback)
condition2 = value4 == highest(value4,lookback) and close > open
condition3 = value5 == highest(value5,lookback) and close > open
condition4 = value6 == highest(value6,lookback) and close < open
condition5 = value7 == highest(value7,lookback) and close < open
condition6 = value8 == lowest(value8,lookback) and close < open
condition7 = value9 == lowest(value9,lookback) and close < open
condition8 = value10 == lowest(value10,lookback) and close > open
condition9 = value11 == lowest(value11,lookback) and close > open
condition10 = value12 == highest(value12,lookback)
// two bar conditions
condition11 = use2bars and value13 == lowest(value13,lookback)
condition12 = use2bars and value14 == highest(value14,lookback) and close > open and close[1] > open[1]
condition13 = use2bars and value15 == highest(value15,lookback) and close > open and close[1] > open[1]
condition14 = use2bars and value16 == highest(value16,lookback) and close < open and close[1] < open[1]
condition15 = use2bars and value17 == highest(value17,lookback) and close < open and close[1] < open[1]
condition16 = use2bars and value18 == lowest(value18,lookback) and close < open and close[1] < open[1]
condition17 = use2bars and value19 == lowest(value19,lookback) and close < open and close[1] < open[1]
condition18 = use2bars and value20 == lowest(value20,lookback) and close > open and close[1] > open[1]
condition19 = use2bars and value21 == lowest(value21,lookback) and close > open and close[1] > open[1]
condition20 = use2bars and value22 == highest(value22,lookback)
//Classifying the bars using one bar conditions, or using both one bar and two bar conditions simultaneosly if “use2bars” button selected.
lowvolume = (condition1 or condition11)
climaxupvolume = (condition2 or condition3 or condition8 or condition9 or condition12 or condition13 or condition18 or condition19)
climaxdownvolume = (condition4 or condition5 or condition6 or condition7 or condition14 or condition15 or condition16 or condition17)
churnvolume = (condition10 or condition20)
climaxchurnvolume = (condition10 or condition20) and (condition2 or condition3 or condition4 or condition5 or condition6 or condition7 or condition8 or condition9 or condition12 or condition13 or condition14 or condition15 or condition16 or condition17 or condition18 or condition19)
val=climaxchurn and climaxchurnvolume? 1 : lowvol and lowvolume? 2:climaxup and climaxupvolume?3:climaxdown and climaxdownvolume?4:churn and churnvolume?5:6
bcolor=climaxchurn and climaxchurnvolume? purple : lowvol and lowvolume? orange:climaxup and climaxupvolume?red:climaxdown and climaxdownvolume?black:churn and churnvolume?blue:green
plotshape(enablebaricons==true and val==1 ? 1:na,location=location.abovebar, title=”Climax Churn”, style=shape.diamond, color=purple)
plotshape(enablebaricons==true and val==2 ? 1:na,location=location.belowbar, title=”Low Volume”, style=shape.circle, color=orange)
plotshape(enablebaricons==true and val==3 ? 1:na,location=location.belowbar, title=”Climax Up volume”, style=shape.triangleup, color=red)
plotshape(enablebaricons==true and val==4 ? 1:na,location=location.abovebar, title=”Climax Down volume”, style=shape.triangledown, color=black)
plotshape(enablebaricons==true and val==5 ? 1:na,location=location.abovebar, title=”Churn”, style=shape.square, color=blue)
barcolor(enablebarcolors ? bcolor : na)
trend=1
supplyline=high
supportline=low
trend:=barstate.isfirst?1:close>nz(supplyline[1])?1:close<nz(supportline[1])?-1:nz(trend[1])
supplyline:= trend==1?
climaxdownvolume?
highest(2)
:
high>supplyline[1]?
high
:
supplyline[1]
:
climaxdownvolume?
highest(2)
:
supplyline[1]
supportline:= trend==-1?
climaxupvolume?
lowest(2)
:
low<supportline[1]?
low
:
supportline[1]
:
climaxupvolume?
lowest(2)
:
supportline[1]
trailing=trend==1?supportline:supplyline
plot(enabletrainline?trailing:na,title=”trailline”,color=trend==1?red:black,linewidth=1,transp=60)