Hello Nicolas,
For the Volume indicator example you gave in the first page , I try to adapt it for my need without success.
I try to reset the array after every new bar in order to separate the volume of each bar.
I tried with “Barindex”, “intradaybarindex” without success.
Here is my last code
once Barref=IntradayBarIndex
if IntradayBarIndex > Barref then
Barref=IntradayBarIndex
$upvol[0]= 0
$dnvol[0]= 0
endif
if islastbarupdate then
if close>$lastclose[0]then
$upvol[0]=$upvol[0]+volume
elsif close<$lastclose[0] then
$dnvol[0]=$dnvol[0]+volume
endif
$lastclose[0]=close
delta=($upvol[0]-$dnvol[0])
endif
avg=average[10](delta)
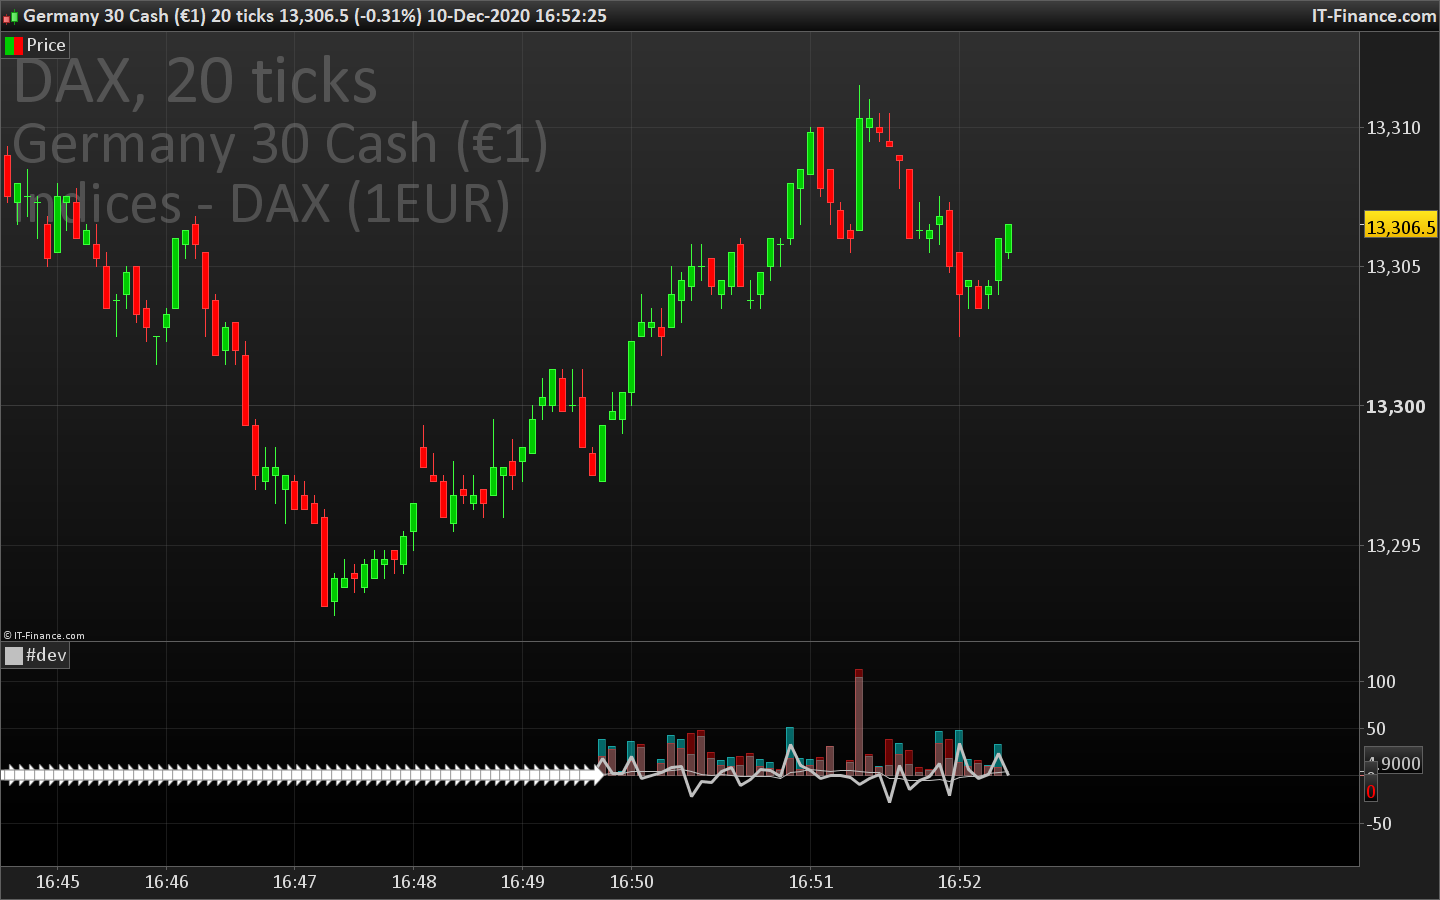
return $upvol[0] coloured(0,255,255,100) style(histogram) as "up volumes", $dnvol[0] coloured(255,0,0,100) style(histogram) as "down volumes", delta style(line,3), avg
Do you have any advice ?
Regards
I don’t know why but Intrabarindex is not working for the barindex comparison, I replaced it with BARINDEX:
if BarIndex > $Barref[0] then
$Barref[0]=BarIndex
$upvol[0]= 0
$dnvol[0]= 0
endif

if islastbarupdate then
if close>$lastclose[0]then
$upvol[0]=$upvol[0]+volume
elsif close<$lastclose[0] then
$dnvol[0]=$dnvol[0]+volume
endif
$lastclose[0]=close
delta=($upvol[0]-$dnvol[0])
endif
avg=average[10](delta)

return $upvol[0] coloured(0,255,255,100) style(histogram) as "up volumes", $dnvol[0] coloured(255,0,0,100) style(histogram) as "down volumes", delta style(line,3), avg
It works correctly now, the values are reset on each new bar.
Perfect, thank you very much Nicolas
Hi Nicholas
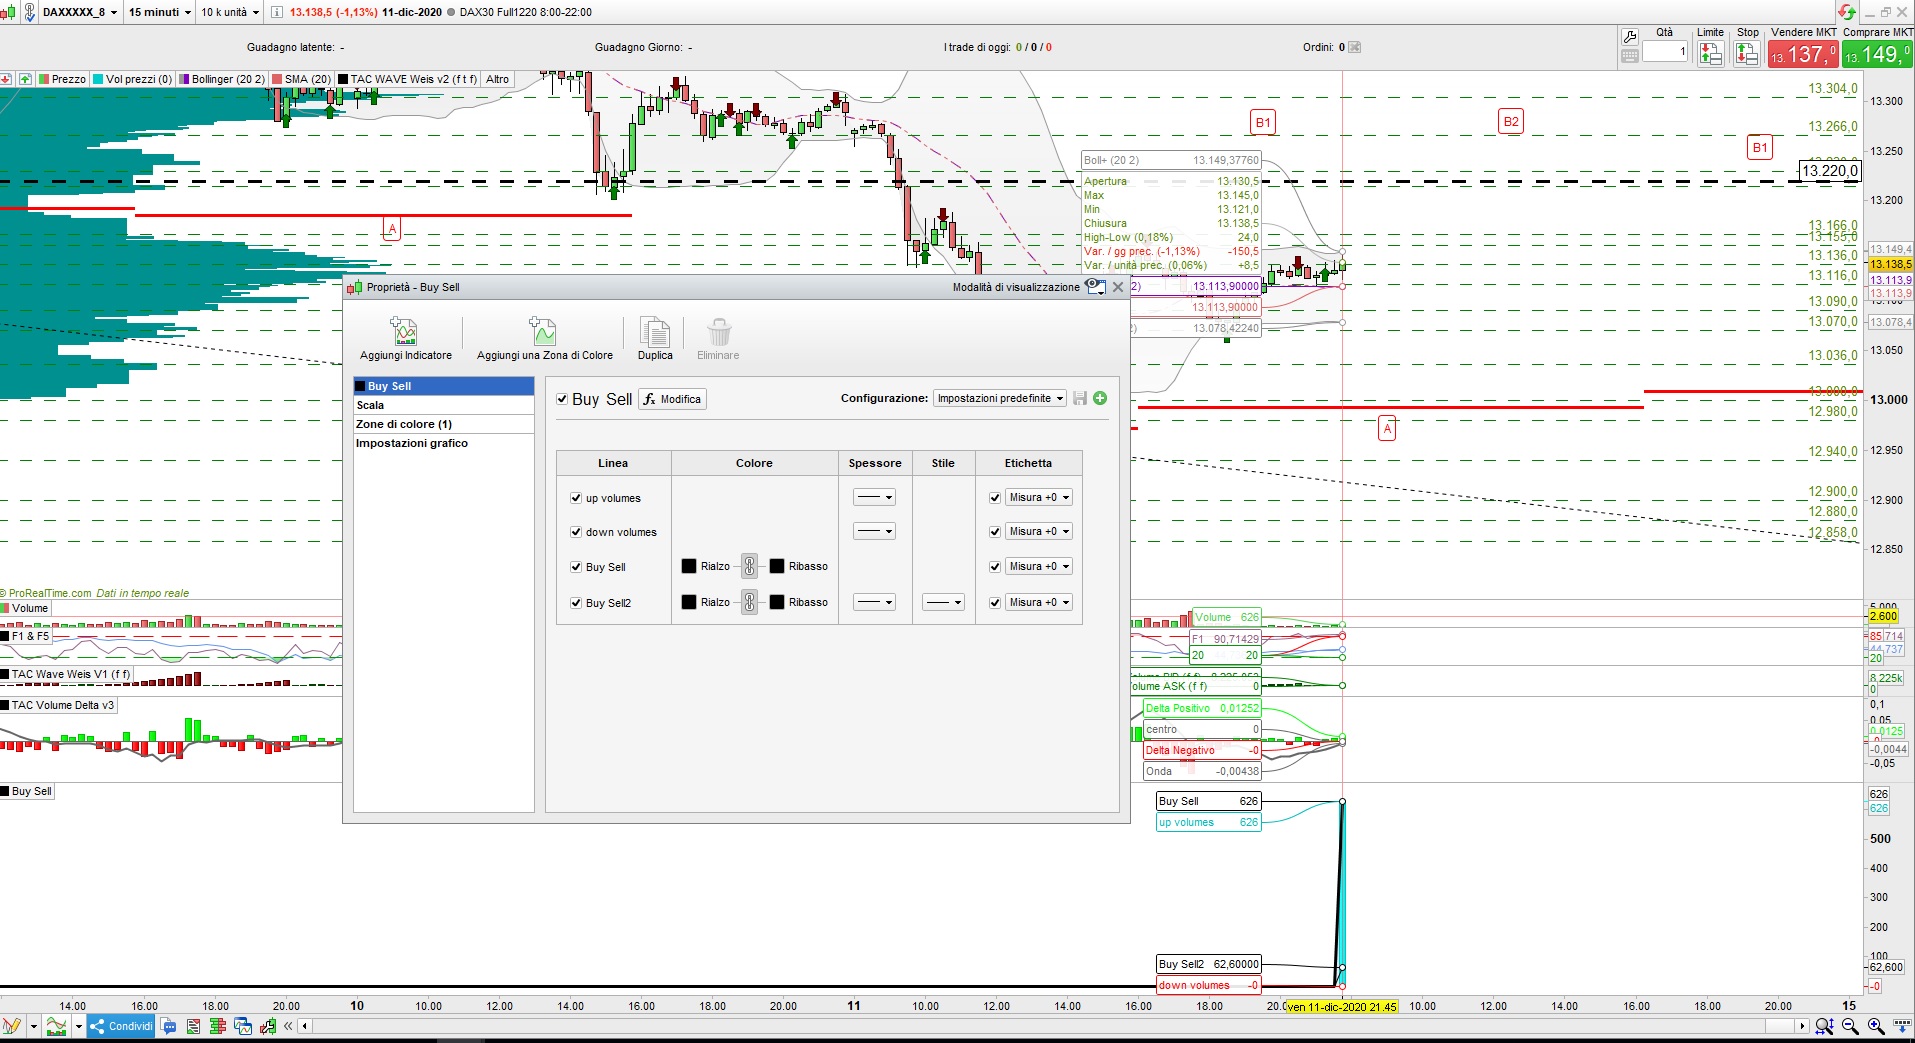
I tried your code at the first page “Example #3: separate buy/sell volumes on the same candle” but the result is completly different? Have you got any idea?
Thanks
It is not different, it needs real time data to correctly get the buy/sell pressure, it is not possible to do the same back in history.
Many thanks dear Nicolas for your never ending zest and passion in what you do and thereby helping others.
Hi, is it possible to define an array with multiple values? For example, if you want to save the array with known data.
For example:
$array = {“1”, “2”, “3”}
Or do you have to assign values to the array one by one?
Multi dimensional arrays are not currently available in PRT but they are hopefully in the pipeline.
At the moment the only work around is to use for example location 123 to be location (1,2,3) and then use multiplication,division and rounding as required to get the info stored at that location.
location = 0
if opendayofweek = 1 then
location = location + 100
endif

if openhour = 2 then
location = location + 20
endif

if openminute = 3 then
location = location + 3
endif

$myarray(location) = close
mylocation = 0

mylocation = mylocation + (opendayofweek * 100)
mylocation = mylocation + (openhour * 10)
mylocation = mylocation + openminute * 10

a = $myarray(mylocation)[1]

return a as "value this time last week"
Thanks a lot for the quick response. I am not sure I understand this workaround, at least the retrieving part doesn’t make much sense as you are rewriting the mylocation value. However, in my query I was referring to one-dimension arrays, i.e. I want to be able to define them at the beginning of the script, with the first positions filled in, kind of like a known table of values that I can use later on and loop through it.
A second, related question is, I noticed you cannot pass arrays as arguments to functions, correct? I am trying to do a simple moving average of an array that I have defined, but it throws a syntax error. For example:
$myArray[51] = 51

$myArray[0] = 0

Average[52]($myArray)
pablolo – Please be more careful when posting to follow the forum rules so that we keep a nice tidy forum. I tidied up your post.
- Be careful when quoting others in your posts. Only use the quote option when you need to highlight a particular bit of text that you are referring to or to highlight that you are replying to a particular member if there are several involved in a conversation. Do not include large amounts of code in your quotes. Just highlight the text you want to quote and then click on ‘Quote’.
An array is just a variable with multiple storage locations for values. You can get an average of the values at any location over the last p bars however what you are doing is not valid.
a = average[52]($myarray(12))
Sorry if these are all basic questions, but I can’t understand your last example.
I get an error when using parenthesis in your last example:
a = average[52]($myarray(12))
Shouldn’t it be like this?
a = average[52]($myarray[12])
And, if I am right, what’s the point of calculating an average of $myarray[12], when it is going to be the same value for all bars?
I am still not clear of how I can calculate an average of the last 52 values of my array. I’m guessing Average function only averages across bars, not array values, is that the case?
Moreover, if I use “[” in this example , I get a syntax error, that it is expecting a positive whole number for “SRC”, which I am not sure what it refers to, as I do not have any variable called “SRC”.
a = average[52]($myarray[12])
Yes my typo mistake – the correct syntax is with []
Yes AVERAGE[52] just takes the average value over the last 52 bars of whatever you put after the instruction.
One thing you have to consider if you are using arrays in indicators is that the latest bar is formed on the fly and will continuously fill your array every time a condition to add a value is met until the bar finally closes.
If you simply want to get an average of the last 52 values when a condition was met then forget arrays and use loops.
defparam calculateonlastbars = 500

total = 0
count = 0
for a = 1 to barindex
if close[a] > open[a] then
total=total + close
count = count + 1
endif
if count = 53 then
break
endif
next

if count = 53 then
avg = total/12
else
avg = undefined
endif

return avg as "average closing price of last 52 green candles"
I am actually trying to replicate the programming of the RSCMansfield indicator, as there is a limitation in probuilder and I cannot use the inbuilt function, because I want to compare an equity to an index, such as S&P 500, and that apparently is not allowed.
Given that you also cannot import external data in PRT, I am defining an array with the last 52 weekly close prices for S&P500 and wanted to calculate the RSCMansfield formula, as per https://www.stageanalysis.net/blog/4266/how-to-create-the-mansfield-relative-performance-indicator#:~:text=The%20formula%20for%20measuring%20relative,price%20of%20a%20market%20average.%22
RP = ( stock_close / index_close ) * 100
MRP = (( RP(today) / sma(RP(today), n)) - 1 ) * 100
So, what I am doing first is populate the table with S&P500 close prices:
$sp500CierresSemanales[52] = 3234.85
$sp500CierresSemanales[51] = 3265.35
$sp500CierresSemanales[50] = 3329.62
$sp500CierresSemanales[49] = 3295.47
$sp500CierresSemanales[48] = 3225.52
$sp500CierresSemanales[47] = 3327.71
$sp500CierresSemanales[46] = 3380.16
$sp500CierresSemanales[45] = 3337.75
$sp500CierresSemanales[44] = 2954.22
$sp500CierresSemanales[43] = 2972.37
$sp500CierresSemanales[42] = 2711.02
$sp500CierresSemanales[41] = 2304.92
$sp500CierresSemanales[40] = 2541.47
$sp500CierresSemanales[39] = 2488.65
$sp500CierresSemanales[38] = 2789.82
$sp500CierresSemanales[37] = 2874.56
$sp500CierresSemanales[36] = 2836.74
$sp500CierresSemanales[35] = 2830.71
$sp500CierresSemanales[34] = 2929.8
$sp500CierresSemanales[33] = 2863.7
$sp500CierresSemanales[32] = 2955.45
$sp500CierresSemanales[31] = 3044.31
$sp500CierresSemanales[30] = 3193.93
$sp500CierresSemanales[29] = 3041.31
$sp500CierresSemanales[28] = 3097.74
$sp500CierresSemanales[27] = 3009.05
$sp500CierresSemanales[26] = 3130.01
$sp500CierresSemanales[25] = 3185.04
$sp500CierresSemanales[24] = 3224.73
$sp500CierresSemanales[23] = 3215.63
$sp500CierresSemanales[22] = 3271.12
$sp500CierresSemanales[21] = 3351.28
$sp500CierresSemanales[20] = 3372.85
$sp500CierresSemanales[19] = 3397.16
$sp500CierresSemanales[18] = 3508.01
$sp500CierresSemanales[17] = 3426.96
$sp500CierresSemanales[16] = 3340.97
$sp500CierresSemanales[15] = 3319.47
$sp500CierresSemanales[14] = 3298.46
$sp500CierresSemanales[13] = 3348.44
$sp500CierresSemanales[12] = 3477.13
$sp500CierresSemanales[11] = 3483.81
$sp500CierresSemanales[10] = 3465.39
$sp500CierresSemanales[9] = 3269.96
$sp500CierresSemanales[8] = 3509.44
$sp500CierresSemanales[7] = 3585.15
$sp500CierresSemanales[6] = 3557.54
$sp500CierresSemanales[5] = 3638.35
$sp500CierresSemanales[4] = 3699.12
$sp500CierresSemanales[3] = 3663.46
$sp500CierresSemanales[2] = 3709.41
$sp500CierresSemanales[1] = 3703.06
$sp500CierresSemanales[0] = 3756.07
I am struggling trying to replicate the simple moving average part (SMA) using arrays or loops.
Any pseudo-code or idea on how I could achieve this? Or even better, the actual code of how PRT calculates this internally 🙂
Thank you
Having the last 52 closes will only allow you to calculate your RSCMansfield indicator for the last bar on the chart. Trying to do more than this will require you to fill in every weekly closing price far enough back in history (+52 more bars) to draw a line as long as you want it. You could then loop back from the LASTSET array and add 52 values and divide by 52 to get your weekly average. Then step one more bar back and repeat. You would need to update the array by adding a new array location and close value each week.