Is is possible in one indicator to address both daily and weekly data?
In the screener builder, the command “Timeframe” allows that, is there any equivalent for the indicator programming?
I am confused… from the link above it seems like MTF should be working now in V11, but I tried it and it does not.
I do not remember any official anouncement on it, and the manuals say nothing about it.
Can anyone clarify?
It worksfrom the beginning of v11for indicators, as well.
Search this forum for the word MTF and you will be returned many links to examples amd articles.
You can also read https://www.prorealcode.com/topic/multi-timeframe-mtf-indicators-for-prorealtime/.
I confirm MTF is working now for indicators, could you please post an example of a code you think it doesn’t?
I have defined the following indicator on the daily chart:
timeframe(1 week,updateonclose)
CW=Close
timeframe(1 day,updateonclose)
CD=Close
Return CW as “CW”, CD as “CD”
I have attached 2 pictures, showing that the weekly close as appears on the indicator does not match the actual weekly close as appears on the weekly chart.
- What did I do wrong?
- Is there anywhere documentation of MTF with the various parameters? It is not in the manual…
UpdateOnClose means that data is updated when a candle closes, so it’s the close of the previous week, while the daily chart is the default timeframe (in this case updateonclose is automatically overridden by DEFAULT).
You can read what I suggested in my previous post.
Roberto, I am sory to play the “dumb” here, but I really do not understand.
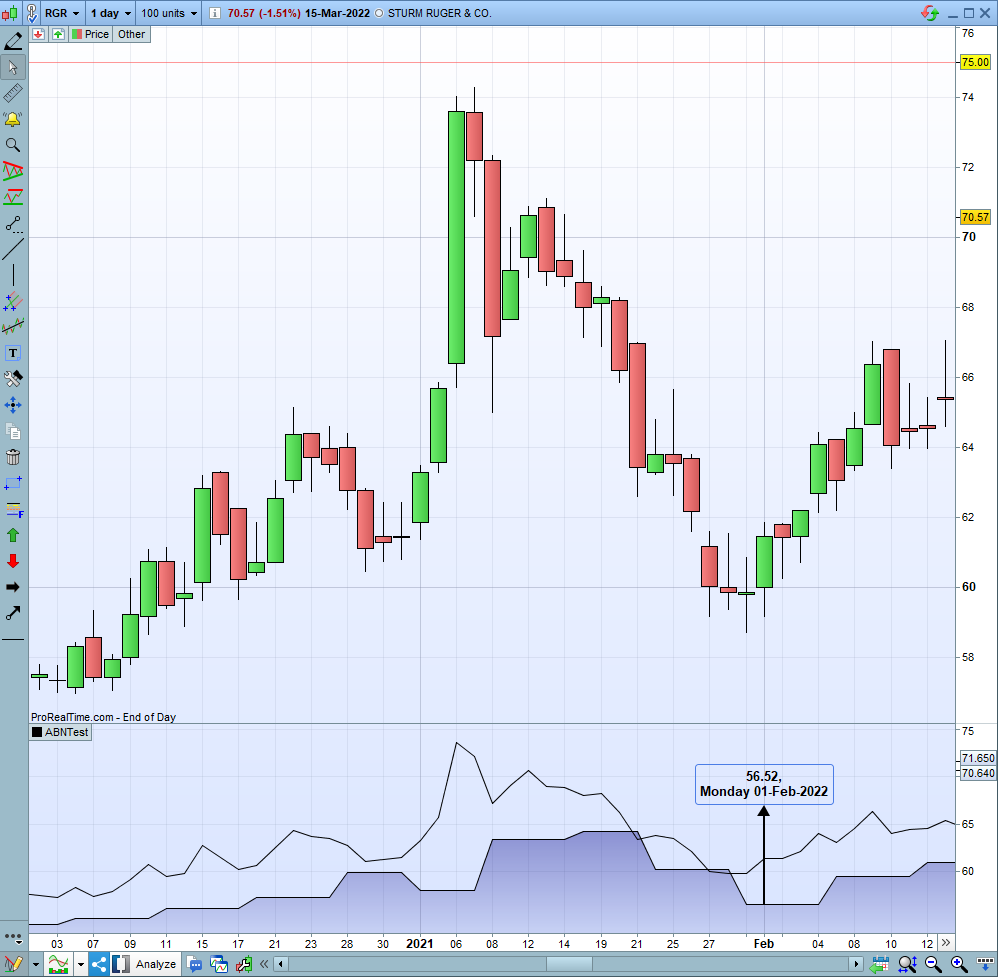
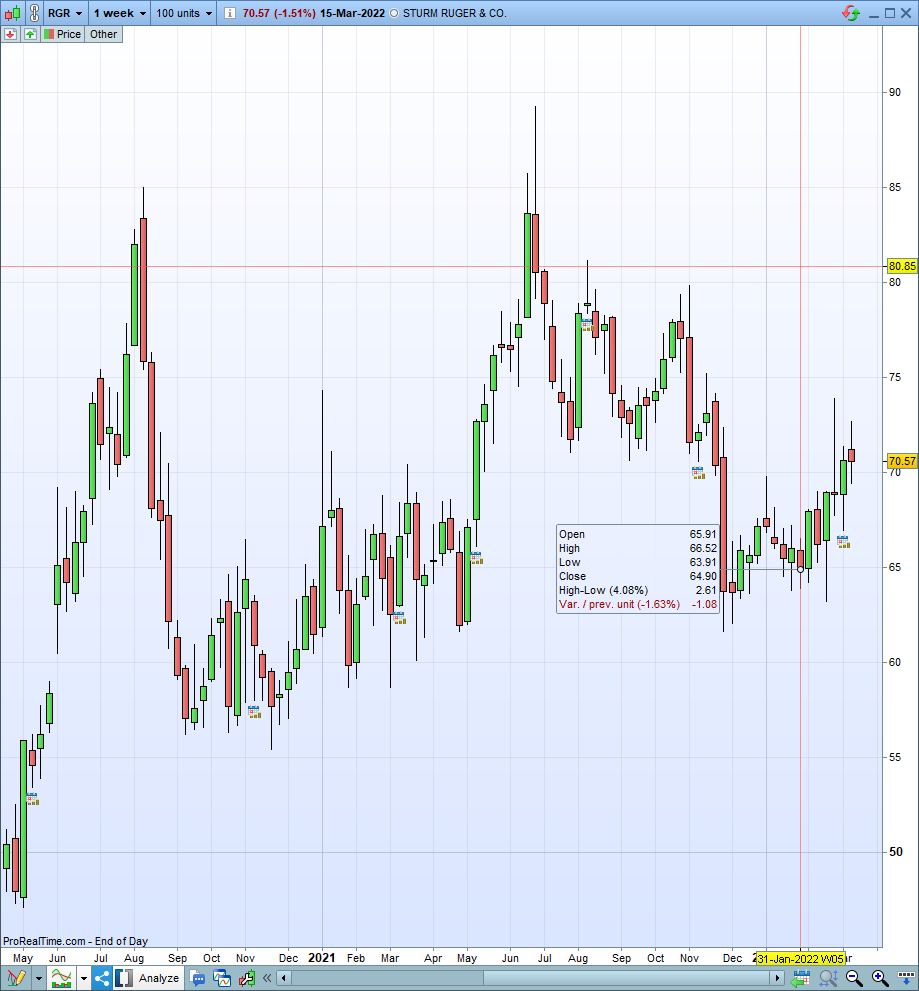
- The indicator on the daily chart shows a valur of 56.52 for the close of the relevant week for date 01-Feb-2022. Looking at the weekly chart, this week (which started on 31 Jan-2022) closed at 64.90.
I also checked the close value for the previous week and even the next week – none of them is 56.52. So where does this value come from?
- Is there good official documentation for this feature apart from the various posts on the forum? For example, what are the possible values for the second parameter apart from “updateonclose”?
Thanks!
 JS
JSParticipant
Veteran
In your daily chart, you look at data from 2021 instead of 2022
In the weekly chart you look at data from 2022.
Monday, February 1, 2022 does not exist. (Monday 31 January 2022)
JSParticipant
Veteran
Weekly :
Week 4 starts on Monday 24 January 2022 and ends on Friday 28 January 2022
Close on Friday 28 January 2022: 66.00
Week 5 starts on Monday 31 January 2022
Open 65,91
Daily:
Friday, January 28, 2022: Close 66.00
Monday, January 31, 2022: Open 65.91
Oh, sorry for that…
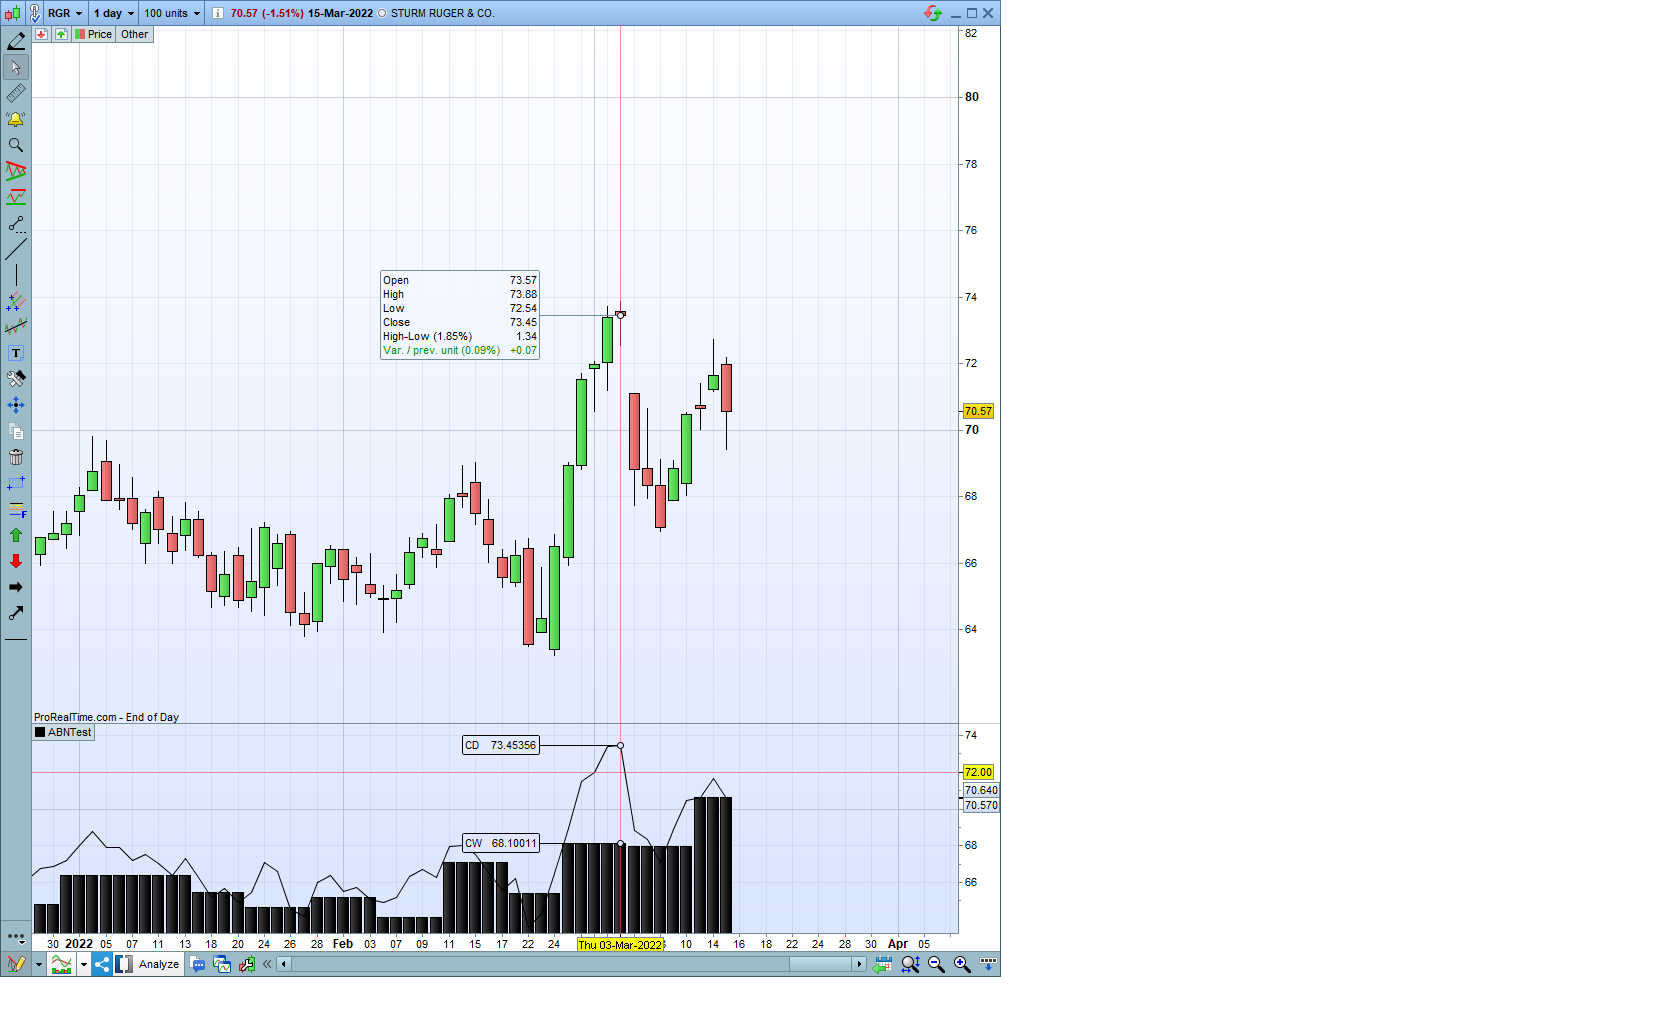
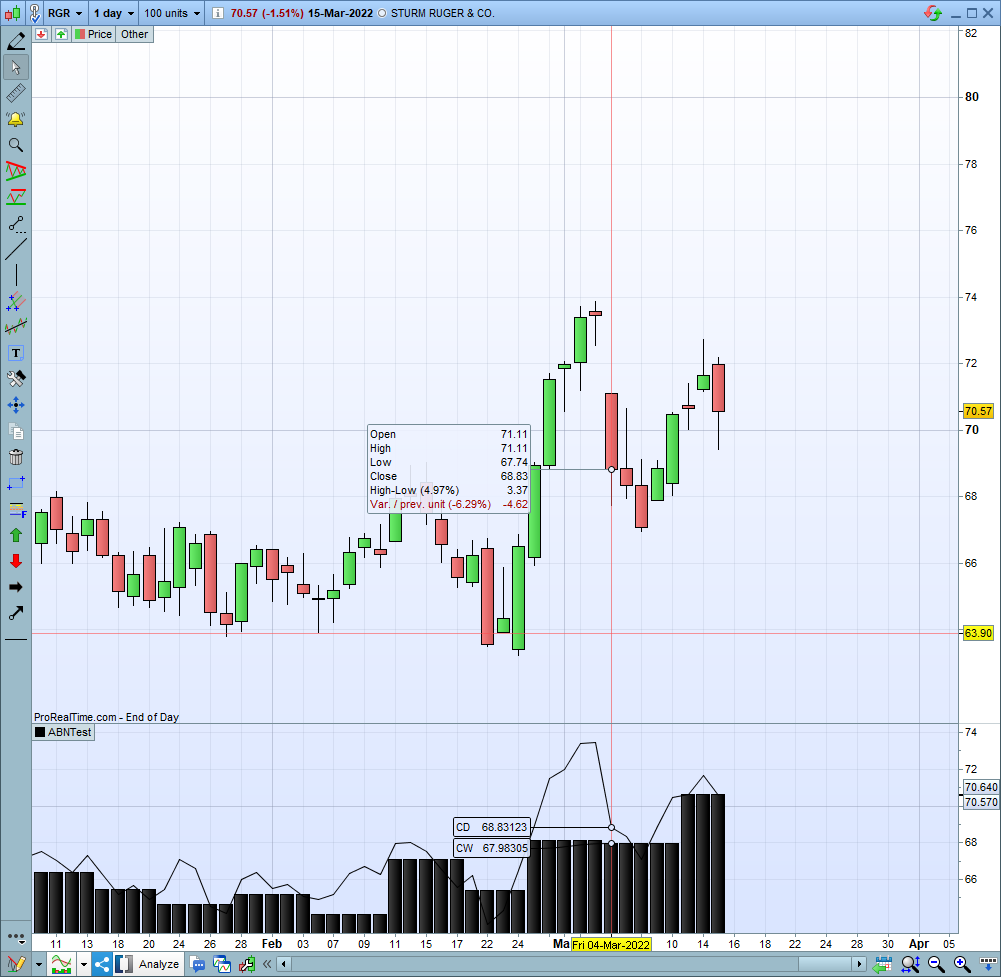
Took pictures with the right dates, problem still persists:
The daily chart shows weekly close of 67.98 on Friday 04-Mar-2022, and weekly close of 68.10 on Thursday 03-Mar-2022;
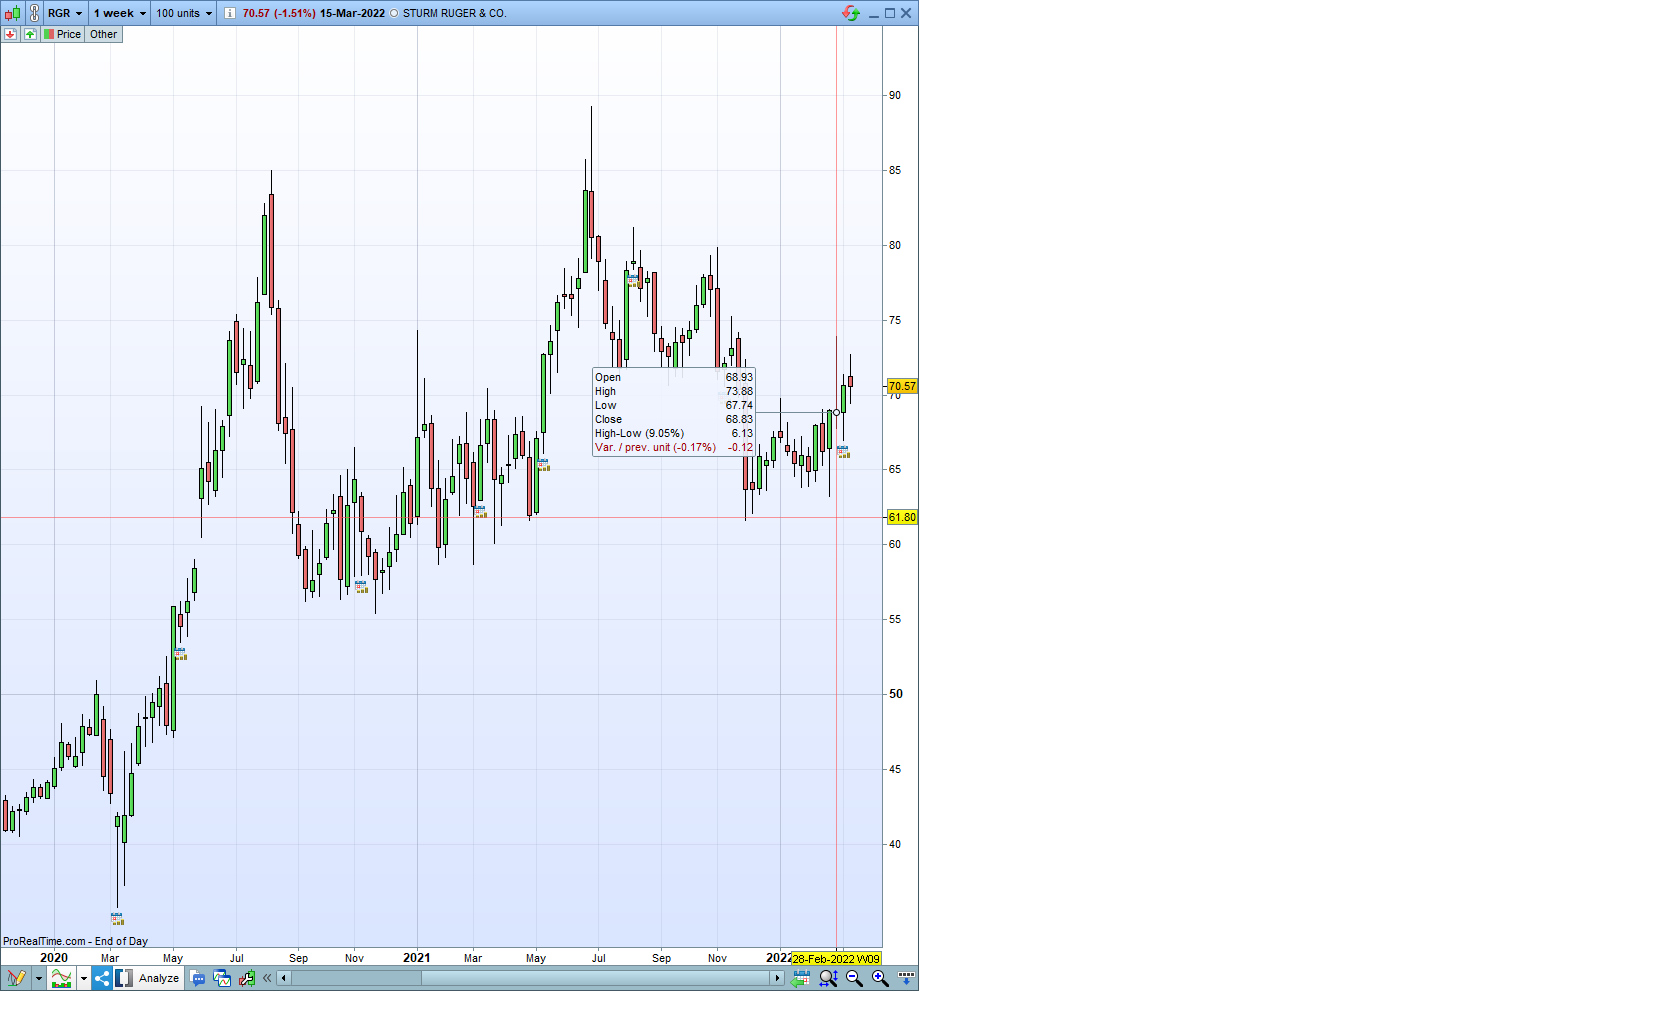
The weekly chart shows close of 68.83 for week starting 28-Feb-2022, and close 68.95 for week starting 21-Feb-2022.
So no match…
Roberto – let me express my appreciation for your effort and willingness to help!
JSParticipant
Veteran
Daily:
Friday 4 march 2022: Close 68,79
Weekly:
Friday 4 march 2022: Close 68,79
On the weekly chart you can only see the opening on Monday (Open) and the close on Friday (Close)
(and the high and Low during that week)
JSParticipant
Veteran
Perhaps the differences are due to dividends.
In your weekly chart, the historical data has been adjusted after dividend and I don’t see that reflected in your daily chart.
Well, JS gave me the clue… After toggling the “historical data adjustment” button, finally the two charts are now in synch.
I am still puzzled about the previous 2 daily screenshots I sent. I tried to reconstruct them in order to make sure the issue is solved, but no matter how much I toggled the ajustment on and off again, I could not get the same values shown in those charts… I am cluless.
Anyway, thanks a lot for your responsiveness, and especially to JS who solved the issue…