I got to thinking about robustness again and one of the key things that my robustness tester was written to do was to allow us to see trades that might otherwise have been missed because we already had a trade open. So this got me thinking that it would be nice to have a separate strategy running on every separate bar – that way we miss absolutely no trades. I also thought that it would be nice to simulate it.
On a fast time frame this could equal thousands of strategies and so is really not possible due to the limited number of strategies our broker lets us go live with but in a simulation/optimization we are limited to 10000 optimizations which is not too bad.
I don’t really like fast time frames and so I decided to start simple and a I had a weekly strategy with results that looked pretty good and that robustness tested fairly well so I decided to code something that would simulate running it as a separate strategy for each week of the year. So I added the following code to the top of my strategy and added TRADEON as a condition for entry. I then ran it with ‘wn’ optimized between zero and 53. Zero is the result if TRADEON was active every bar and so basically the same as my original back test that missed trades because it was already on the market. 1 to 53 allow the strategy to only start a trade in that week of the year. (53 and not 52 because sometimes there is a bit of a week in 365 days). No trades lasted a year so it would be impossible to miss any trades.
tradeon = 0
startdate = 19950101

if opendate >= startdate then
 if openyear <> openyear[1] then
weeknumber = 0
endif

weeknumber = weeknumber + 1

if weeknumber = wn or wn = 0 then
tradeon = 1
endif
endif
So this then returns 54 results. One just like my original back test and 53 that represent only allowing opening a trade on each of those week numbers. So if I then add up the returns of all 53 weeks I get to see how my strategy performed if it took every single possible trade.
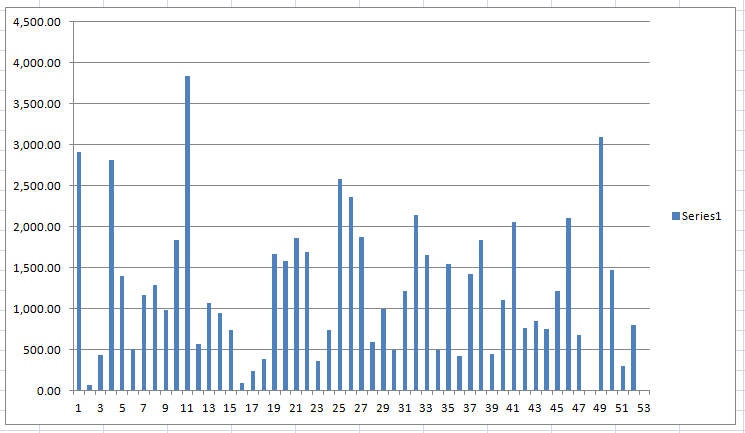
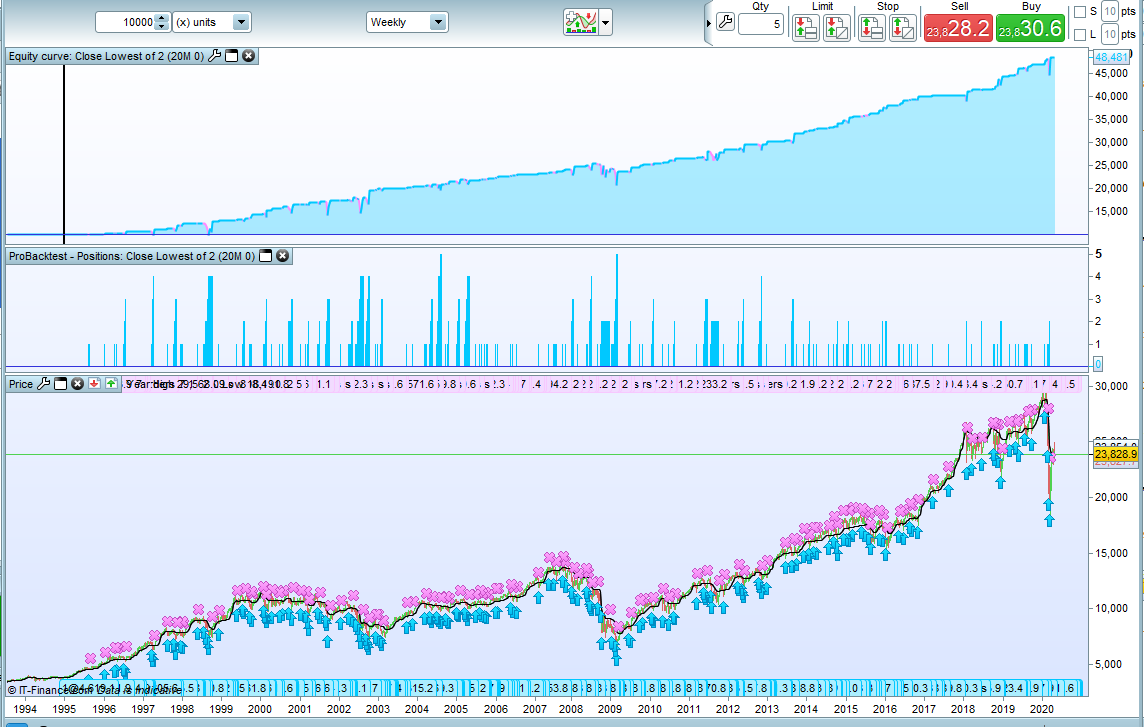
I dragged the results into Excel totted the numbers up and they were quite interesting. The original back test is the lower figures and the combined 53 strategies the top figures.
Gain
% Gain
Nbr trades
% of winning trades
Avg gain per trade
64476.00
644.77%
309
90.16%
208.66
38481.40
384.81%
198
88.89%
194.35
So that is a lot of potentially missed trades and a lot of potentially missed profit in the original back test. The win rate when taking every trade was even better than the original back test and the average gain per trade much higher.
The images show the original backtest results and a graph of how much each weekly strategy made.
So from an analytical and robustness testing perspective having a strategy for every bar is definitely beneficial. Now I just have to drag all the individual trade info for all 53 strategies into Excel and sort it all to create an equity curve… or perhaps I’ll open a beer instead!
 Bard
BardParticipant
Master
So that is a lot of potentially missed trades and a lot of potentially missed profit in the original back test.
Curious to know why the system isn’t then run with defparam cumulateorders = True, so as to avoid missing those extra trades?
Because the trades cannot be managed individually. We don’t have partial closure and if we move stop losses and take profits then that effects all open positions. By having separate strategies for each bar then we can manage each trade individually.
In fact thinking about it further it would be very simple if you wanted to trade a faster timeframe to just launch a strategy before the current bar closes that only opens trades on the time of the next bar. So on say a daily chart you would stop any strategies that did not have any open positions and launch a strategy for tomorrow that can only open positions tomorrow. Any strategies that are holding open positions you let play out and stop them once they have closed out. This way you only need a minimum of your precious strategy slots that the broker lets you have so you have more slots free to diversify with.
Congratulation Vonasi, great work as always.
I was thinking, this kind of implementation how much is worth on <15 timeframe systems in your opinion?
I guess it all depends on how long each trade is open for. If you are quickly in and out then perhaps you don’t miss many trades but still it would be nice for robustness purposes to know how those missed trades worked out even if there were not many of them.
If you are on the market for longer then there will definitely be some worth in seeing every trade. If you have a strategy that say trades 9 hours of the day on a 15 minute time frame then having 36 strategies is a perfectly reasonable in a simulated back test but not possible to forward test due to the 25 strategy limit in demo. Trading 24 hours a day would require 96 strategies. In real live trading that would be possible because the strategy limit is higher but you would use up almost all your allowance on basically one strategy which is not ideal. You could possibly run two or three strategies with close monitoring and stopping and starting of strategies but it would be a lot of work.
I think the true benefit of this idea is as a form of robustness test for all strategies and as a potential trading method for daily and slower time frame strategies.
I have a strategy for every bar, mostly involving how to get served first … topic for another thread. (i know, the wit … it’s killing you, right?)
But seriously, this sounds an excellent addition to the robustness project — thanks again for all the great work you put in here!
I think everyone is going to need a good strategy for getting served in a bar on the first night they open again! Being very robust with the elbows will probably help!
BardParticipant
Master
I love the way your mind thinks laterally! Btw, just how many precious system slots do IG give us live?
BardParticipant
Master
“Years of experience” and a “misspent yoof” taught me to always stand in the middle of the bar, never at the ends, or near walls/wooden pillars. Just an observation… but yes that’s a topic for another thread.
Btw, just how many precious system slots do IG give us live?
I believe it is 100 for live trading and 25 for demo.
I found a bit more time to play with the SEB (Strategy Every Bar) idea and I decided to switch to the daily time frame and so I wrote a very simple and stupid strategy that simply bought if the close was lower than both of the previous lows and then held the position until a bar closed more than 2% higher than the buy price or more than 1 % lower than the buy price. Only one position was open at a time. I tested it from the start of 1995 until the present day and the results were surprisingly good except for falling apart ever since the start of 2018 – but as it was just a test bed for an idea the actual results were not important.
The normal backtest took 553 trades but I was pretty sure missed loads due to the length of time each trade was open on the market so I added code that would optimize the strategy to run one strategy for each of the possible 31 days in a month. I added a counter for whenever entry conditions were met so that I could see if any trades were missed due to being already on the market. When I tested it the 31 separate strategies took 1139 trades and missed just 4 trades. So our normal back test showed us only 48.4% of possible trades whereas our 31 strategies show us 99.7% of possible trades.
Here is the code:
defparam cumulateorders = false

startdate = 19950101
tpperc = 2
slperc = 1
x = 2

if opendate >= startdate then

tradeon = 0
if (dn = 0) or (day = dn) then
tradeon = 1
endif

c1 = close < lowest[x](low[1])

if c1 and tradeon then
buy 1 contract at market
trades = trades + 1
endif

if onmarket and close > positionprice *(1 +(tpperc/100)) then
sell at market
endif

if onmarket and close < positionprice *(1 -(slperc/100)) then
sell at market
endif
endif

graph trades
Optimize it with ‘dn’ from 0 to 31. As before 0 is the normal back test result and 1 to 31 the 31 separate day strategies.
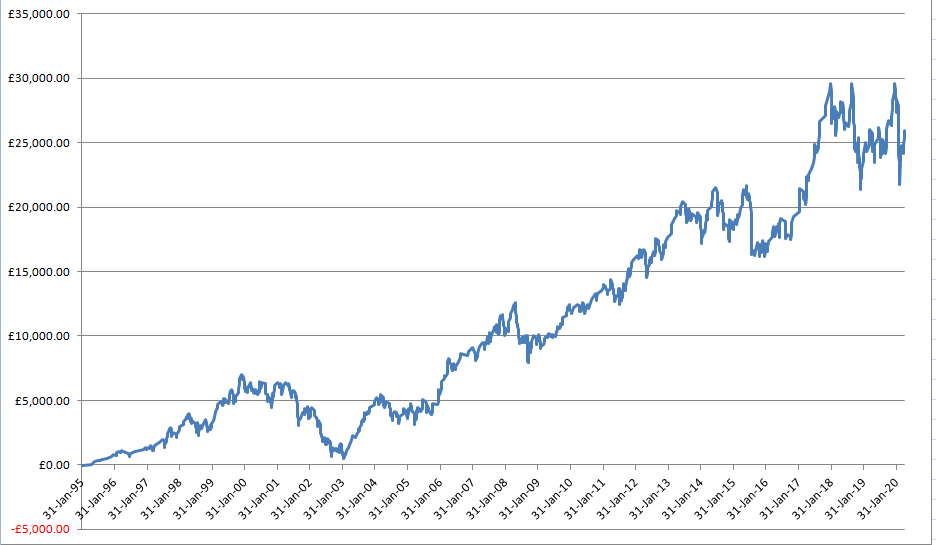
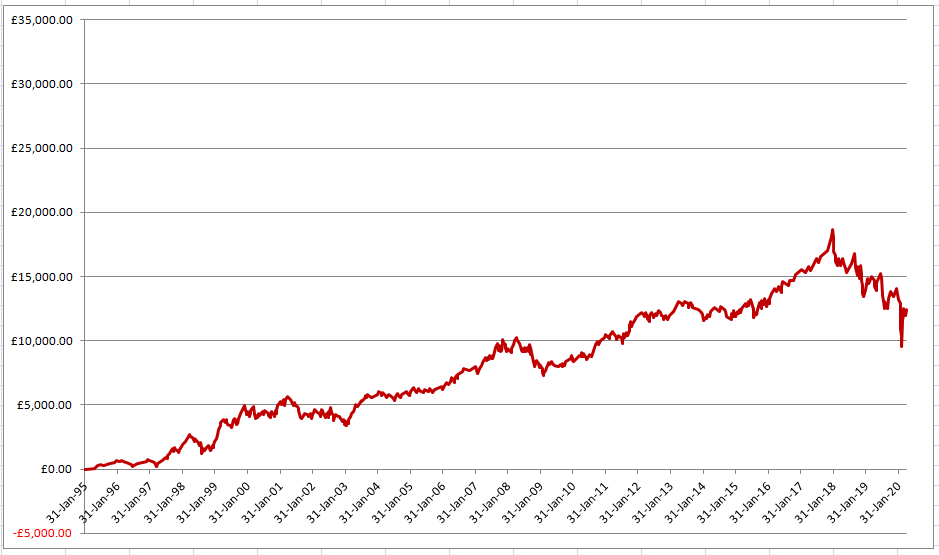
Then the fun part started – not! I dragged all the trades taken from all the strategies into Excel and sorted them in chronological order and then totaled up the running equity to get a sort of equity curve. In the images the blue line is the 1139 trades from the 31 strategies and the red line is the 553 trades from the normal backtest.
We can clearly see that the curves are very different! Here are the final stats (top line is the 31 strategies and the bottom is the normal backtest:
Gain
% Gain
Nbr trades
% of winning trades
Avg gain per trade
25,922.60
259.21%
1139
47.55%
22.759
12,424.80
124.25%
553
46.84%
22.468
So our winning percentage was slightly better as was our average gain per trade.
Although it is a lot of work and takes a lot of time to do this sort of analysis on a strategy I think that is definitely a worthwhile thing to do. Putting all your trust that a strategy works well because you have a nice equity curve when you have only checked 48% of all trades that it it could have taken seems like rather a silly thing to do when you could have analysed almost 100% of all possible trades. Then there is the fact that if you did run 31 strategies instead of just 1 then you would have more trades and so more profit in the same amount of time – obviously you need to ensure your account balance can cope with lots of positions open at the same time.
Now if only we could do this sort of analysis and create equity curves directly in the PRT platform without needing to do all that dragging and dropping into Excel.
One limitation that is a bit annoying is the 100 limit on optimized results in the optimized results window. If we want to test something that holds for a long time then really we need to run as many strategies as possible so as to catch every trade possible. I just tried to run a test with a strategy for every day of the week and also every week of the year so 6 x 52 = 312 strategies but obviously I only get to see the best 100 and the other 212 are dropped from the results. So we would need to run several tests with just 100 strategies in each. What a pain that will be.
What a pain that will be.
Is the 100 limitation the same in v11?
Am I correct in thinking you have the free Daily version of v11?
So here is an example of overcoming that 100 result limit. This is the same silly sort of strategy but in this one I had it buying on any day where the close is lower than the previous three lows and this one had a take profit if any candle closed above 6% higher than the trade price or if it closed over 2% lower then the trade price. This means some long holding periods and the possibility to miss lots of trades so I coded it so that it would run 318 strategies – one for each day of the week in each week of the year (53 x 6 = 318). I then ran 4 back tests: week 1 to week 16 (16 x 6 = 96) then week 17 to week 32 then week 33 to week 48 and then finally week 49 to week 53. Only one position is open at any time and I only tested on data from 1st January 1995 onwards on the DJI. Here is the code I used:
defparam cumulateorders = false

startdate = 19950101
tpperc = 6
slperc = 2
x = 3

if opendate >= startdate then
tradeon = 0
if openyear > openyear[1] then
myweek = 1
endif

if opendayofweek < opendayofweek[1] and openyear = openyear[1] then
myweek = myweek + 1
endif

if (dn=-1) or (wn = myweek and dn = opendayofweek) then
tradeon = 1
endif

c1 = close < lowest[x](low[1])
c2 = 1//average[100] > average[200]

if c1 and c2 and tradeon then
buy 1 contract at market
trades = trades + 1
endif

if onmarket and close > positionprice *(1 +(tpperc/100)) then
sell at market
endif

if onmarket and close < positionprice *(1 -(slperc/100)) then
sell at market
endif
endif

graph trades
‘dn’ is optimized from 0 to 5 or set at -1 to run a normal backtest. ‘wn’ is optimized in the ranges (1 to 16), (17 to 32), (33 to 48) and (49 to 53).
I dragged the results into Excel and then totaled them up. My trades count told me that our entry conditions were met 945 times but our normal back test only took 231 of these and missed 714 possible trades. So it only tested 24.4% of possible trades. My SEB tests however took 942 trades in total and so only missed 3. So we tested 99.7% of all possible trades.
These were the results (top is normal backtest and bottom is SEB test):
Gain
% Gain
Nbr trades
% of winning trades
Avg gain per trade
26694.90
266.95%
231
41.13%
115.5623
39947.20
399.43%
942
32.75%
42.4068
So our normal back test made the strategy look better than it really is. The win rate and average gain per trade are very different to the reality of taking every trade. So it would appear that our strategy as normally back tested just got lucky by missing a lot of the bad trades due to already having a position open.
I did consider dragging and dropping all 942 trade results into Excel to create an equity curve but I didn’t consider it for very long!
The image is of the normal back test result.
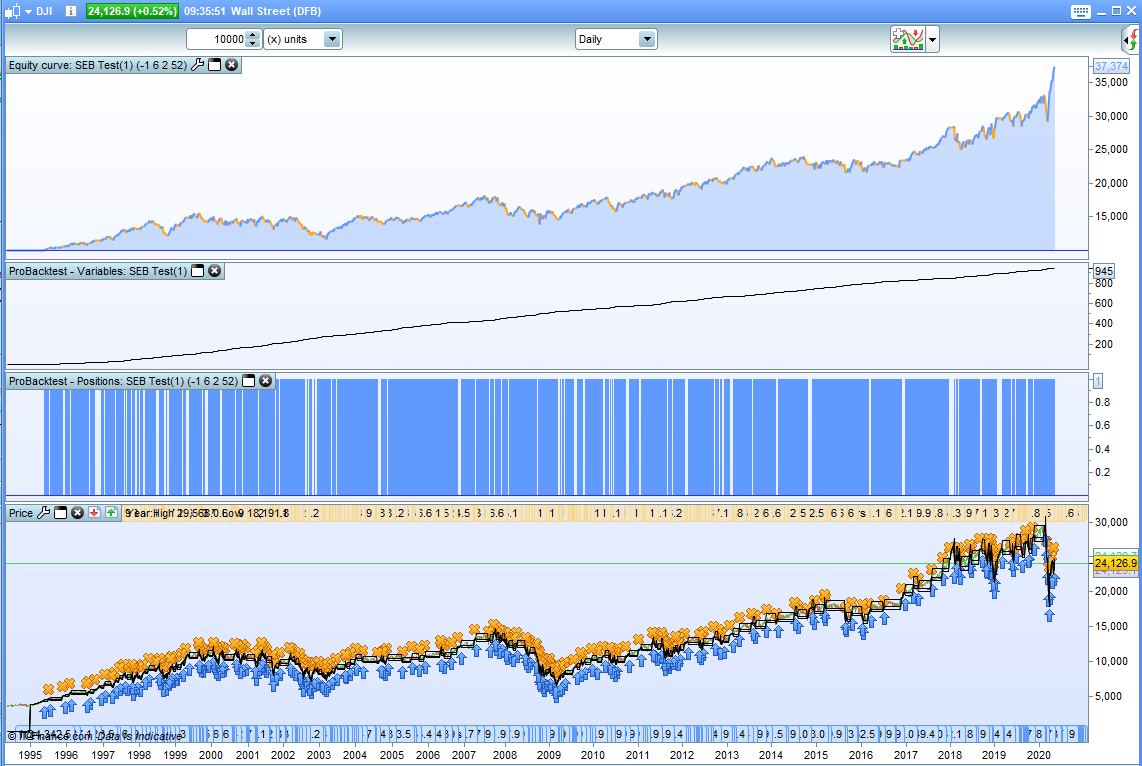
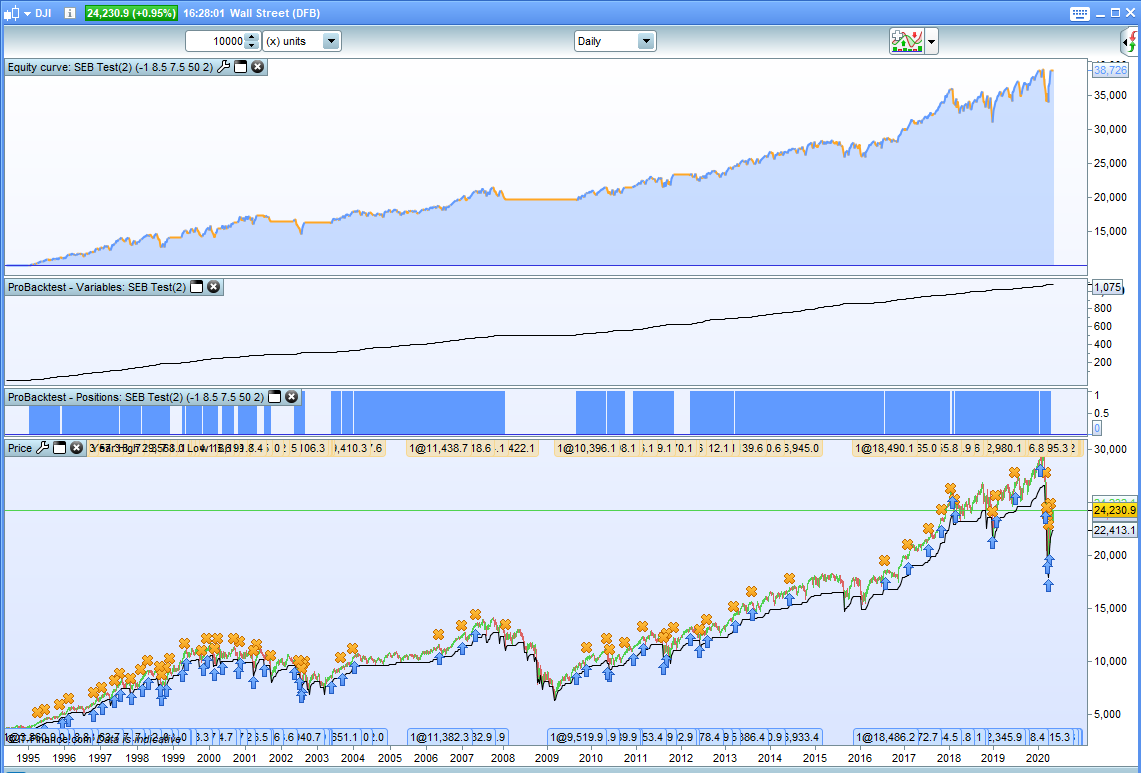
Here is another example. This is a simple strategy on the daily DJI that buys if there have been two down days but only if the 150 period SMA is above the 200 period SMA. It then closes the position if a candle closes and there is over 8.5% profit or if there is over a 7.5% loss. The normal equity curve is a quite appealing one and one might think from it that trading like this could be a good idea…. but what about all the trades that our back test didn’t take because it already had a position open.
SEB’s trade counter tells us that there were a potential 1075 trades but our normal back test only took 64 of them! That is a test on less than 6% of all possible trades. A SEB backtest however tested 1064 of them so only missed 11 trades. That is a test of just under 99% of all trades.
The results were as follows (normal backtest first and SEB’s test second):
Gain
Nbr trades
% of winning trades
Avg gain per trade
28,725.90
64
71.88%
448.84
316298.2
1064
61.59%
297.27
So once again our normal back test made the strategy look better than it might be in reality. % of winning trades dropped over 10% and average gain per trade was over a third lower.
Once again I resisted the temptation to drag and drop all 318 tests to create an equity curve especially as it was approaching beer o’clock!