hi Peter,
regarding bumpy equity curves: I don’t know how to define “bumpy”, at the same time I know that not every equity curve which I consider as “bumpy” is indicating system is good enough to be traded. I also don’t want to tell that there is no chance that system with very smooth equity curve works. I can’t prove it. I simply did not see such systems and were not able to develop them myself. maybe it’s really possible, when system is working on very small times frames, like those which you are trading (1min), and trading at the same time multiple markets. anyway when ever I had systems with equity curve being very smooth during some period there was always another period where it went for very long quite smoothly down 😀 on other hand I saw some systems of others with smooth equity curves and many had something ugly in common: high hit ratio (well above 50%) and avarage losers being bigger than avarage winners. well, this is for me an indication that those systems will crash in the future with high probability. somebody was telling once about central banks: when they reduce interest rates they are suppressing (natural) volatility of the economic activities, and they do so, this natural volatility is “exploding” some day in the future. I think one can tell something similar about trading systems with smooth equity curves: smoothness is possibly an indication that developer (optimizer…) of the systems “suppressed” otherwise volatile/bumpy trading results of the same system. but one can suppress the volatility only temporarily and so that smoothnes will not continue.
I mean, theoretically one can jump on the system whenever it produces very smooth equity curve, and jump off when it stops doing so – hoping that this period continues long enough so one becomes rich until that point of time and can skip trading 😀 (or at least one has invented another system in the meantime). but for that one needs serious rule when to jump on and when to jump off. I would love to have such rules. but so far I see it this way – having such rules means again basically adding more variables to the system. more variables = more complexity = more problems…
in any case – I wish you of course that your optimization with better trailing stop makes really a difference and your system works perfectly for many years.
@Justisan
@PeterSt
Played enough. 😉
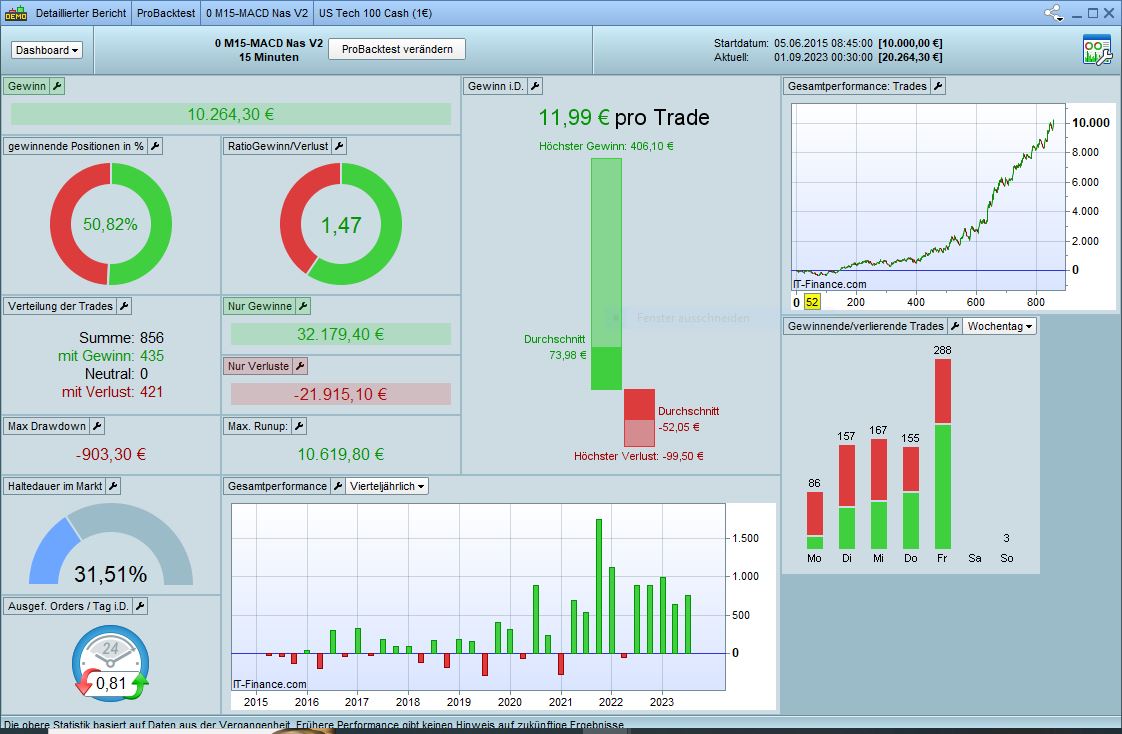
Finally we come to a system that I posted here years ago.
Test MACD Nasdaq M15
I did a quick overhaul and I’m getting similar performance to yours… just with a smoother curve.
Wrong… I only have data up to mid-2015 with 200,000 candles.
No witchcraft, just a little more code. First I took out the MACDLINE and replaced it with an SMA200. So the rough trend is a bit slower and seems better. Then short SL and TP tweaked, as you can see the SL is quite small and then I added a trailing stop. The result is impressive. You can turn the TimeEx and Trailingstop on and off and the result doesn’t degrade much. The curve just gets a little smoother with both.
Spread = 1.5
Is something like this sturdy? I guess so. Is something like this tradable? Secure. But then I would possibly optimize the last 3 years and then take a look at the optimization from time to time. It is probably important that the winners are basically bigger than the losers.
The settings are, as I said, just a quick optimization, can certainly be improved.
DEFPARAM CUMULATEORDERS = false
defparam preloadbars = 10000

//Risk Management
PositionSize = 1

once trailingstoptype = 1
once timeEx = 1

//Macd
M15MACDLinieLong  = MACDline[12,26,9](close) > -2.5 //0
M15MACDHistoLong  = MACD[12,26,9](close) crosses over 0
//
MA15  = Average[200,0](close)
bull15 = summation[1](MA15 > MA15[1]) = 1
//
long  = M15MACDHistoLong and bull15
//long  = M15MACDHistoLong and M15MACDLinieLong

// trading window
ONCE BuyTime   = 140000
ONCE SellTime  = 210000

// position management
IF Time >= BuyTime AND Time <= SellTime THEN

If not onmarket and long Then
buy PositionSize CONTRACTS AT MARKET
SET STOP %LOSS 0.6
SET TARGET %PROFIT 2.5

ENDIF

endif
//
graphOnPrice MA15 AS "Long" coloured("Blue")
//
if time >= 220000 and timeEx=1 and dayofweek=5 then
sell at market
exitshort at market
endif


////////////////////////////////////////
// %trailing stop function incl. cumulative positions
//once trailingstoptype = 1
if trailingstoptype then
//====================
trailingpercentlong  = 0.65 // %
trailingpercentshort = 1 // %
once acceleratorlong = 0.05 // typically tst*0.1
once acceleratorshort= 0.1 // typically tss*0.1
ts2sensitivity  = 2 // [1] close [2] high/low [3] low/high [4] typicalprice
//====================
once steppercentlong  = (trailingpercentlong/10)*acceleratorlong
once steppercentshort = (trailingpercentshort/10)*acceleratorshort
if onmarket then
trailingstartlong = positionprice*(trailingpercentlong/100)
trailingstartshort = positionprice*(trailingpercentshort/100)
trailingsteplong = positionprice*(steppercentlong/100)
trailingstepshort = positionprice*(steppercentshort/100)
endif

if not onmarket or ((longonmarket and shortonmarket[1]) or (longonmarket[1] and shortonmarket)) then
newsl           = 0
mypositionprice = 0
endif
positioncount = abs(countofposition)
if newsl > 0 then
if positioncount > positioncount[1] then
if longonmarket then
newsl = max(newsl,positionprice * newsl / mypositionprice)
else
newsl = min(newsl,positionprice * newsl / mypositionprice)
endif
endif
endif
if ts2sensitivity=1 then
ts2sensitivitylong=close
ts2sensitivityshort=close
elsif ts2sensitivity=2 then
ts2sensitivitylong=high
ts2sensitivityshort=low
elsif ts2sensitivity=3 then
ts2sensitivitylong=low
ts2sensitivityshort=high
elsif ts2sensitivity=4 then
ts2sensitivitylong=(typicalprice)
ts2sensitivityshort=(typicalprice)
endif
if longonmarket then
if newsl=0 and ts2sensitivitylong-positionprice>=trailingstartlong then
newsl = positionprice+trailingsteplong + 0.2
endif
if newsl>0 and ts2sensitivitylong-newsl>=trailingsteplong then
newsl = newsl+trailingsteplong
endif
endif
if shortonmarket then
if newsl=0 and positionprice-ts2sensitivityshort>=trailingstartshort then
newsl = positionprice-trailingstepshort
endif
if newsl>0 and newsl-ts2sensitivityshort>=trailingstepshort then
newsl = newsl-trailingstepshort
endif
endif
if barindex-tradeindex>1 then
if longonmarket then
if newsl>0 then
sell at newsl stop
endif
if newsl>0 then
if low crosses under newsl then
sell at market
endif
endif
endif
if shortonmarket then
if newsl>0 then
exitshort at newsl stop
endif
if newsl>0 then
if high crosses over newsl then
exitshort at market
endif
endif
endif
endif
mypositionprice = positionprice
endif

if (shortonmarket and newsl > 0) or (longonmarket and newsl>0) then
if positioncount > positioncount[1] then
if longonmarket then
newsl = max(newsl,positionprice * newsl / mypositionprice)
endif
if shortonmarket then
newsl = min(newsl,positionprice * newsl / mypositionprice)
endif
endif
endif
//////////////////////////////////////////////////////////////
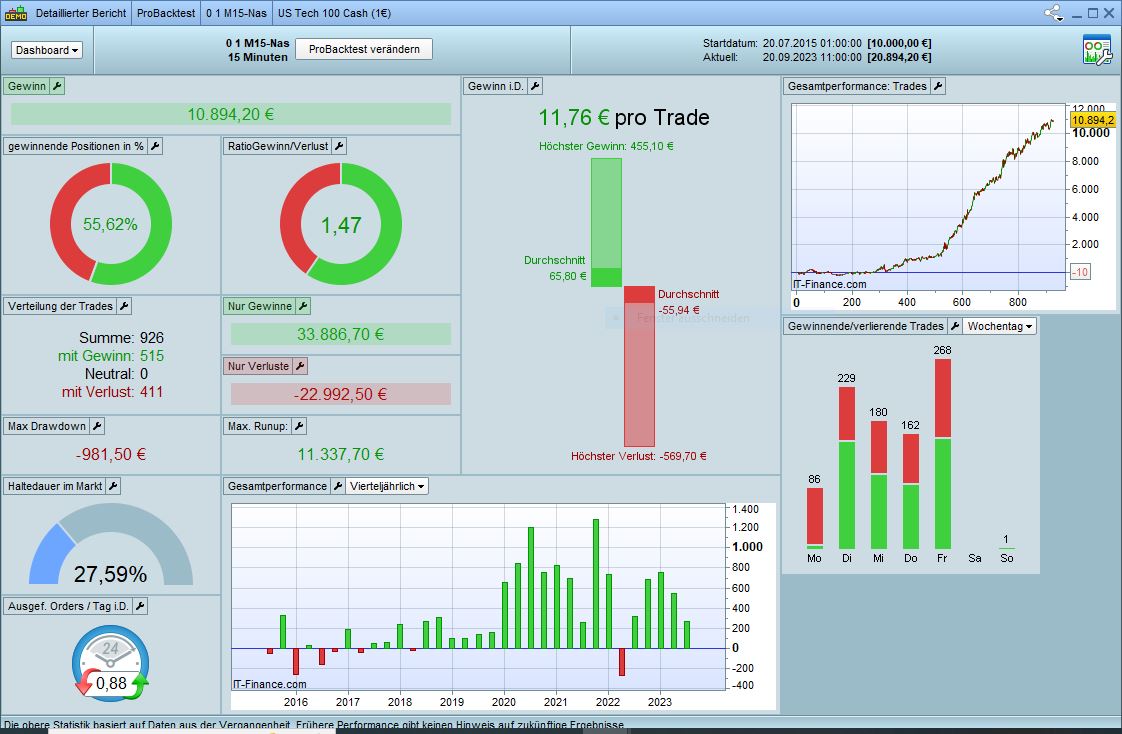
Quick update… add the following lines to the code above and in the long statement, write bull240 instead of bull15. EMA12 in the H4-TF is basically a 2-day trend. Make the curve smoother again. Should I have sold this little system on the marketplace after all? 😉
timeframe(240minute, updateonclose)
MA240   = Average[12,1](close)
bull240 = summation[1](MA240 > MA240[1]) = 1

timeframe(15minute, updateonclose)
hi phoentzs
you may of course offer your algo on markeplace and you might even find buyers desparately looking for „smooth equity lines“ = steady income as they know it from their office or factory jobs, which is, as I think, not possible in fact when trading markets. Of course one can add this and add that variable and „find“ their parameters which smooth equity line. but I assume the question is rather – does „adding something“ increase robustness? That means – does adding variables increase/secure longevity of the system? What about „removing something“? Personally that is my approach. I code a trading scenario which I derived frome some observations …and then I start to remove things/variables until it really „hurts“, getting by that ugly-bumpy equity lines, which I could not „sell“ to majority of people – but do I care?
Ok, let’s go with an example, see the ultra-simple-stupid code of 6 lines below.
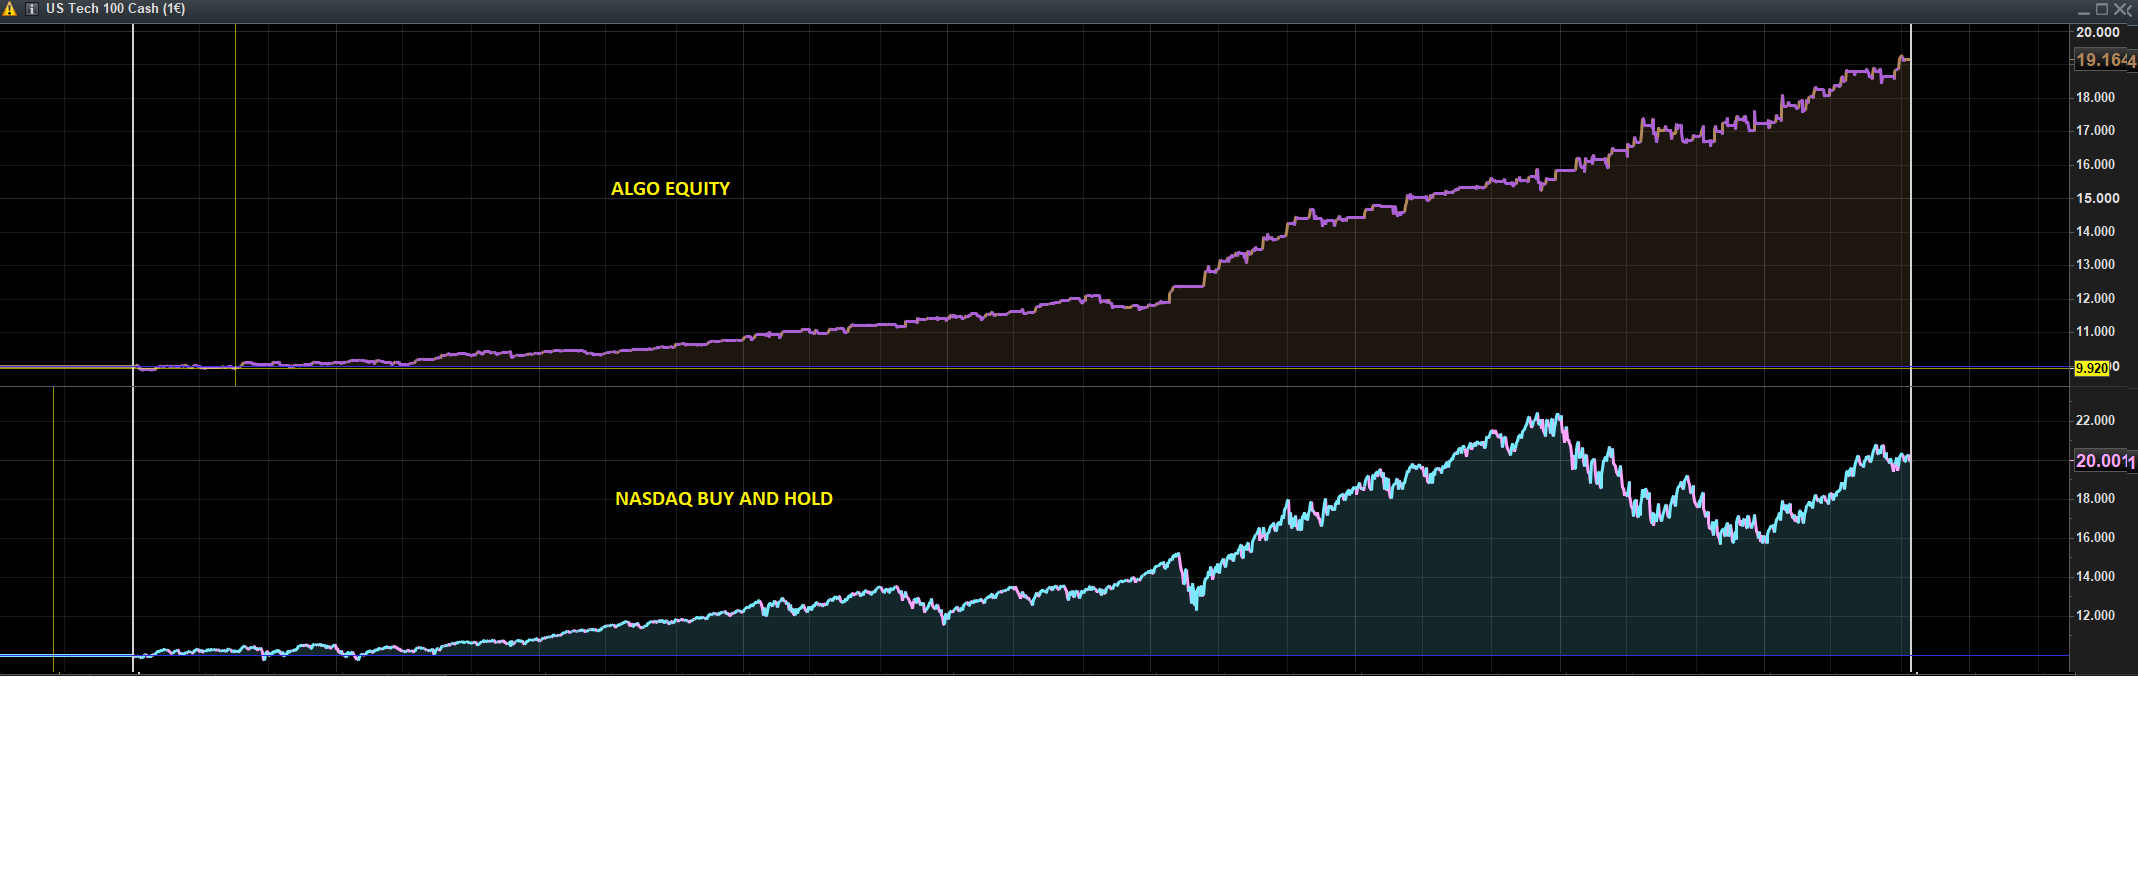
As you see it has zero indicators, no profit target and not even stoploss. I basically cannot optimize here anything. algo compares today’s market opening behaviour versus ysterday’s pricepoint (which you can so to say find in newspaper…) and goes long if market shows „strength“ after the opening, holding position overnight and selling next day at opening. Well, I am not disclosing the full code, since I am trading that system live. And live I am in fact using a stoploss („guaranteed“ by IG) – even if it drags a bit on performance, but I want to avoid „black swans“ over-night or over-weekend attacking my account.
That’s all. 6 lines 😀 doing the job much better than „buy and hold“ nadaq…
if time = TIMETOGOLONG and pricepointTODAY > pricepointYESTERDAY then
buy 1 lot at pricepointTODAY stop
endif
if time = 153000 then
sell at market
endif
Mmm, that looks pretty good. I understand that you don’t want to give everything away here… But maybe a little tip about what “pricepointTODAY > pricepointYESTERDAY” could be?
@Justisan
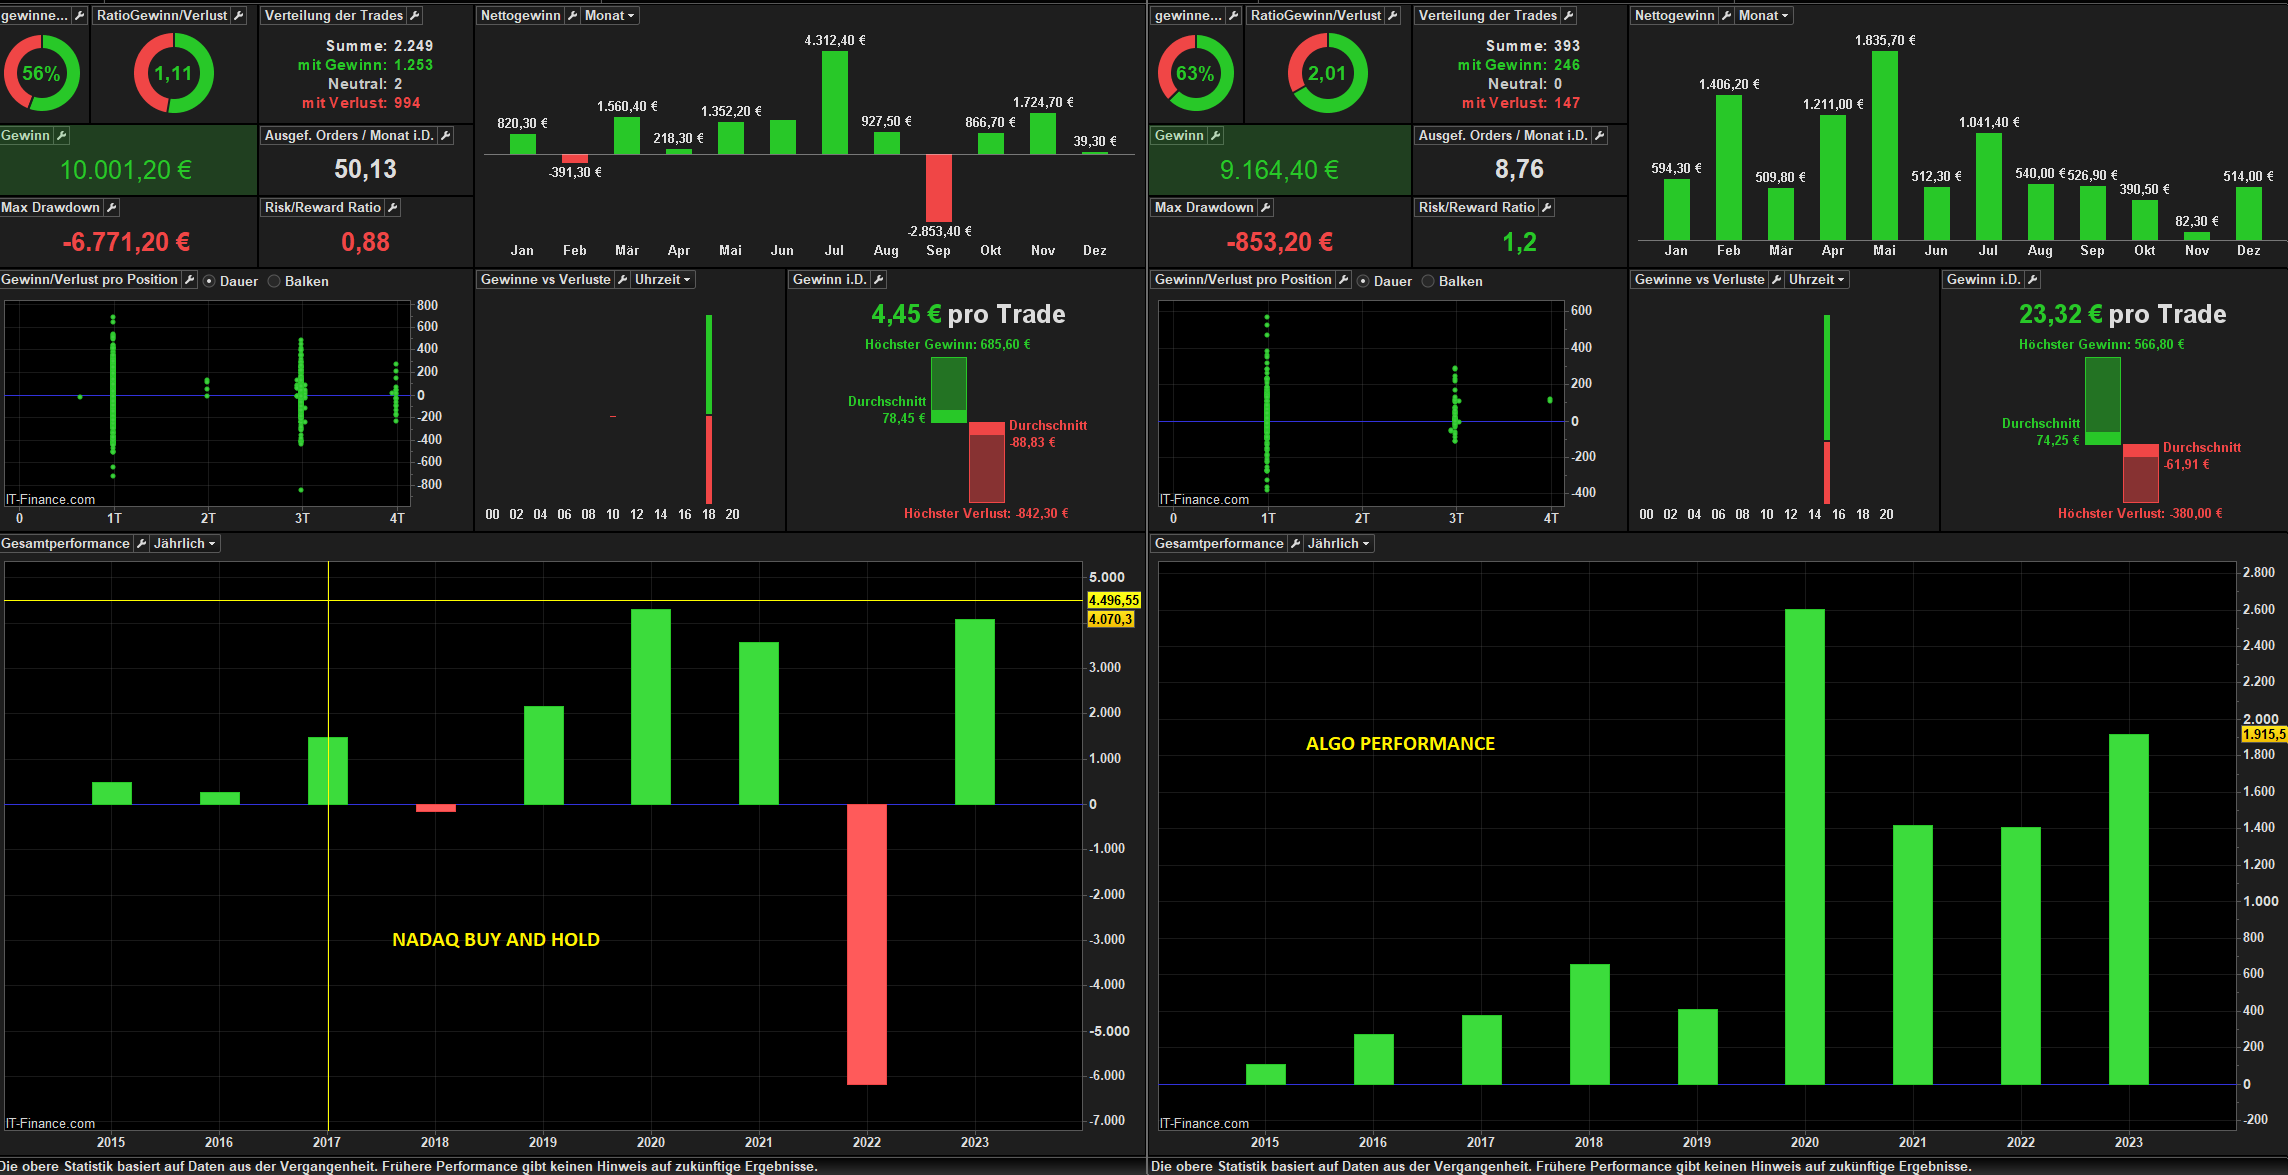
I did some experimenting and came to a shocking result. Picture attached. This variant is similar to yours, completely without indicators, without SL and TP. Just with really, really simple things. Ok, the drawdown is a little higher and I have a lot more trades. But overall, the knowledge of how it seems to work is somewhat astonishing. So far I have always relied on indicators that make my curve beautiful. But now I’m really surprised. You could almost say it beats buy and hold.
😀 I hoped you will figure it out! and I assume after this initial “simplicity-shock” you will figure out possibly much more soon. concious rejection of “indicators” forces one into very different way of thinking about trading markets. years ago, when skipping indicators myself, I was kind of totally “lost”, I thought “f***!! what’s left after I skip them all? what else trading decision can be based on?”. well, not so much is left, but very meaningfull, uniqe price points, around which ones specific trading scenarios can be built based on ultra-simple / very genearal logic. so my overall approach is to indentify those pricepoints which emerge regularly, which cannot be “optimized” and where kind of always some very desparate buying/selling kicks off (lot of volume traded), step in there and bet that one of the forces will overwhelm the other and the movement will continue. well, if it does not continue, my job is to take the loss. somebody was telling that “main job of the trader is to take the loss”. I would not say it is main job, but definetely one of the most tough tasks. on other hand to “let the profits run” is not an easy task at all either. many try to make it “easy” by defining profit targets and “trailing stops” – but these are again variables (in worst case defined by “indicators”), opening the doors for curve fitting and according my experience usually reducing long term performance, so I am ultra-cautious applying them and mostly skip them, especially the target setting. honestly I apply a trailing stop for some of strategies which have potential to accumulate lot of profits by holding them for more than one day, yet again, those trailing price points are quite far away from current price and are based on pricepoints which basically cannot be so much optimized. if I catch those rare really big fishes I want to make sure I bring them home 😀
good luck with your further investigations!
This is a well-known problem and a weakness of backtests that are programmed from the earliest point in the past to the current day. I had already addressed it here several times.
The results of all the backtests are “optimised”, which means that sources of error are concealed because the programme knows the final result of the market. If the code is run live or in a live test after the backtest, the success curve collapses. This is a weak point of many of the programmes presented here.
That is why I only use periods up to at least 1 year before the current date in my backtests. Then I can see directly whether the code works profitably over a longer period WITHOUT further optimisation.