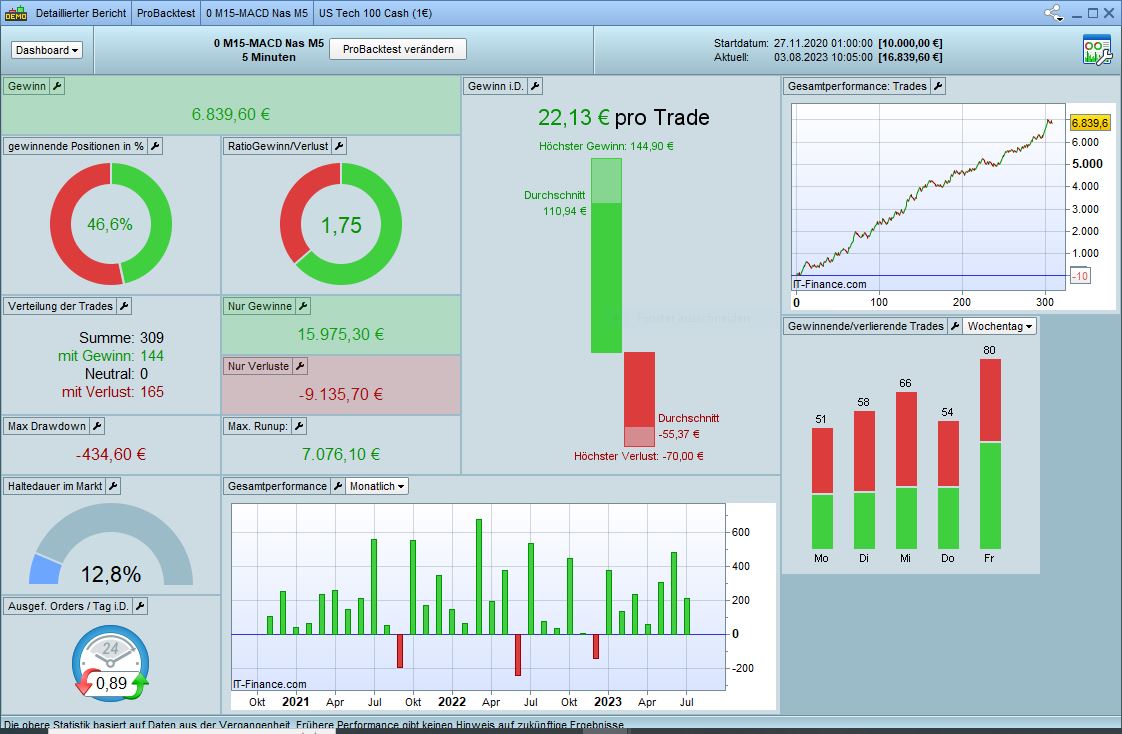
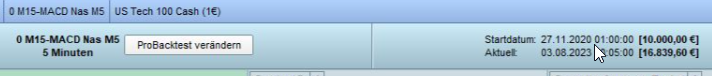
I have put your system into backtest for all past years with tick data available, and it shows that system would have been in the drawdown from the very beginning (mid of 2010) till end of 2020,
It was developed / backtested from the end of 2020 onwards.
phoentzs will tell if it is not so. 🙂
Thus Yes, it was over-fitted.
Only systems which are not optimized at all, may work throughout with similar performance.
Ah wait, you said all that, justisan.
By now I virtually graduated on optimizing, and the whole course could be summarized to simply this :
Have an idea – implement that, and don’t optimize anything.
One exception : Once you have that (net) almost winning system, it is allowed to make more profit per trade by means of optimization. This is related to the Exit – usually by means of better trailing. Now you make profit with a fair chance of your system not being too dependent on the market situation.
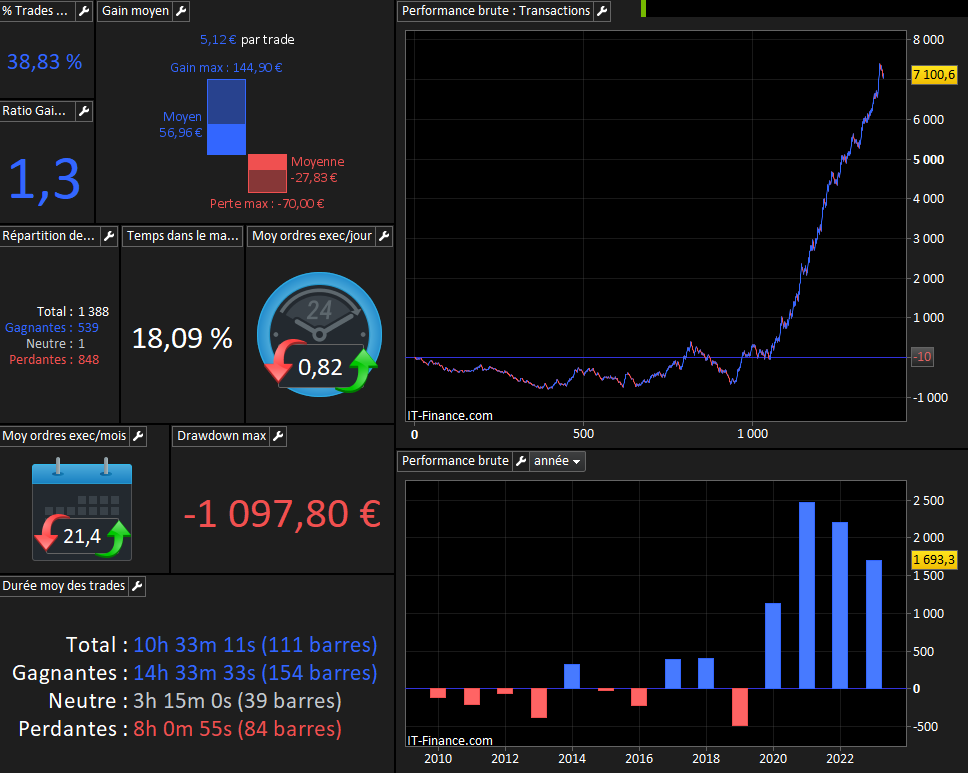
The systems which work best for me these days (I mean, with my current experience) have a win rate of under 50% – could be close to 40% and a RR preferably of above 1,5 (this follows from the low win rate while winning $ anyway).
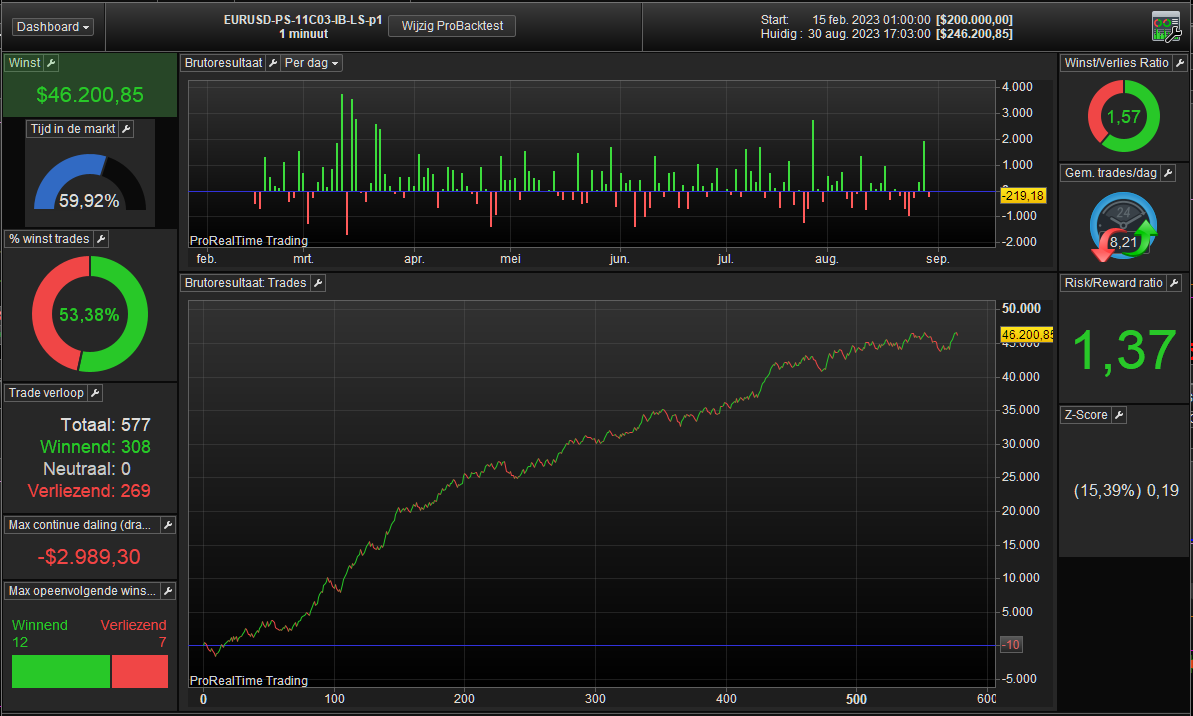
if equity curve looks very smooth – the system is probably not robust, I mean it’s probably crap.
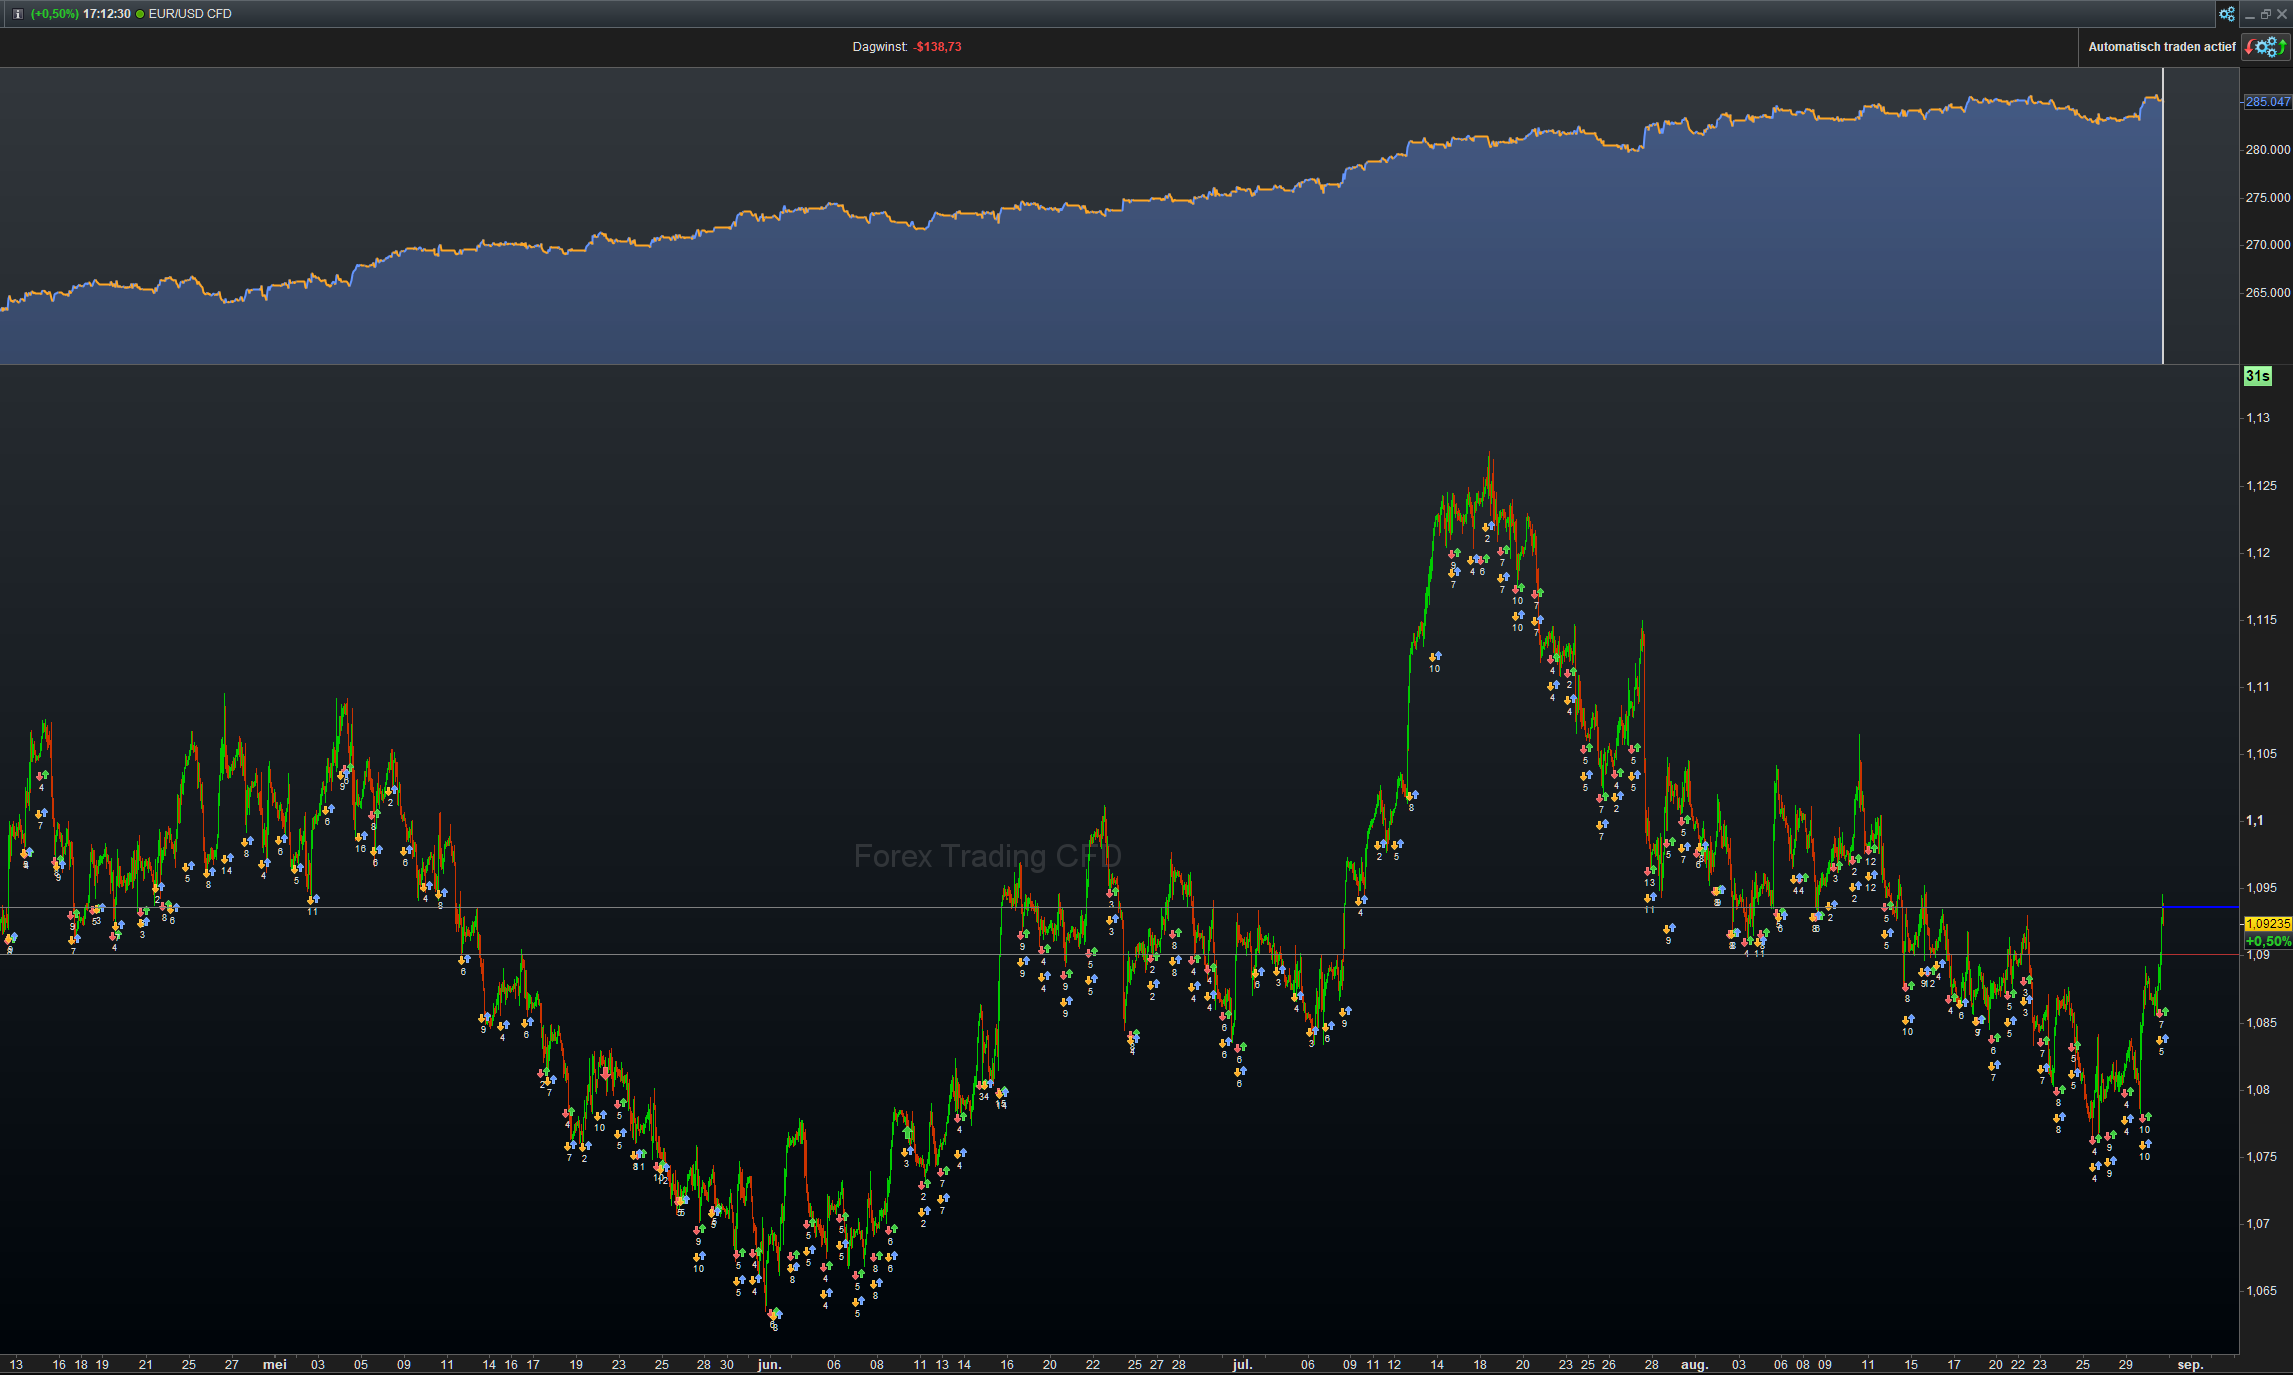
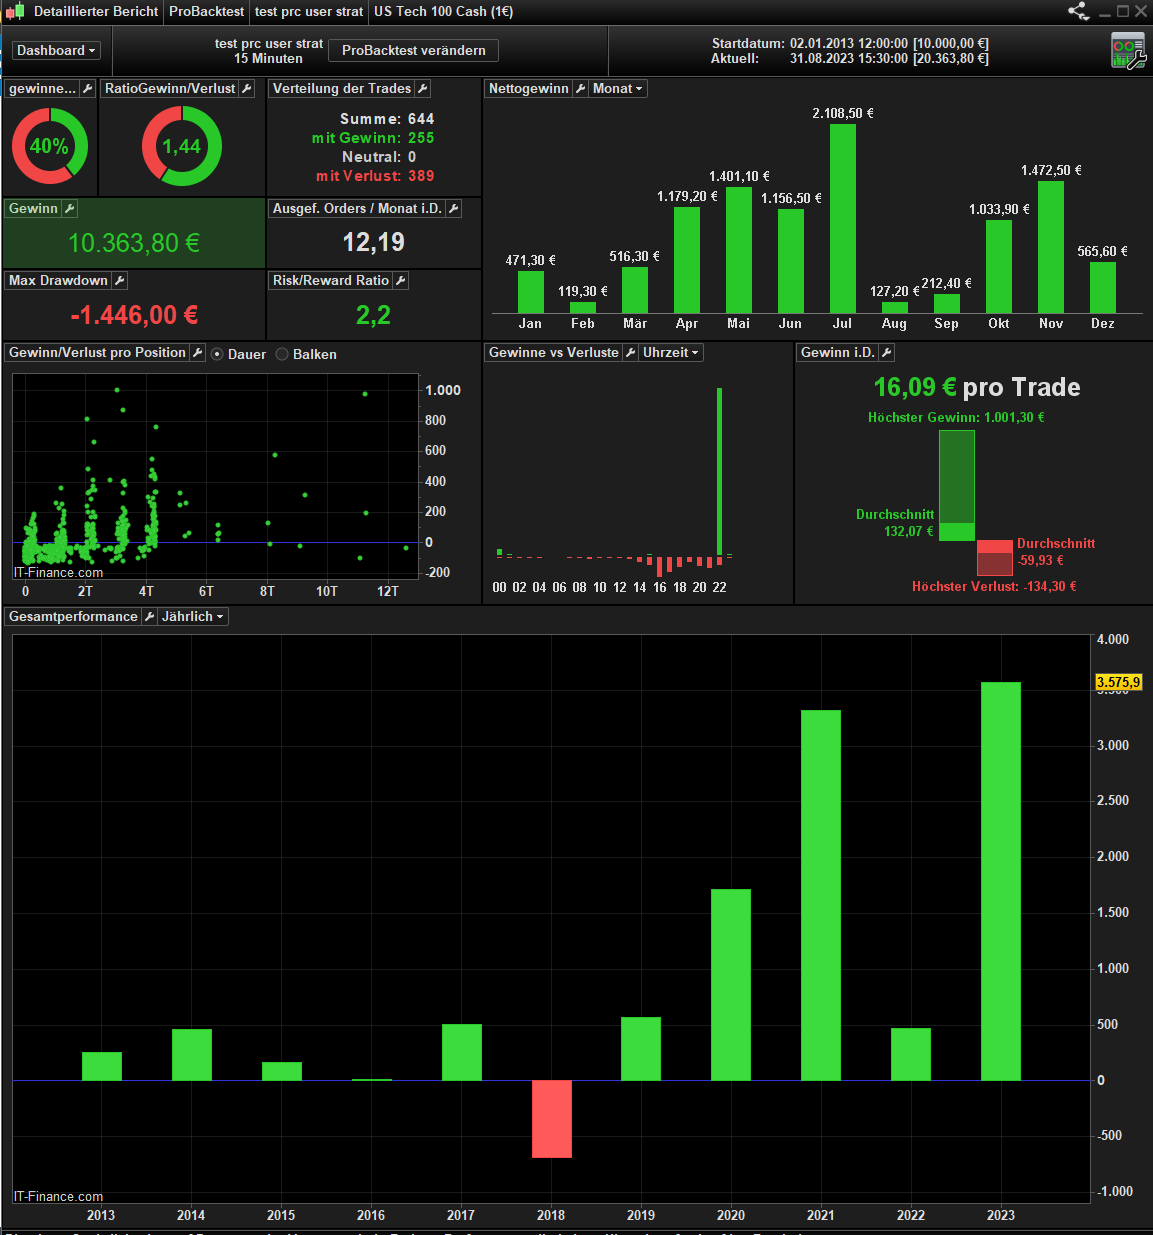
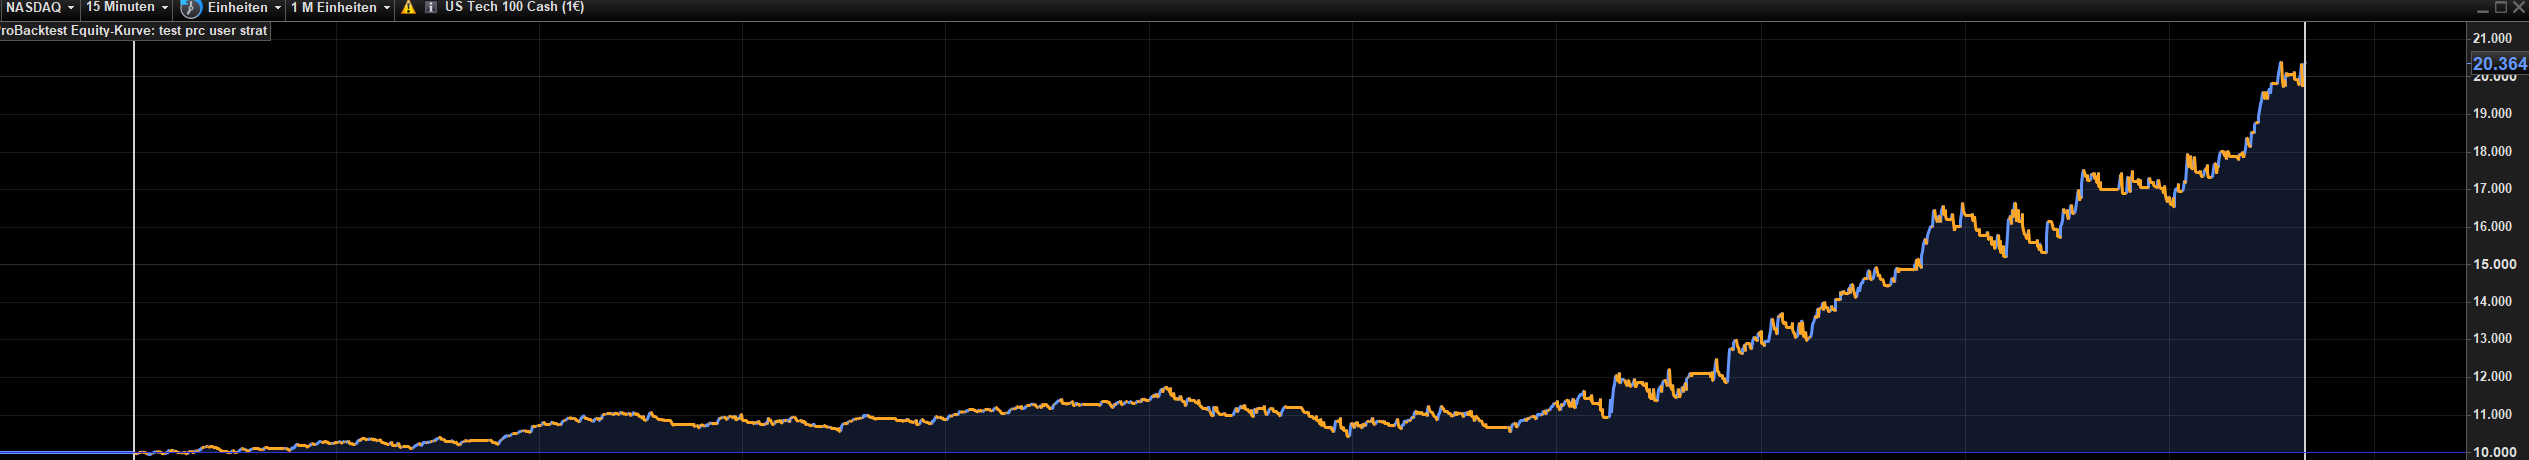
But that is not my experience; the opposite. A bumpy curve lives by coincidence, like only two losses in a row instead of 5. Those curves are always out of control, and operate at random (but still may be winning). Below a curve which I call very smooth, which System indeed was based on an idea – and a crazy one at it. You can still see when it was developend (3rd screenshot), but in this case only because of making less good profit per trade (mentioned Trailing thing). For me this is the most extraordinary because I wouldn’t have gone broke when this indeed had started Dec 2020. I can show you examples which *were* optimized with a drawdawn of 100K or whatever nastiness.
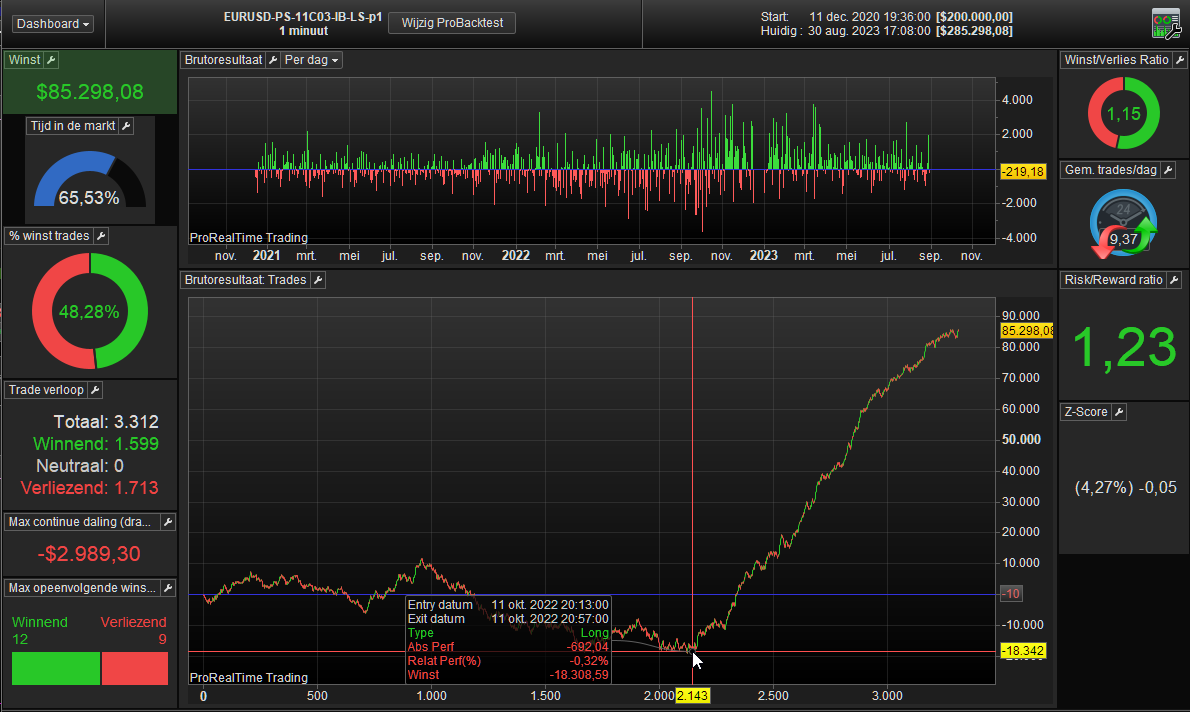
Nothing is theory here because this runs in Live from of March 2023. The 4th screenshot kind of tries to show that by means of all the double arrows and such (green/red being the Live, the others from this backtest).
Regarding the first few in the post : notice that this 1 minute system bears ~6 months of backtest data. This is how I can see when it was developed – in March because the dip is 6 months earlier. The same will show for phoentzs’ system, although I did not look into it at all (IIRC he works with 100K of backtest data).
Another thing to learn perhaps : it is clear that thus System did not make “the” money before it’s backtest data. Still it is at 85K when run now, all the way back to the end of 2020, while the past 6 months only bring 45K. This mean that the END of this backtest data – which is from of March till totday – is doing super well and as expected by backtest. The curve of course remains rather linear. However, believe it or not, the slope starts to flatten at … trade 2893 which is at March 23, 2023.
Yep.
So the optimizing on the Trailing stuff also has its influence, but not much.
What should worry me is that there is more than that, because else all should have been a similar curve right from today to the beginning which is Dec 2020. Most probably this is because this System makes use of a feature that minimizes losses or prevents fallback from profit. Yep, that is optimized indeed and would be Market-depended.
Being able to look afterwards to what happened and analyze what actually can have caused which, is of great value. And so it takes yeeeeears to get somewhere.