FX stands for FOREX.
TF stands for Time Frame, the time interval at which candlesticks or bars are plotted onto the chart (Monthly, Weekly, Daily, 4 hour, 10 minutes,…….).
INSTRUMENT is what you are trading, EurUsd, Aud,Cad, Dax, Cac40, ASX, AAPL,…..
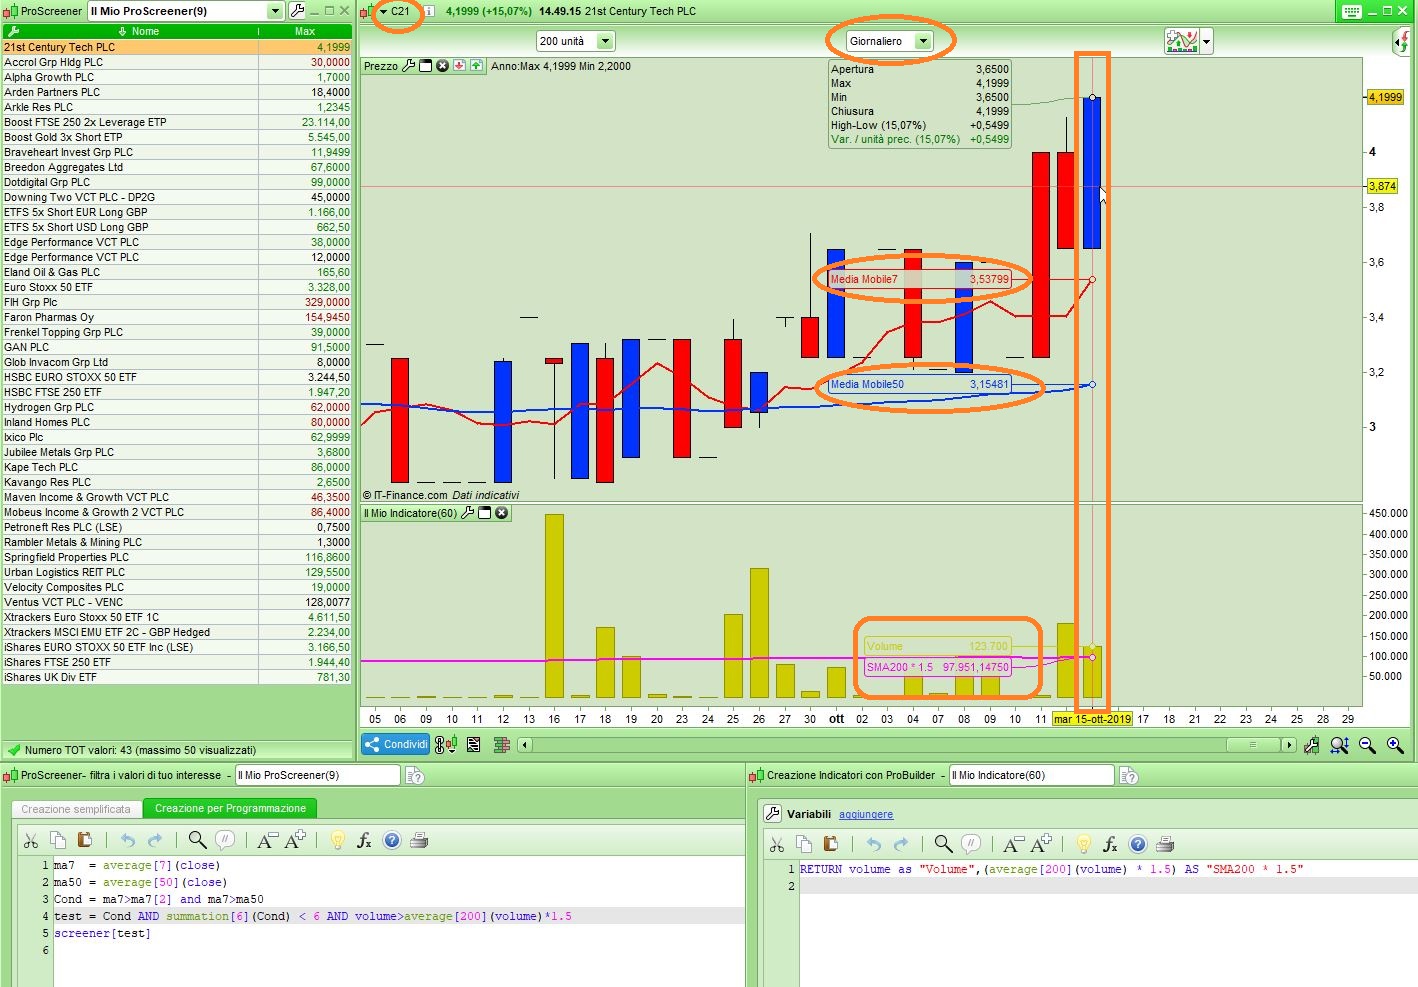
I have tested it, as from attached pics, on some stocks and it works finely.
Why didn’t you post the last bar on the chart. Bars/Candlesticks before the last, say 20-30, are useless. A screener monitors current prices. Not previous ones like indicators.
hi Robert thanks for your time , im not explaining myself well enough so im sorry for that
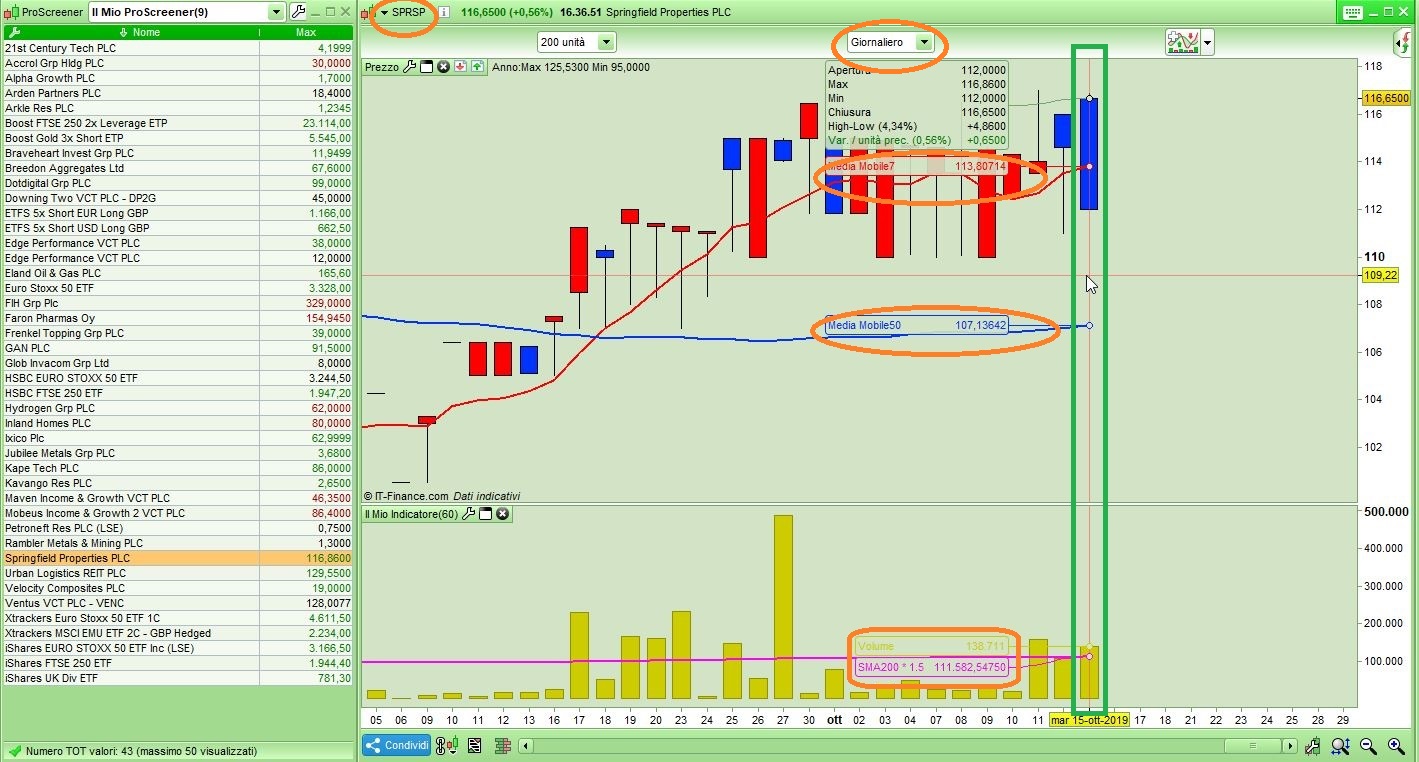
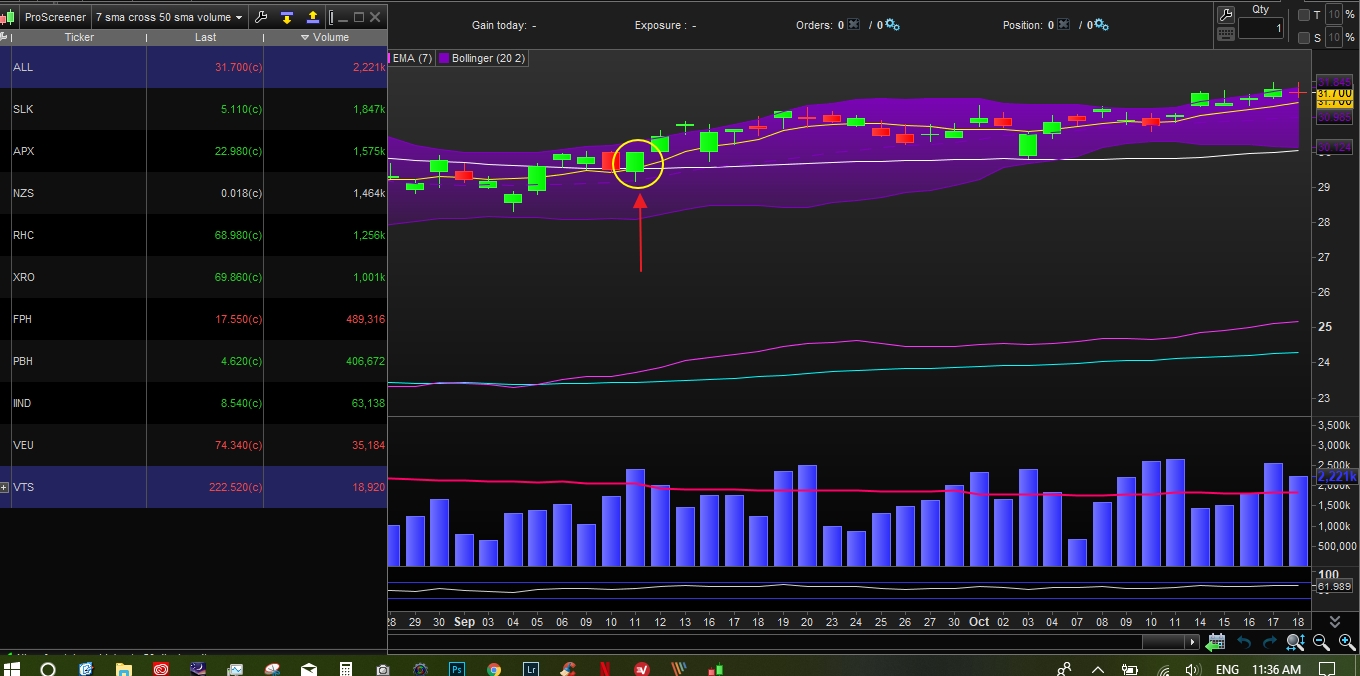
if you look at picture 2 the 7 day touches the 50 on day 18 and continues on an uptrend , there are 19 bars past day 18 to the current date
what im trying to screen for is to show stocks where the 7 day touches the 50 day trending up from below the 50 day , but only to a maximum of 5 bars from the most recent time the 7 day touched the 50 , in picture 2 this would mean the stock would of shown up on the screener only from day 18 through to day 23 (not sure why day 21 and 22 are missing in picture 2 but 5 days after the upward touch would be day 23)
thanks for your help and being patient i hope ive explained a little better what im trying to screen for
on your picture 2 5 bars after day 18 would be day 25 hopefully i can screen so that nothing after day 25 would show up as the run has well and truly started and id be expecting a retrace
i guess what im saying to hopefully make it really simple and the way i should of explained it earlier is
screen for 7 day touching 50 day in upward trend within the last 5 bars with volume 1.5 times average 200 day, i only screen after close of day
i guess what im saying is i want to see stocks that the 7 day sma has touched or gone above the 50 day sma less than 5 days from current close date
so i would see stocks that have touched on the current day
i would see stocks that are over on the next day trending up
i would see stocks that are over on day two after crossing and up to day 5 after crossing but must be trending up,
i hope im not being confusing , i know what i want just not how to explain it well i dont think
You are not being clear , i understand that you want stocks where 7ma has crossed the 50ma in the last 5 days , the rest is as clear as mud . be specific
I’m with BrisVegas on this one. Rather than posting thought after thought in several posts in a row why not try to think how to clearly describe the logic behind what you want and then post that in one well thought out post? 🙂
Phrases like ‘but must be trending up’ mean absolutely nothing to anybody. Better to be specific and say something like EMA 50 must be rising for last 5 bars.
yeah i confused myself in the end , sorry something to do with 3 weeks of 14 hour days and trying to work this stuff out
hope this is clear and thanks
7sma touches the 50sma in the last 5 days
volume 1.5 times 200 day average
7 day sma trending up last 3 bars
There you go:
ma7   = average[7,0](close)
ma50  = average[50,0](close)
Cond1 = summation[5](ma7 = ma50)
Cond2 = (summation[3](ma7 > ma7[1]) = 3)
test  = Cond1 AND Cond2 AND volume >= average[200,0](volume)*1.5
screener[test]
but I fear this will never return any match! In fact to adhere to your words “7sma touches the 50sma” I used the = operator at line 3, which will be hardly true!
If by touching you mean it can be X pips above or below, then line 3 needs to be amended accordingly, just tell us what you mean, other than equal.
yes your exactly right i should of wrote touches or crosses
as you thought there were no results with the above code , if you could help with 7 day touches or crosses the 50 day id very much appreciate it
thanks for your patience and help
Thank you for your feedback.
I will certainly help you as you let me know what “touches” mean.
You just said it does NOT mean equal, so the only other possibilities is that it means ABOVE or BELOW by N pips.
There you go:
ma7   = average[7,0](close)
ma50  = average[50,0](close)
Cond1 = summation[5](Abs(ma7 - ma50) <= 2 * pipsize)
Cond2 = (summation[3](ma7 > ma7[1]) = 3)
test  = Cond1 AND Cond2 AND volume >= average[200,0](volume)*1.5
screener[test]
at line 3 you can set your own value that bests suits your needs, be it 0.1 or 4.7 or whatever else.
brilliant thank you very much mate , i appreciate the time and patience you have shown , good luck to you in the future and hopefully this screener can get me some trades that make a few bags
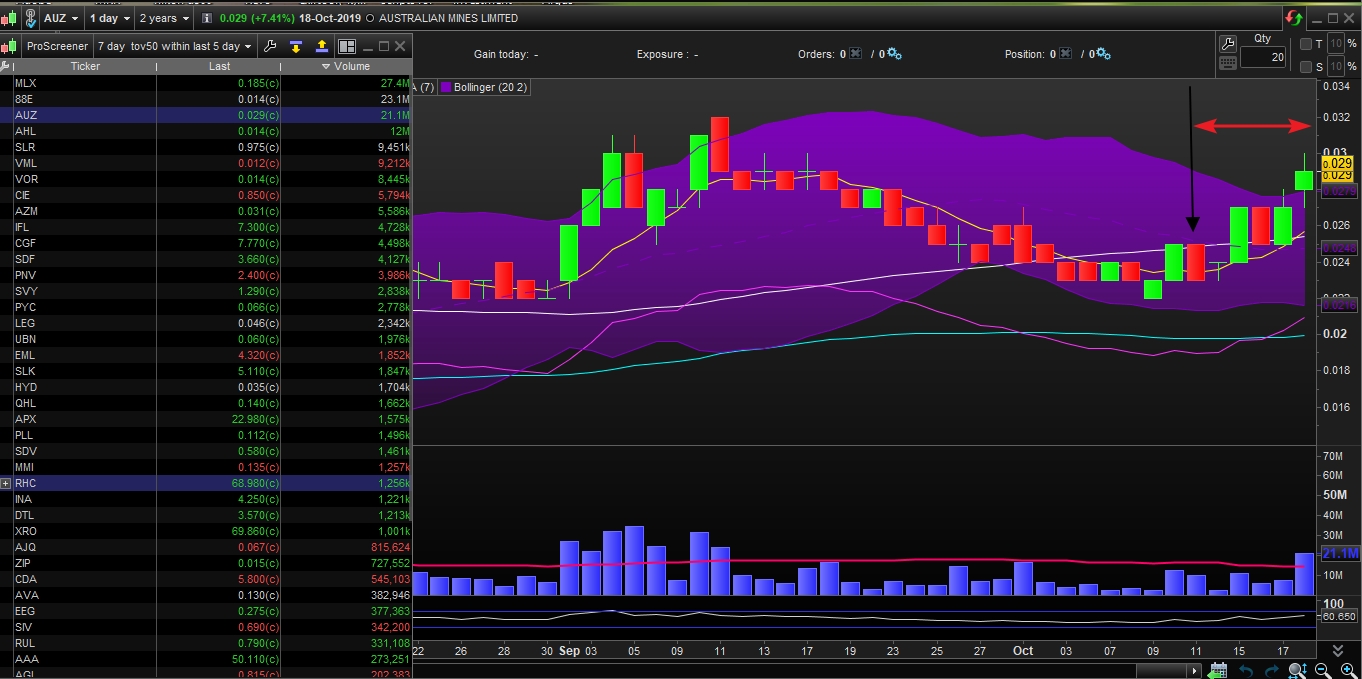
ive studied the code and i cant figure out why its still not working properly , ive added two images to show example of what im trying to screen
yellow line is 7 day sma white line is 50 day sma
image one is correct for what i want to screen for as the 7 day sma crossed over the 50 sma within the last 5 candles
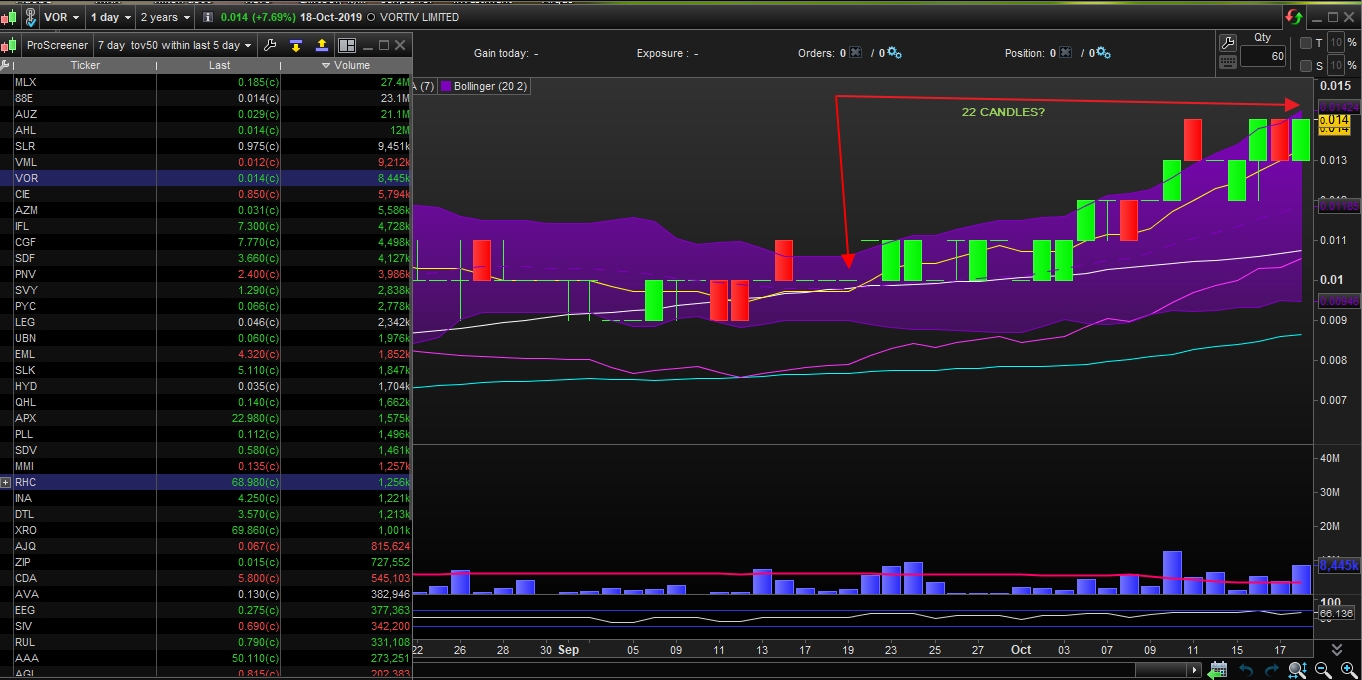
image two shows 22 candles from close where the 7 sma crossed over the 50 sma which i dont want to screen as i only need to see if its crossed in the last 5 candles
hope you can help once again as it is out of my knowledge range
regards
Yes, the logic was incorrect, try this one:
ma7   = average[7,0](close)
ma50  = average[50,0](close)
Cond0 = summation[6](Abs(ma7 - ma50) <= (2 * pipsize))
Cond1 = Cond0 > 0 AND Cond0 < 6
Cond2 = (summation[3](ma7 > ma7[1]) = 3)
test  = Cond1 AND Cond2 AND volume >= average[200,0](volume)*1.5
screener[test]
mmm still not working out , see image 7 day sma crosses at 19 bars from close not within 5 candles from current close date