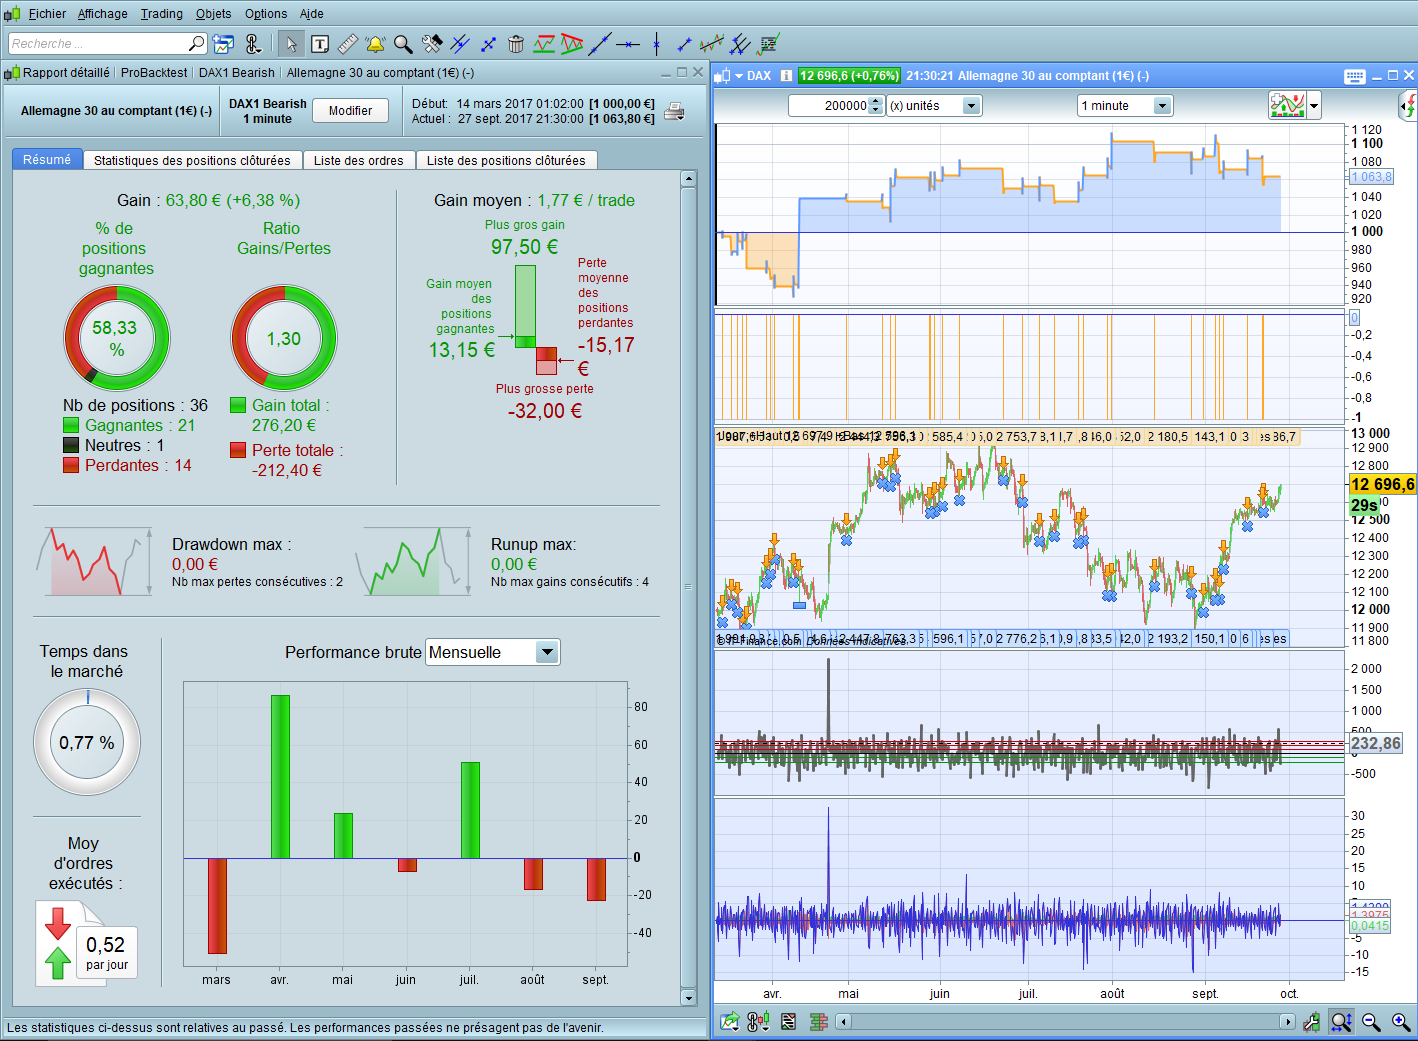
The short side of my version is about breakeven or a tiny profit in backtest (50% winners and 1,02 gain/loss ratio). But maybe good have the short in case of a downtrend. Not sure…
Best would then obviously be to adapt and test your strategy on something in a downtrend over the last 3 to 4 months.
I will ahne a closer look at this. I check only very quickly. I will let you know if I find something.
Hope this help…
from a Backtest on 200K, TF1′, Tick by tick.
To be checked.
That is the best I can get from my side…
DEFPARAM CumulateOrders = True
DEFPARAM FLATBEFORE = 085500 // 85500
DEFPARAM FLATAFTER = 200000
noEntryBeforeTime = 085500
timeEnterBefore = time >= noEntryBeforeTime
noEntryAfterTime = 170000
timeEnterAfter = time < noEntryAfterTime
daysForbiddenEntry = OpenDayOfWeek = 6 OR OpenDayOfWeek = 0

If longonmarket and close < positionprice and (barindex-tradeindex) > 650 Then
Sell at market
ElsIf shortonmarket and close > positionprice and (barindex-tradeindex) > 60 then
Exitshort at market
EndIf

body=close-open
abody=abs(body)
if range>0 then
ratio=abody/range
else
ratio=0
endif
longcandle= (ratio>0.6)
indicator1 = Average[1000](close)
c1 = (close CROSSES UNDER indicator1)

Bear = 0

//Bearish Signal

ThreeInsideDown=(body[2]>0 and body[1]<0 and body<0 and close<close[1])
if ThreeInsideDown then
Bear = 1
endif

ThreeBlackCrows=(body[2]<0 and body[1]<0 and body<0 and longcandle[2] and longcandle[1] and longcandle and low[1]<low[2] and low<low[1] and close[1]<close[2] and close<close[1] and open[1]<open[2] and open[1]>close[2] and open<open[1] and open>close[1])
if ThreeBlackCrows then
Bear = 1
endif

//Entry/Exit Criteria

possize = 1

NearMA = Average[7,2](close)
If countofposition = 0 and Bear = 1 and NearMA[1] < NearMA[3] and RSI[2](close) < 25 and NearMA < Average[150,2](close) and c1 and timeEnterBefore and timeEnterAfter and not daysForbiddenEntry Then
//If shortonmarket Then
//Exitshort at market
//EndIf
sellshort possize contract at market
EndIf

//trailing stop
trailingstop = 10

//resetting variables when no trades are on market
if not onmarket then
MINPRICE = close
priceexit = 0
endif

//case SHORT order
if shortonmarket then
MINPRICE = MIN(MINPRICE,close) //saving the MFE of the current trade
if tradeprice(1)-MINPRICE>=trailingstop*pointsize then //if the MFE is higher than the trailingstop then
priceexit = MINPRICE+trailingstop*pointsize //set the exit price at the MFE + trailing stop price level
endif
endif

//exit on trailing stop price levels
if onmarket and priceexit>0 then
EXITSHORT AT priceexit STOP
SELL AT priceexit STOP
endif

Set Target %Profit 0.8 // 0.42
SET STOP %loss 0.34 // 0.46
I played a little bit around with the short side and interestingly same as for the long side, thursdays are losing days. Mondays are much better short though with being second best (wednesdays are best).
No matter what, you don’t want to trade this strategy on thursdays, that’s for sure.
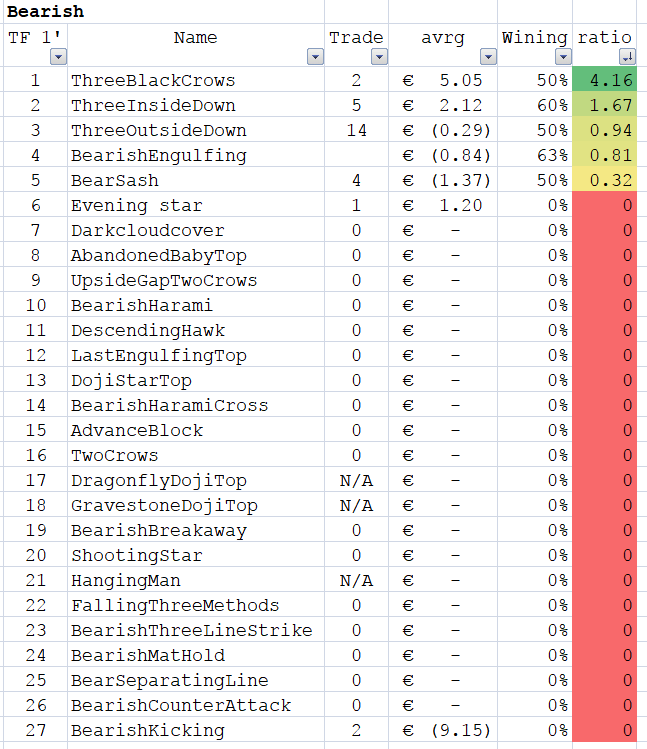
Okay folks, time for us to change gear. Let’s build a lean long and short scalper based on real research.
This guy has done some serious research on all known candlestick patterns. He has documented over 1000 candlestick patterns along with their stats.
Here is his Top 10 (I have already started coding some of them)
Bulkowski’s Top 10 Continuation Candlesticks:
http://thepatternsite.com/CandleContinue.html
Bulkowski’s Top 10 Reversal Candlesticks:
http://thepatternsite.com/CandleReverse.html
Bulkowski’s Top 10 Performing Candlesticks:
http://thepatternsite.com/CandlePerformers.html
Here is something I coded to use as a platform for testing the different candlestick patterns.
Defparam cumulateorders = False

If hour > x and hour < x+y Then
possize = 1
If positionperf(1) < 0 and positionperf(2) < 0 Then
possize = possize*2
ElsIf positionperf(1) < 0 Then
possize = possize*3
ElsIf positionperf(1) > 0 and positionperf(2) > 0 and positionperf(3) > 0 Then
possize = possize*3
ElsIf positionperf(1) > 0 and positionperf(2) > 0 Then
possize = possize*2
EndIf
Else
If longonmarket then
sell at market
ElsIf shortonmarket then
exitshort at market
EndIf
possize = 0
EndIf

//Three Line Strike Buillish Reversal
//If countofposition = 0 and (close[3] < open[3] and low[2] < low[3] and close[2] < close[3] and low[1] < low[2] and close[1] < close[2] and low < low[1] and open < close[1] and close > high[3] and close < Average[20](close)) Then

//Three Black Crows Bearish Continuation
If countofposition = 0 and (close[2] < open[2] and ((high[2] - open[2]) <= (open[2]-close[2]/5)) and ((close[2] - low[2]) <= (open[2]-close[2]/5)) and open[1] > low[2] and close[1] < open[1] and ((high[1] - open[1]) <= (open[1]-close[1]/5)) and ((close[1] - low[1]) <= (open[1]-close[1]/5)) and close[1] < low[2] and open > low[1] and close < open and ((high - open) <= (open-close/5)) and ((close - low) <= (open-close/5)) and low < low[1] and close < Average[20](close)) Then
Sellshort possize contract at market
EndIf

If positionperf(1) < 0 Then
Set Stop $Loss 90/possize
EndIf
Set Target $Profit 30*possize
 AVT
AVTParticipant
Senior
@juanj The patternsite was “my dentist” at least for Dax, as he often already says patterns used to perform better in the past. Even when concentrating on the tops, I went better with breakout line patterns than with candle patterns. Just my experience.
@juanj
As I mentioned before I have access to powerful computers with internet access that is online 24/7.
I did dome comparative tests. The conclusion is the more processing power does make some difference but the bottle neck is still data transfer from PRT.
I can’t write code but I’m willing to help you with backtesting and WFA on these strategies.
Thank you.
@AVT I am not familiar with the expression ‘My Dentist’ but take it you meant you used to reference it regularly as an authoritative source.
I have found that much of his research still hold value today. So pattern reliability may have changed but I still use it on a daily basis as confirmation of my other signals.
I think there is still value in Bulkowskis work on both candlesticks and chart patterns but one has to keep in mind that he did all his research on stocks. Some of them might also apply to commodities and stock indices but some also might be plain wrong for other assets than stocks.
@Andre: I’m actually wondering where is done what when running a backtest. I was surprised what happened to me this week. I was running a backtest and then my internet failed so I was disconnected from the PRT server (happens since I live outside town little in the woods and still waiting for somebody to lay fiberoptic-cable to my house LOL). Anyway the backtest seemed unaffected and continued also while I was disconnected. I was amazed to see this since I thought all was done on the server side. So this would mean that backtest ARE run on ones computer and therefore should speed up with more computing power.
AVTParticipant
Senior
@juanj Sorry, it’s based on a phrase. Example: I have the idea, buy every 3rd day and sell 2 days later. Now you answer, due to statistics you are ruined within a month. “You pulled me this tooth” means you convinced me, that this idea does not work. If we play this several times, you might say, seems I am your dentist, next time I will invoice the treatment 😉