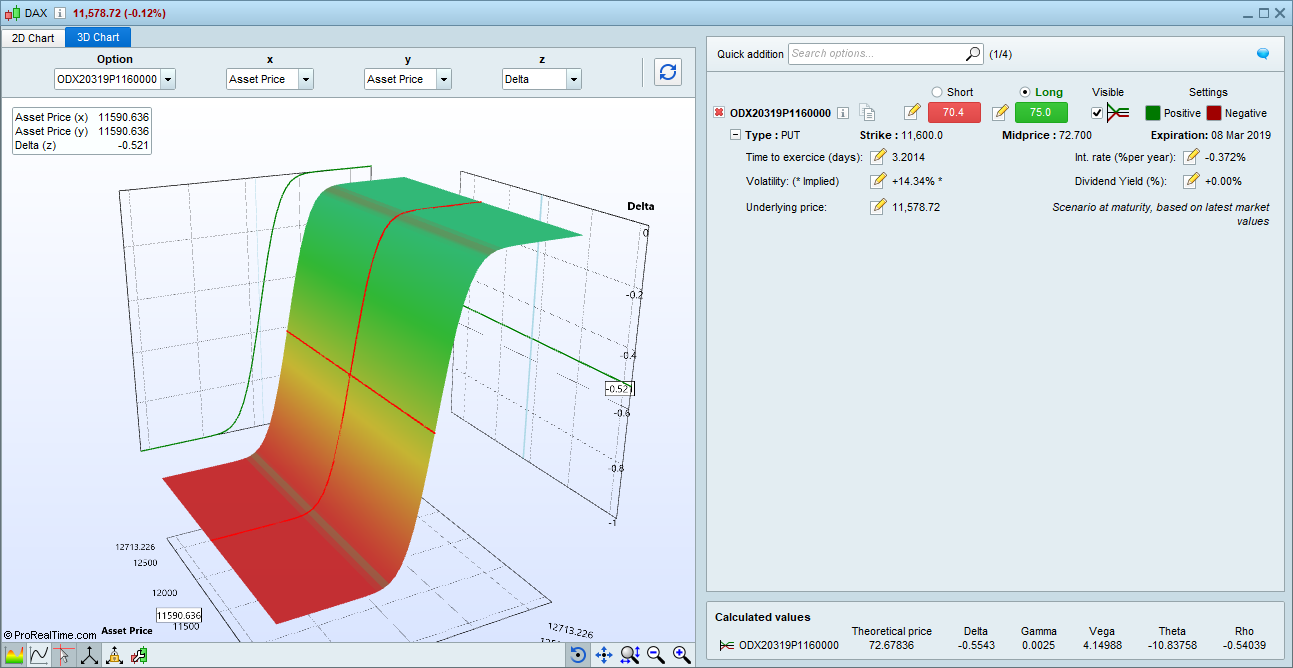
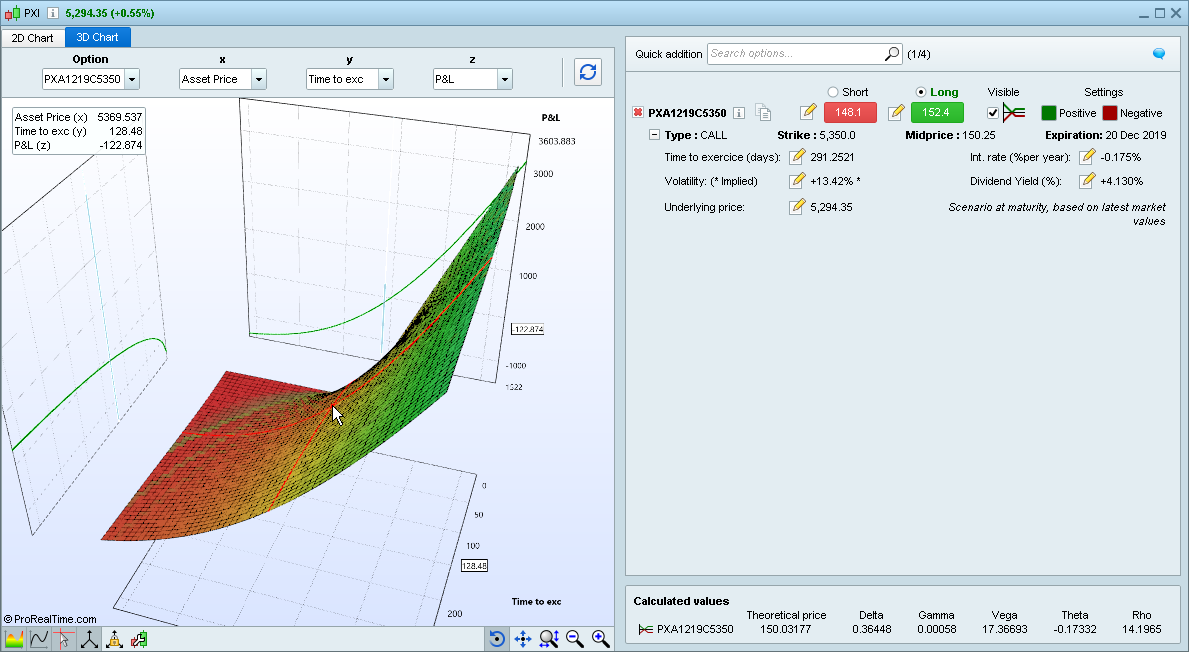
Options pricer – 3D charts
The options pricer chart can now be viewed as a 3-dimensional chart.
[attachment file=”option price 3d chart prorealtime v11 – 2.png”]
need create order from screener
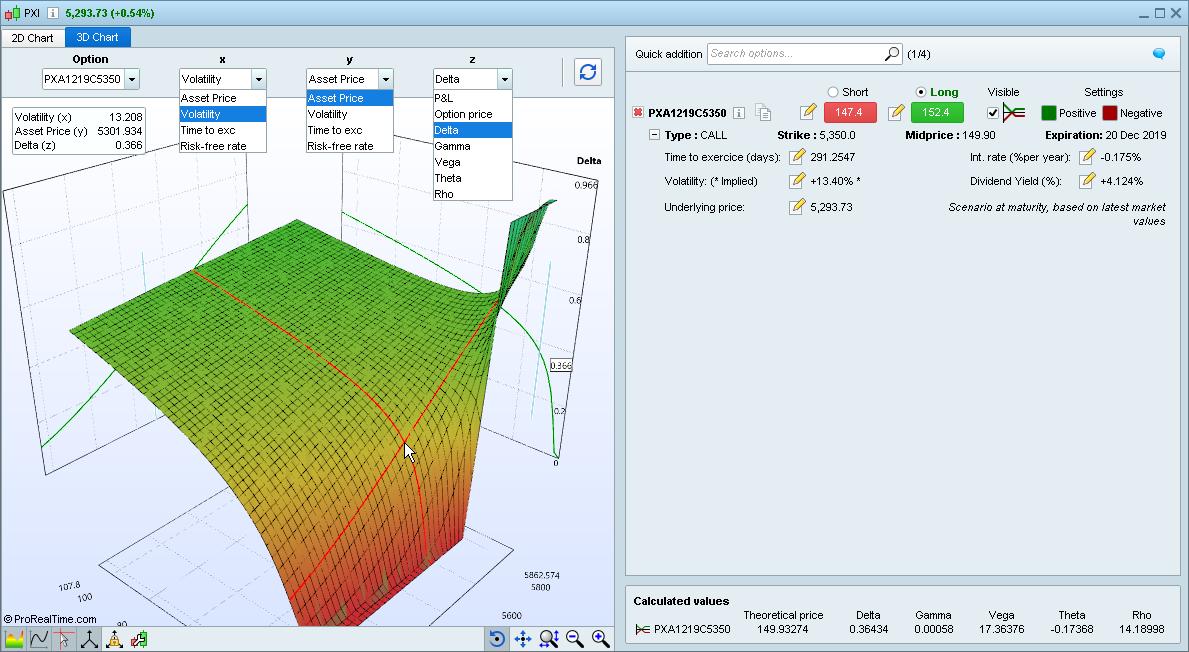
Settings of the new 3D options pricer
X &Y axis variables for the new 3D options pricer include : Underlying asset price, Volatility, Time until exercise, Risk-free rate Variables. Z-Axis variables include : P&L, Option price, Delta, Gamma, Vega, Theta, Rho
[attachment file=”option 3d chart prt v11.jpg”]
Historical mode and max history
The new “Historical Mode” in ProRealTimeV11 Premium is dedicated to analysis and backtesting. It allows you to display charts with up to 1 million candles! Yes, we did say 1 million candles.
Yes, we did say 1 million candles.
Wow, just wow!
Things are looking up!!! 🙂
And as far as I could read this morning in a tweet, the 1M candles can go further back into history by selecting a start/end time, so if you just used the last 1M candles on a 1-minute backtest you get, roughly 3 and a half years to fully backtest, but you can select another 3.5 years prior to your first starting backtest date and thus backtest 7 years….
Of course those results are split and maybe you cannot just double performances, but it’s still a huge improvement!
More historical data!
Historical mode also lets you get historical data even farther in the past by selecting a specific date range (ex: Dax Future chart in 1 minute timeframe with 1 million candles covering the period 2009-2014).
this effect also the NVOL candles? because the history is only 6 months for now.
Hi, the extendend history is available for premium only?
when is the new release expected to become available?
Thank you!
Francesco
@Gianluca – please don’t quote whole posts if they include large amounts of text, images or videos. I have deleted your quote as it was making your text hidden and unreadable and also that of the next post! If you want to quote someone then please just highlight the small bit of relevant text and then hit quote rather than quote the whole post.
Hi, the extendend history is available for premium only?
It is not defined yet what will be included in Premium and “normal” accounts or not.
when is the new release expected to become available?
End of March or in April.
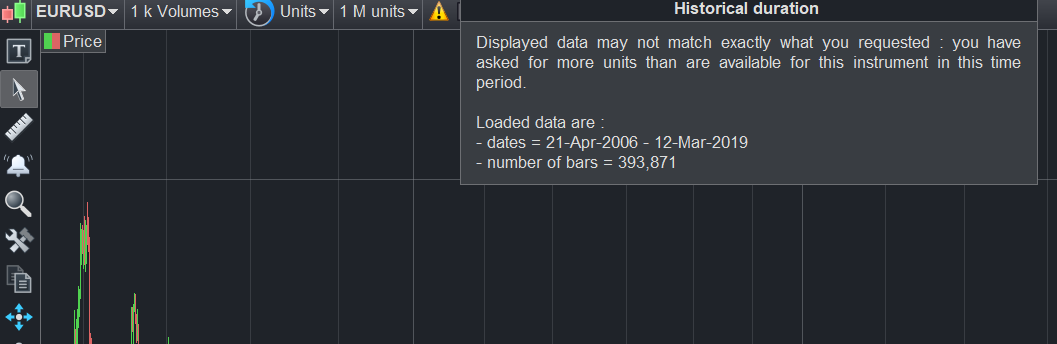
this effect also the NVOL candles? because the history is only 6 months for now.
It obviously depends of the instrument history available, but look at this picture: back to 2006 for EURUSD 1k Volume bars
[attachment file=”nvolumes candlesticks prorealtime.png”]
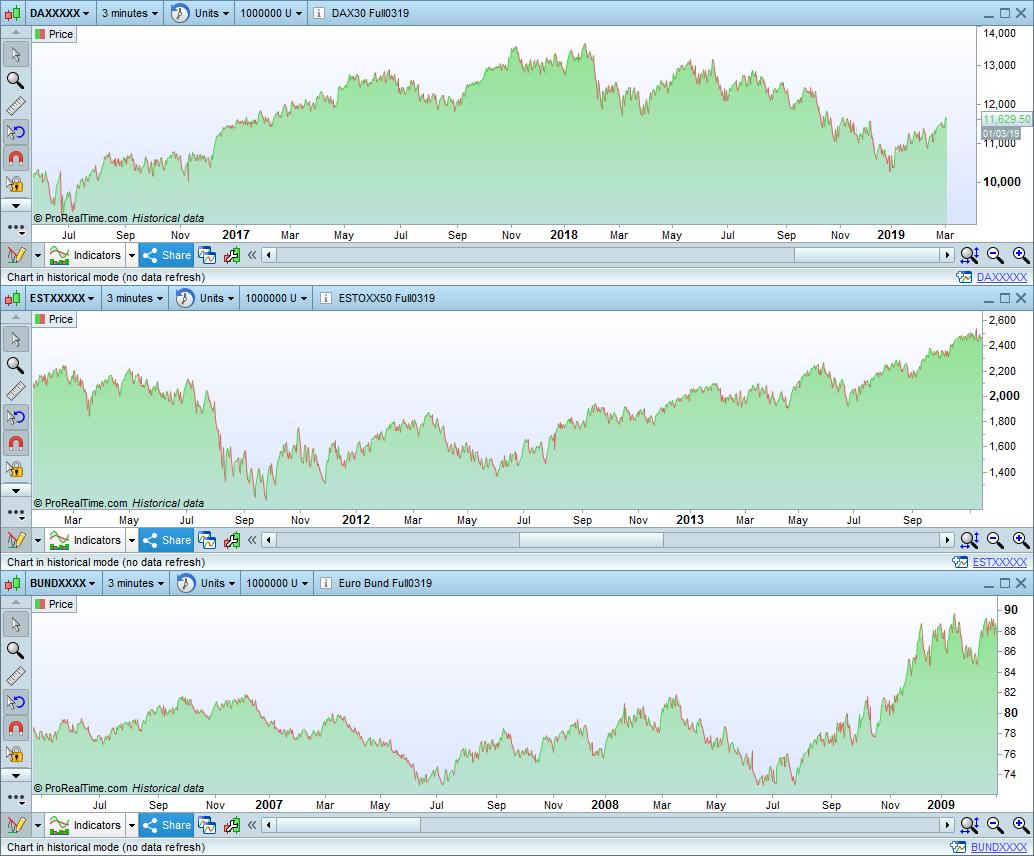
Historical mode charts quantity
Up to 3 charts in historical mode with up to 1 million candles of each can be displayed at one time in the Premium version, on the same instrument with different historical periods, or on different instruments.
[attachment file=”historical mode charts quantity prt v11.jpg”]
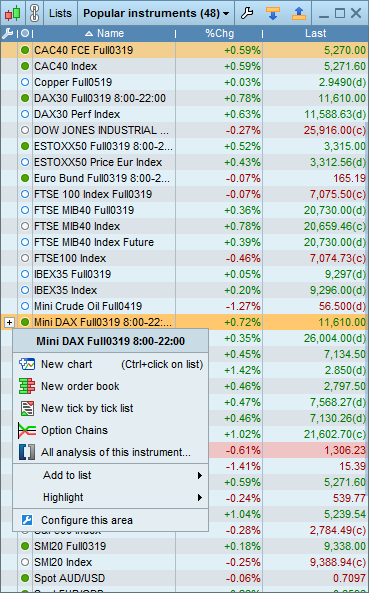
Quick access to tools in lists
Click on the [+] icon in lists to quickly access features such as opening a chart or order book on the instrument, displaying analysis on the instrument, opening a tick by tick list, etc …
[attachment file=”Tools quick access in lists prorealtime version 11.png”]
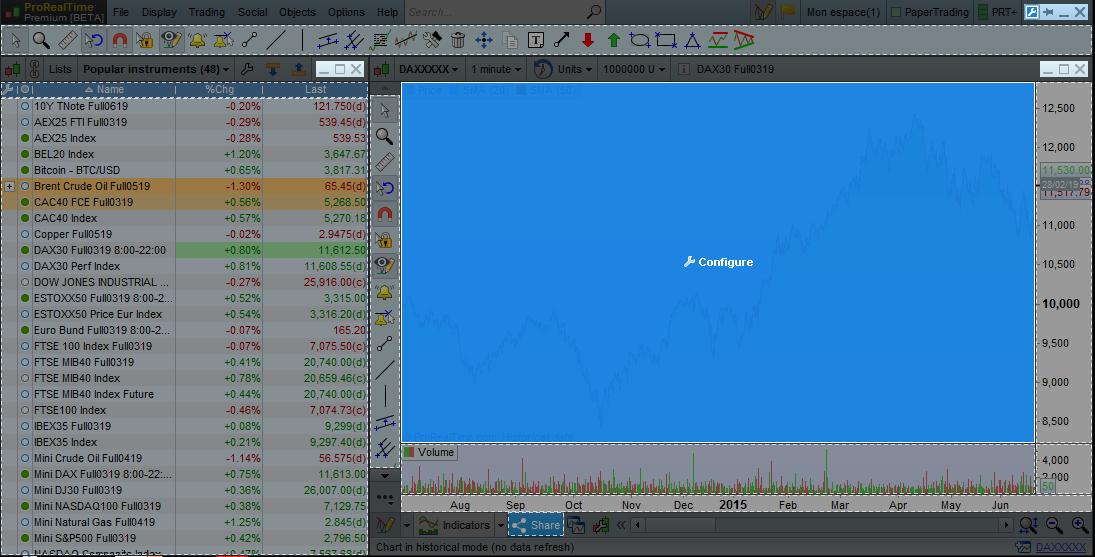
Quicker and easier configuration
A quick configure button is now available. This enables configuration mode which lets you select a zone of a window of your choice to immediately open the configuration options of the related zone.
[attachment file=”quick configuration prorealtime version 11.jpg”]
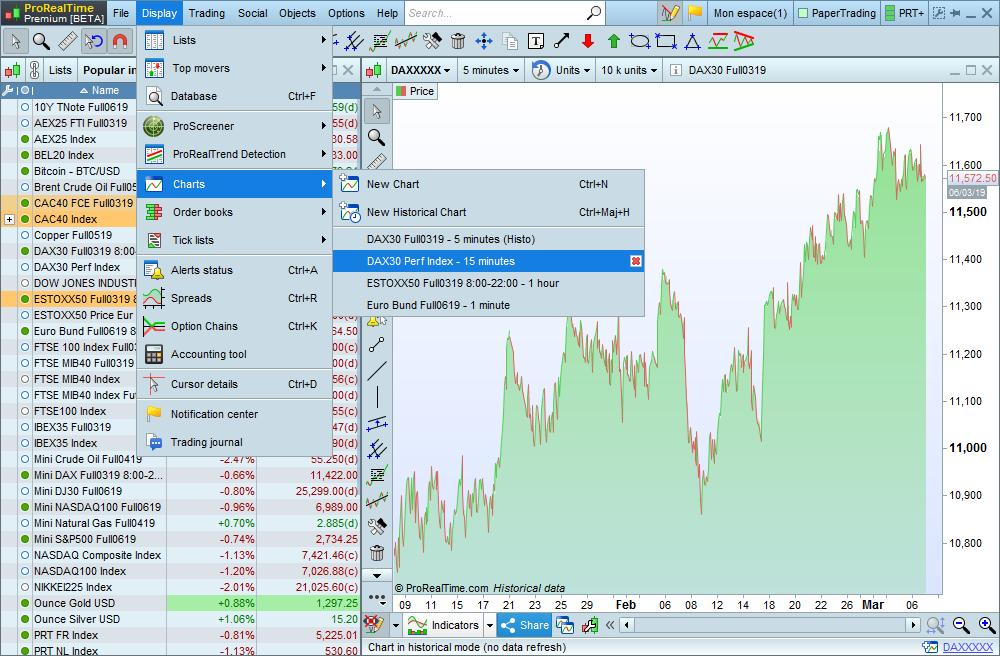
Find recently opened windows
Charts, order books and tick by tick lists have been added to the display menu so that you can find recently opened windows more easily directly from this menu.
[attachment file=”recently opened charts prt v11.jpg”]