







Bollinger Bands Squeeze screener, daily volatility compression with ATR ratio
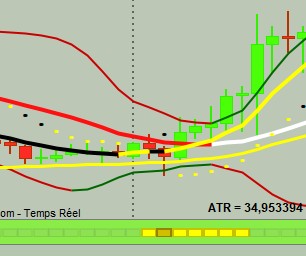
This screener scans for instruments where Bollinger Bands have compressed relative to the Average True Range, a condition known as the Bollinger Band squeeze. It is designed for daily charts and uses a ratio-based approach to measure how tight price has become before a potential explosive move.
What is a Bollinger Band squeeze?
Bollinger Bands expand and contract as market volatility rises and falls. When they compress to an unusually narrow range, it tends to signal that the market is coiling energy, with buyers and sellers reaching a temporary equilibrium. This kind of low-volatility consolidation often precedes a sharp directional breakout, though the squeeze itself does not tell you which direction the move will go.
The concept was originally popularised by John Bollinger and later refined by John Carter in his TTM Squeeze indicator, which checks whether Bollinger Bands have moved inside a Keltner Channel. This screener takes a leaner, ratio-based approach to the same idea, making it fast to compute and easy to understand.
How the code works
The screener computes two things on a 20-period lookback:
First, it calculates diff, which is the Average True Range multiplied by 1.6. This acts as a volatility baseline, a scaled ATR measure that approximates the effective width of a Keltner-style channel band.
Second, it calculates stdd, the standard deviation of close prices over 20 bars. The full Bollinger Band width at one standard deviation is 2 * stdd.
The squeeze ratio bbs is then simply 2 * stdd / diff. When this value drops below 1, the Bollinger Band width has contracted to less than the ATR-based reference level, which is the squeeze condition. The screener flags all instruments where bbs < 1.
The logic is compact and direct:
// D - Sqz
diff = averagetruerange[20]*1.6
stdd = std[20](close)
bbs = 2*stdd/diff
C1 = bbs < 1

Screener [c1]
How to use it
Run this screener on a daily timeframe across your watchlist or a broad market index. The instruments it returns are not buy or sell signals on their own, they are candidates worth watching. The squeeze tells you that a breakout is potentially building. You then look at the chart manually to judge the context: is price pressing against a resistance level, forming a tight range near a key moving average, or consolidating after a trend?
Pairing this screener with a trend filter is a common approach. For example, you might add a condition that the 50-period moving average is above the 200-period moving average to focus only on squeeze setups in a broader uptrend. Alternatively you can use it in both directions and look at the chart to decide whether the setup favours buyers or sellers.
The ATR multiplier of 1.6 was chosen to give a sensitivity midway between the tighter setups you get at 1.5 and the broader net cast at 2.0. If you find the screener returning too many results on your preferred market, raising the multiplier slightly will make the squeeze condition more selective.
Relationship to the TTM Squeeze
The well-known TTM Squeeze checks whether Bollinger Bands sit entirely inside a Keltner Channel by comparing upper and lower bands individually. This screener achieves a very similar result with a single ratio, which makes the condition easier to read and quicker to compute at scale. The ATR multiplier of 1.6 was calibrated to produce results that closely match the TTM Squeeze detection without needing to calculate both the upper and lower KC boundaries explicitly.
Practical notes
The screener works best when run at the close of the daily session or at the start of the next trading day, once the previous bar is complete. Running it intraday on a partial bar can produce false positives since both ATR and standard deviation are still forming.
Because the squeeze ratio naturally varies by asset class, you may find that equity indices or low-volatility stocks show more frequent squeezes than commodities or high-beta tech names. It is worth building a feel for what a typical bbs value looks like on your favourite markets before acting on results.
Results are most meaningful when bbs has been below 1 for several consecutive bars rather than just dipping under the threshold for a single session. A prolonged squeeze tends to produce a more significant release of energy when it eventually breaks.
Comments
You must be logged in to post a comment.

Hello. I load it now on my PRT v13.
I don't see anything in the "criterion" column.
This screener performs well if the SAR and ME50 are below current prices. For those working with MTFs, confirmation can be provided by higher-level units.
New version here: