Vostro – VST

v10.3
Vostro – VST

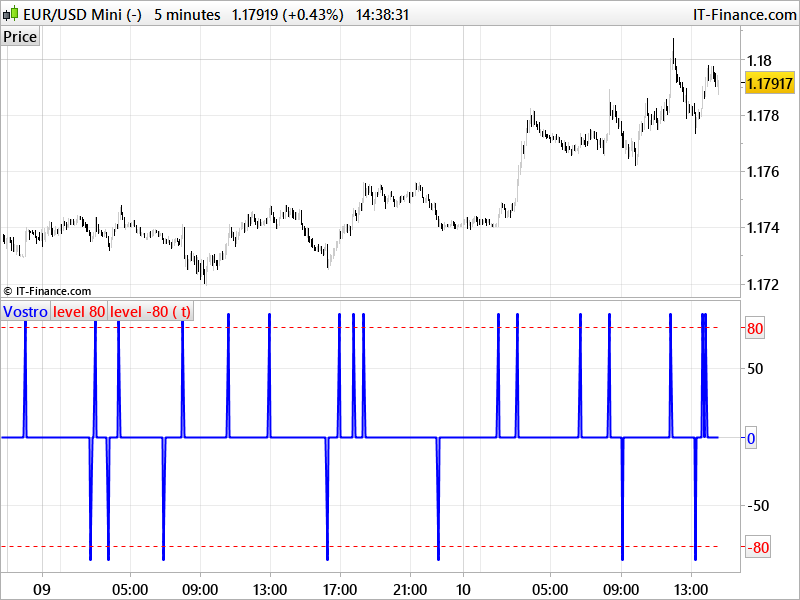
The VOSTRO indicator is a trend indicator that automatically provides buying and selling signals. The indicator marks in a window the potential turning points. The indicator is recommended for scalping.

The Vostro indicator determines the overbought zones (value greater than +80) and the oversold zones (less than the -80 level)

BUY signal: The Vostro curve moves below the -80 level and forms a trough – Turnaround of the upward trend

SELL signal: The Vostro curve moves above the +80 level and forms a peak – Downward trend

(description found on the web, conversion from MT4 code by a request in the english indicator section).

Share this

Risk disclosure:

No information on this site is investment advice or a solicitation to buy or sell any financial instrument. Past performance is not indicative of future results. Trading may expose you to risk of loss greater than your deposits and is only suitable for experienced investors who have sufficient financial means to bear such risk.

ProRealTime ITF files and other attachments : How to import ITF files into ProRealTime platform?

PRC is also on YouTube, subscribe to our channel for exclusive content and tutorials

  1. Talero125 • 10/10/2017 #

    Hello! I would like to test the indicator Balance of power! The Balance of Power indicator measures the market strength of buyers against sellers by assessing the ability of each side to drive prices to an extreme level. The calculation is: Balance of Power = (Close price – Open price) / (High price – Low price)

    I found this code in internet but it doesn´t work in Prorealtime so I need your help please! Thank you very much

    //@version=3
    study(“True Balance of power”)
    per=input(30, title=”periods for Emoline”, type=integer, step=1, minval=4)
    trhi = max(high, close[1]) //true high
    trlo = min(low, close[1]) //true low
    trop = close[1] //true open
    bop = 100*(close-trop)/(trhi-trlo) //True Balance of Power as percent
    lin= 1.5*linreg(bop, per, 0) //linear regression as emoline
    bgcolor(lin0?green:orange, style=columns) //plot BOP as columns
    plot(lin, title=”Emoline”, color=rising(lin,2)?blue :black, linewidth=3) //plot emoline as line
    hline(0, linestyle=line) //zero level

    • Nicolas • 10/10/2017 #

      Please open a specific topic in probuilder support forum.

  2. Talero125 • 10/10/2017 #

    I have just opened a new topic in probuilder support forum! Thank you

  3. swapping • 10/10/2017 #

    Bonjour Nicolas, comment doit-on modifier le code (ou ajouter la variable “style”) pour que l’on puisse sélectionner les signaux (achat/vente) en barre rouge et verte ?
    Par avance merci pour ce code qui offre beaucoup d’avantage

    Cordialement

    • Nicolas • 10/10/2017 #

      Il faut changer la dernière ligne du code par :
      return ibuf108 style(line,2) as “Vostro”, 80 coloured(255,0,0) style(dottedline,1) as “level 80”, -80 coloured(255,0,0) style(dottedline,1) as “level -80”
      et sélectionner soit même les couleurs désirées directement dans la fenêtre de paramétrage de l’indicateur pour hausse/baisse

  4. swapping • 10/10/2017 #

    Merci beaucoup Nicolas, c’est mieux ainsi …

avatar
Register or

Likes

avatar avatar avatar avatar avatar avatar avatar
Related users ' posts
Naren Yanan what is    diplus  diminus  please
Barney Has anyone tested this algon now when PRT 10.3 was released?
Yngve does anyone know if the issue with the TP/SL is resolved ?
JakeDB Answered my own question....Sorry about this question. 5 positions, take profit at 15, loss ...
maxxb sto facendo girare in demo questa strategia modificata a 10 minuti con stop e profit ottimiz...
Manuel9z Hello, this strategy improves with the SL 30 and the TP 10. I have done backtesting and it w...
raviesco Hello Nicolas, Thanks for the post. Do you have an updated version of this screener/indi...
Nicolas
9 years ago
Jean-Claude REGIS ok merci pour la rapidité de la réponse  cordialement    vu ça fonctionne me reste q...
Balian Merci pour l'indicateur J'ai l'impression qu'un truc cloche. Les triggers sont systémtiqeme...
Balian Tout va bien. J'avais mal lu
Nicolas
9 years ago
XBKZ Bonjour, Je trouve votre indicateur très intéressant. J'ai essayé de créer un autre indicat...
Nicolas Pour visualiser une variable, il suffit de l'ajouter dans la fonction RETURN et la plateform...
cruxtrader Hello Nicolas, Is this script Ninjatrader Compatible ?
Sofitech Bonjour. J'aimerais savoir s'il est possible de "truquer" un peu l'indicateur pour qu'il don...
Maz I actually like this very simple idea. It can also be useful for market micro-structure syst...
Nicolas Thanks Maz, I'll have a look tomorrow.
patrick3 Merci Nicolas pour cet indicateur, il est très utile pour voir les vagues

Top