Volume Gaps & Imbalances
Introduction
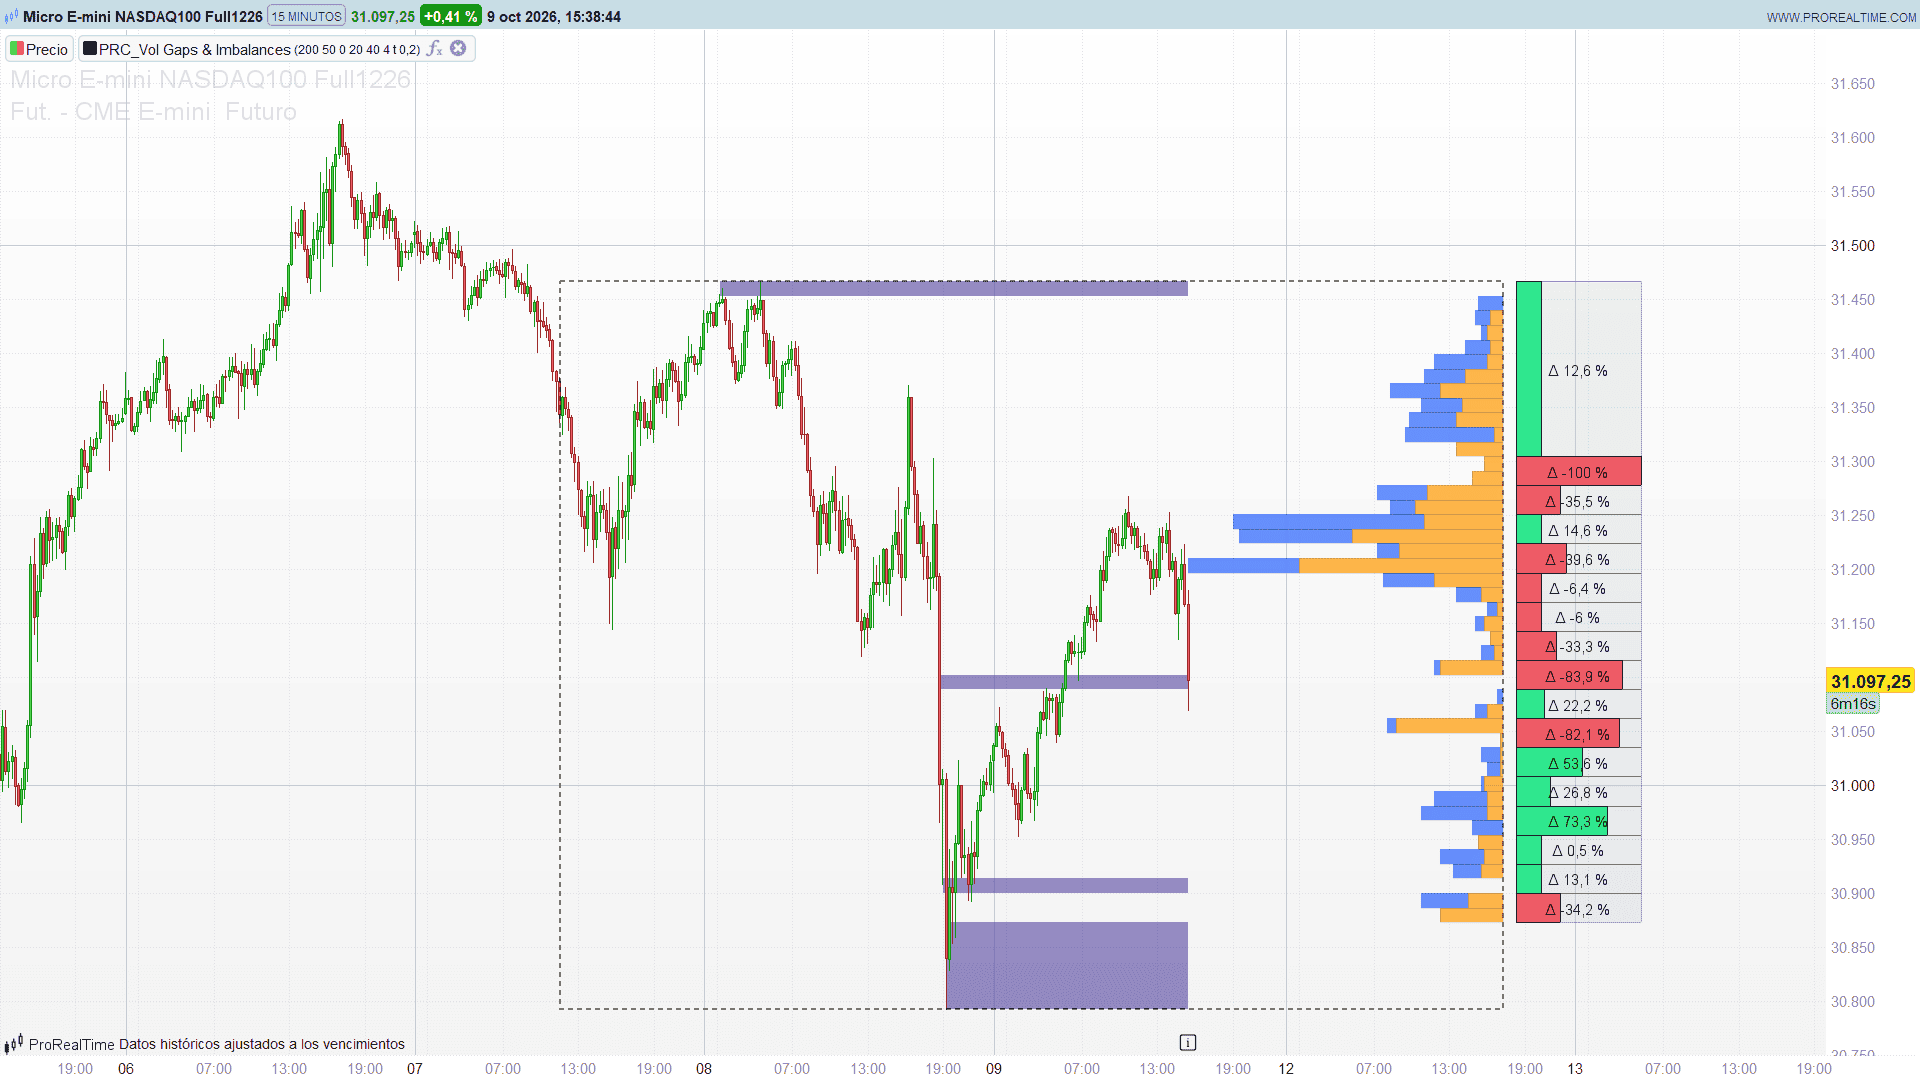
Volume Gaps & Imbalances is a volume profile with two extra layers that answer two practical questions: where has the market not traded at all, and who has been in control at each price area. It builds a profile of the last 200 bars to the right of price, shades the price rows where no volume was traded, and adds a side panel that turns the profile into buy/sell delta percentages, section by section.
Zero-volume rows are liquidity holes: price crossed them quickly and left nothing behind. When the market comes back to one of them it tends to travel through it fast, and the edges of the hole often act as reaction levels. The delta panel tells you whether the volume above and below those holes came mostly from rising or from falling bars.
Theory Behind the Indicator
The profile
The indicator takes the highest high and the lowest low of the lookback window and splits that range into a number of equal price rows (50 by default). Each bar of the window is placed in one row according to its typical price (high + low + close) / 3, and its volume is added to that row:
- as bull volume if the bar closed above its open,
- as bear volume otherwise.
Each row is drawn as a horizontal bar proportional to its total volume, with the largest row filling the full profile width. The bull part (blue) and the bear part (orange) are shown side by side, so you see at a glance both how much was traded at each price and which side dominated.
Zero-volume zones
A row whose total volume is zero is a gap in the profile: no bar of the window had its typical price inside it. Consecutive empty rows are merged into a single zone, and each zone is shaded from the first bar of the window whose high-low range touched it up to the current bar. That starting point shows when price first went through the hole.
Delta summary
The rows are grouped into vertical sections (20 by default). For each section the indicator adds the bull and bear volume of its rows and computes:
delta % = (bull volume – bear volume) / total volume x 100
The result goes from -100% (only falling bars) to +100% (only rising bars). It is drawn as a green bar for a positive delta and a red bar for a negative one, with a minimum length so that small imbalances stay visible, and the percentage is written on the panel.
Key Features at a Glance
- Volume profile of the last N bars, split into bull and bear volume per row.
- Automatic detection of zero-volume price rows, merged into zones.
- Zones shaded from the first bar that crossed them to the current bar.
- Delta panel with the buy/sell imbalance of each price section, in percent.
- Dotted frame showing the range used by the profile.
- Everything is rebuilt on the last bar, so the profile always reflects the current window.
How to Read the Indicator
- Shaded zones are thin areas. Price moved through them without building any volume. Expect fast moves when price re-enters a zone, and watch its upper and lower edges as possible reaction levels.
- Large profile rows are acceptance areas. The widest rows show where the market spent most of its volume; they usually behave as support or resistance.
- The colour split inside a row tells you whether that acceptance came from rising or falling bars.
- Green sections in the delta panel mean buyers dominated that price area; red sections mean sellers did. A strongly red section above the current price, for example, points to supply that may cap a rally.
- Delta next to a zero-volume zone helps to judge the hole: a gap with strong buying below and strong selling above is a typical imbalance that price may want to fill.
Practical Applications
- Targets and stops. When price breaks into a zero-volume zone, the opposite edge of the zone is a natural first target. Placing stops inside a zone is usually a poor idea, because price tends not to stay there.
- Context for breakouts. A breakout from a high-volume row into a thin area tends to accelerate; a breakout into a heavy row tends to stall.
- Reading the auction. Combine the profile and the delta panel to see whether the dominant volume at the current price is building on the buy or on the sell side.
Indicator Configuration
Profile settings:
- prd (default: 200): number of bars used to build the profile and the zones (50 to 2000). Higher values give a smoother, more stable profile at a higher calculation cost.
- nRows (default: 50): number of price rows between the highest and lowest price (10 to 100).
- srcMode (default: 0): price used to place each bar in a row. 0 = typical price (HLC3), 1 = the price selected in the indicator settings (CustomClose).
Profile styling:
- profW (default: 100): width in bars of the profile drawn to the right of price.
- bullR, bullG, bullB, bullA: colour and opacity of the bull volume.
- bearR, bearG, bearB, bearA: colour and opacity of the bear volume.
- zoneR, zoneG, zoneB, zoneA: colour and opacity of the zero-volume zones.
Delta summary:
- sumSections (default: 20): number of stacked sections in the delta panel.
- sumPanelW (default: 40): width in bars of the delta panel.
- sumGapX (default: 4): gap in bars between the profile and the delta panel.
- showDeltaText (default: 1): 1 shows the delta percentage of each section, 0 hides it.
- deltaMinFrac (default: 0.2): minimum length of a non-zero delta bar, as a fraction of the panel width.
Delta styling:
- posR, posG, posB, posA: colour of a positive delta (buy volume above sell volume).
- negR, negG, negB, negA: colour of a negative delta.
- neuR, neuG, neuB, neuA: background of the delta panel.
- txtR, txtG, txtB: colour of the delta text.
The profile, the zones and the panel are drawn to the right of the last bar: leave some free space on the right of the chart (about 150 bars with the default settings) to see them in full.
Code
//---------------------------------------------------------------
// PRC_Vol Gaps & Imbalances
// version = 0
// 09.10.2026
// Iván González @ www.prorealcode.com
// Author: Zeiierman
// Sharing ProRealTime knowledge
//--------------------------------------------------------------------//
defparam drawonlastbaronly = true
//--------------------------------------------------------------------//
// Profile settings
//--------------------------------------------------------------------//
prd = 200            // Lookback: bars used to build the profile (50 - 2000)
nRows = 50           // Rows: price bins between the highest and lowest price (10 - 100)
srcMode = 0          // Price used to place each bar in a row: 0 = typical price (HLC3), 1 = CustomClose
//--------------------------------------------------------------------//
// Profile styling
//--------------------------------------------------------------------//
profW = 100          // Profile placement: width in bars of the profile drawn to the right of price
bullR = 41           // Bull colour (bars with close > open)
bullG = 98
bullB = 255
bullA = 179
bearR = 255          // Bear colour (bars with close <= open)
bearG = 152
bearB = 0
bearA = 179
zoneR = 49           // Zero-volume zone colour
zoneG = 27
zoneB = 146
zoneA = 127
//--------------------------------------------------------------------//
// Delta summary
//--------------------------------------------------------------------//
sumSections = 20     // Number of stacked sections in the delta panel
sumPanelW = 40       // Width in bars of the delta panel
sumGapX = 4          // Gap in bars between the profile and the delta panel
showDeltaText = 1    // 1 = show the delta percentage in each section
deltaMinFrac = 0.2   // Minimum size of a non-zero delta bar, as a fraction of the panel width
//--------------------------------------------------------------------//
// Delta styling
//--------------------------------------------------------------------//
posR = 0             // Delta buy colour (buy volume > sell volume)
posG = 230
posB = 118
posA = 204
negR = 242           // Delta sell colour (sell volume > buy volume)
negG = 54
negB = 69
negA = 204
neuR = 120           // Panel background / neutral colour
neuG = 123
neuB = 134
neuA = 26
txtR = 0             // Delta text colour (dark, for the light chart background)
txtG = 0
txtB = 0
//--------------------------------------------------------------------//
// Source
//--------------------------------------------------------------------//
IF srcMode = 1 THEN
   srcV = customclose
ELSE
   srcV = (high + low + close) / 3
ENDIF
hiR = highest[prd](high)
loR = lowest[prd](low)
//--------------------------------------------------------------------//
// Everything is rebuilt on the last bar
//--------------------------------------------------------------------//
IF islastbarupdate AND barindex >= prd THEN
   IF hiR > loR THEN
      bIdx = barindex
      stepR = (hiR - loR) / nRows
      // ---- price levels: the step is ADDED level after level. The rounding of
      // that sum sometimes leaves the last edge just above the highest price,
      // and then the profile has one row less (nBins = nRows - 1).
      nLv = 0
      lvX = loR
      WHILE hiR >= lvX AND nRows + 1 >= nLv DO
         $lvl[nLv] = lvX
         nLv = nLv + 1
         lvX = lvX + stepR
      WEND
      nBins = nLv - 1
      FOR k = 0 TO nBins - 1 DO
         $bullV[k] = 0
         $bearV[k] = 0
      NEXT
      // ---- volume assignment: bins are (lower edge, upper edge] ----
      FOR i = 0 TO prd DO
         pxV = srcV[i]
         IF pxV > loR AND $lvl[nBins] >= pxV THEN
            jb = ceil((pxV - loR) / stepR) - 1
            IF 0 > jb THEN
               jb = 0
            ENDIF
            IF jb > nBins - 1 THEN
               jb = nBins - 1
            ENDIF
            // fix floating point rounding on the bin edges
            IF $lvl[jb] >= pxV AND jb > 0 THEN
               jb = jb - 1
            ENDIF
            IF pxV > $lvl[jb + 1] AND nBins - 1 > jb THEN
               jb = jb + 1
            ENDIF
            IF pxV > $lvl[jb] AND $lvl[jb + 1] >= pxV THEN
               IF close[i] > open[i] THEN
                  $bullV[jb] = $bullV[jb] + volume[i]
               ELSE
                  $bearV[jb] = $bearV[jb] + volume[i]
               ENDIF
            ENDIF
         ENDIF
      NEXT
      // ---- largest row ----
      maxVol = 0
      FOR k = 0 TO nBins - 1 DO
         volK = $bullV[k] + $bearV[k]
         IF volK > maxVol THEN
            maxVol = volK
         ENDIF
      NEXT
      // ---- range box ----
      DRAWRECTANGLE(bIdx - prd, hiR, bIdx + profW, loR) COLOURED(0, 0, 0, 127) STYLE(dottedline, 2)
      // ---- profile rows (right-aligned on bIdx + profW) ----
      FOR k = 0 TO nBins - 1 DO
         bullK = $bullV[k]
         bearK = $bearV[k]
         volK = bullK + bearK
         normV = 0
         IF maxVol > 0 THEN
            normV = round(volK / maxVol * profW)
         ENDIF
         IF normV > 0 THEN
            normBull = 0
            IF bullK > 0 THEN
               normBull = round(bullK / volK * normV)
            ENDIF
            normBear = normV - normBull
            leftStart = bIdx + profW - normV
            IF normBull > 0 THEN
               DRAWRECTANGLE(leftStart, $lvl[k + 1], leftStart + normBull, $lvl[k]) COLOURED(0, 0, 0, 26) FILLCOLOR(bullR, bullG, bullB, bullA)
            ENDIF
            IF normBear > 0 THEN
               DRAWRECTANGLE(leftStart + normBull, $lvl[k + 1], bIdx + profW, $lvl[k]) COLOURED(0, 0, 0, 26) FILLCOLOR(bearR, bearG, bearB, bearA)
            ENDIF
         ENDIF
      NEXT
      // ---- zero-volume zones: consecutive empty rows merged into one zone ----
      nZ = 0
      inZone = 0
      FOR k = 0 TO nBins - 1 DO
         IF $bullV[k] + $bearV[k] = 0 THEN
            IF inZone = 0 THEN
               nZ = nZ + 1
               $zBot[nZ] = $lvl[k]
               inZone = 1
            ENDIF
            $zTop[nZ] = $lvl[k + 1]
         ELSE
            inZone = 0
         ENDIF
      NEXT
      // ---- each zone starts at the oldest bar of the window that touches it ----
      IF nZ > 0 THEN
         FOR z = 1 TO nZ DO
            zTopV = $zTop[z]
            zBotV = $zBot[z]
            leftIdx = bIdx - prd
            FOR off = prd DOWNTO 0 DO
               IF zTopV + 0.0000000001 >= low[off] AND high[off] >= zBotV - 0.0000000001 THEN
                  leftIdx = bIdx - off
                  BREAK
               ENDIF
            NEXT
            DRAWRECTANGLE(leftIdx, zTopV, bIdx, zBotV) COLOURED(zoneR, zoneG, zoneB, 0) FILLCOLOR(zoneR, zoneG, zoneB, zoneA)
         NEXT
      ENDIF
      // ---- delta summary panel ----
      IF sumSections > 0 THEN
         secRows = max(1, floor(nBins / sumSections))
         baseLeft = bIdx + profW + sumGapX
         baseRight = baseLeft + sumPanelW
         FOR s = 0 TO sumSections - 1 DO
            startIdx = s * secRows
            IF s = sumSections - 1 THEN
               endIdx = nBins - 1
            ELSE
               endIdx = min(nBins - 1, (s + 1) * secRows - 1)
            ENDIF
            IF endIdx >= startIdx THEN
               segBull = 0
               segBear = 0
               FOR k = startIdx TO endIdx DO
                  segBull = segBull + $bullV[k]
                  segBear = segBear + $bearV[k]
               NEXT
               segTot = segBull + segBear
               IF segTot > 0 THEN
                  segTop = $lvl[endIdx + 1]
                  segBottom = $lvl[startIdx]
                  DRAWRECTANGLE(baseLeft, segTop, baseRight, segBottom) COLOURED(0, 0, 0, 77) FILLCOLOR(neuR, neuG, neuB, neuA)
                  deltaPct = (segBull - segBear) / segTot * 100
                  barLen = 0
                  IF deltaPct <> 0 THEN
                     barLen = sumPanelW * max(deltaMinFrac, min(1, abs(deltaPct) / 100))
                  ENDIF
                  dRight = baseLeft + barLen
                  IF deltaPct = 0 THEN
                     dRight = baseLeft + 1
                  ENDIF
                  IF deltaPct > 0 THEN
                     DRAWRECTANGLE(baseLeft, segTop, round(dRight), segBottom) COLOURED(0, 0, 0, 204) FILLCOLOR(posR, posG, posB, posA)
                  ELSIF 0 > deltaPct THEN
                     DRAWRECTANGLE(baseLeft, segTop, round(dRight), segBottom) COLOURED(0, 0, 0, 204) FILLCOLOR(negR, negG, negB, negA)
                  ELSE
                     DRAWRECTANGLE(baseLeft, segTop, round(dRight), segBottom) COLOURED(0, 0, 0, 204) FILLCOLOR(neuR, neuG, neuB, neuA)
                  ENDIF
                  IF showDeltaText = 1 THEN
                     dTxt = round(deltaPct * 10) / 10
                     DRAWTEXT("Δ #dTxt#%", round((baseLeft + baseRight) / 2), (segTop + segBottom) / 2) COLOURED(txtR, txtG, txtB, 255)
                  ENDIF
               ENDIF
            ENDIF
         NEXT
      ENDIF
   ENDIF
ENDIF
RETURN