Volume Spread Analysis IQ
Introduction
Volume Spread Analysis (VSA), the framework popularised by Tom Williams out of Richard Wyckoff’s work, rests on one deceptively simple question: is the effort matching the result?
Effort is the volume traded on a bar. Result is how far price actually travelled, the spread of the bar. When a lot of effort produces little result, someone is absorbing the move. When little effort produces a large result, the path of least resistance is wide open. Everything else in VSA is vocabulary built on top of that comparison.
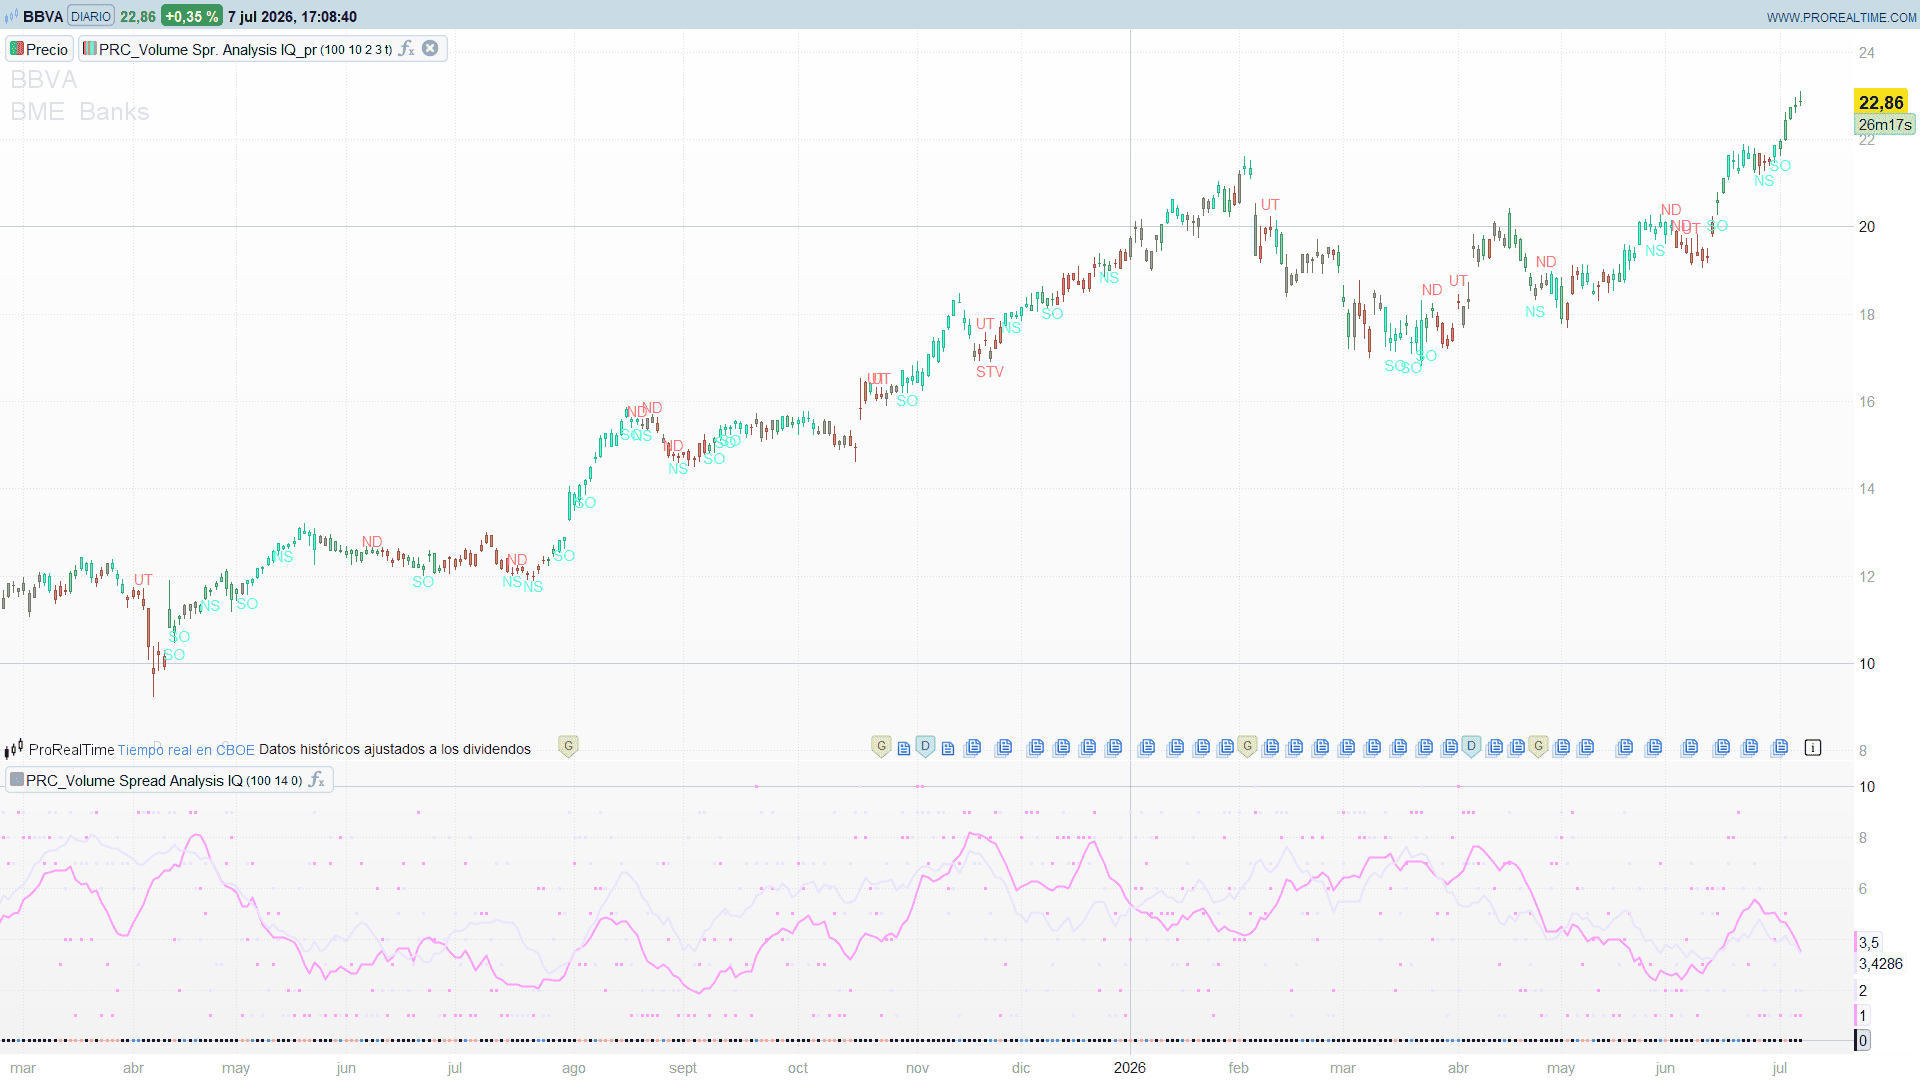
This is a ProBuilder port of TradingIQ’s “Volume Spread Analysis IQ”. The original is a single TradingView indicator that draws both in a sub-panel and, via force_overlay, on the price chart. ProRealTime has no force_overlay, so the port is delivered as two indicators that work together:
- Effort vs Result (a lower panel): the quantitative core, ranking volume and spread as percentiles and comparing them.
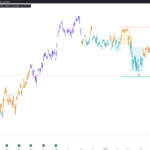
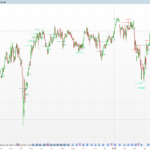
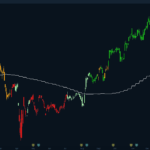
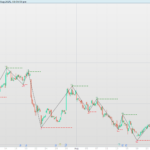
- VSA Signals (on the price chart): the named Wyckoff patterns plus candles recoloured by an underlying strength score.
Both share the same classification engine. You can run either on its own, or both at once for the full picture.
Theory Behind the Indicator
Effort and Result as percentiles
A raw volume number is meaningless on its own: ten thousand contracts is huge on one instrument and trivial on another. The fix is to rank it. For every bar the indicator looks back over a rolling window of 100 bars and asks what fraction of those bars had a volume less than or equal to this one:
volRank = (count of last 100 bars with volume <= current volume) / 100 * 100
That gives a percentile from 0 to 100. The same operation is applied to the spread (the bar range, high - low) to get spreadRank. Effort is the volume percentile, Result is the spread percentile.
From percentile to decile
Each percentile is bucketed into a decile from 1 to 10: above 90 becomes 9, above 80 becomes 8, and the very top (the current bar is the heaviest or widest in the window) maps to 10. Effort and Result now share a small integer scale and can be compared at a glance. Effort 10 is climactic volume, 1 is near-dead activity; Result 10 is an ultra-wide bar, 1 an ultra-narrow one.
The comparison is the signal
Once both are on the same scale, the gap carries the VSA message:
- High Effort, low Result: heavy volume that failed to move price. This is absorption or compression, the footprint of a stronger hand. It often precedes a turn.
- Low Effort, high Result: a wide bar on light volume, an easy move in the direction of the bar because nothing stood in the way.
- Effort and Result roughly equal: an efficient, unremarkable bar.
The panel marks this explicitly: when the two deciles differ by 3 or more it drops a coloured dot on the zero line, and two moving averages (one over Effort, one over Result) show the regime rather than the bar-to-bar flicker.
The background score, reduced exactly
The signals piece adds one more layer: a running strength-versus-weakness score. The original builds it from a long chain of string-labelled states, but that score only ever receives points from six of those states, and those six collapse cleanly into four bar types (strong or moderate up, strong or moderate down) crossed with the effort level:
bull points:  high effort + strong up = 3, normal + (strong or moderate up) = 2, low effort + strong up = 1
bear points:  high effort + strong dn = 3, normal + (strong or moderate dn) = 2, low effort + strong dn = 1
Everything else scores zero. Summing these over a lookback window, with a small trend bonus, gives a netScore that drives the candle colour (red for net weakness, teal for net strength) and gates two of the patterns. This reduction is exact, not an approximation, which is what makes the port faithful without dragging the string machinery into ProBuilder.
The five patterns
- No Demand (ND): an up bar on low effort and a narrow spread closing in the middle, then a lower close. Price rose but nobody was buying.
- No Supply (NS): the mirror image, confirmed by a higher close. Price fell but nobody was selling.
- Upthrust (UT): an upper-rejection bar with a wide-enough spread in a weak background, followed by a down bar. A push that gets rejected and sold.
- Shakeout (SO): a lower-rejection bar in a strong background, followed by an up bar. The classic spring.
- Stopping Volume (STV): a high-effort down bar with a contained spread, shortly after a statistically large decline. The falling market is absorbing supply.
How to Read the Indicator
- Panel first, chart second. Read the Effort vs Result panel for the quantitative story (is effort matching result?), then look to the on-chart marks for the named setup.
- Mind the gap in the panel. High Effort over low Result warns of absorption; high Result on low Effort is a cheap, easy move. The zero-line dots flag these divergences for you.
- Candle colour is context, not a trigger. Teal leans bullish, red leans bearish. Read each pattern mark against that backdrop.
- ND and UT are warnings under strength; NS, SO and STV are accumulation cues under weakness. They matter most at structure, near support or resistance, not in the middle of a range.
- Every mark is confirmed by the next bar, so a fresh signal only appears once its confirming bar has printed. It will not repaint away after the bar closes.
- It is descriptive, not predictive. The percentiles are relative to the last 100 bars; they describe how this bar compares to its recent context.
Practical Applications
- Absorption before a turn. A cluster of high-Effort, low-Result bars into a high or low, or a Stopping Volume mark after a fast drop, flags where a stronger hand is active.
- Confirming breakouts. A breakout bar showing high Effort and high Result is doing real work; high Result on low Effort is a thin move to treat with caution.
- Reversal timing at levels. A No Supply or Shakeout arriving at support is a VSA-grounded reason to look for a long instead of buying a level blindly.
- Trend exhaustion. Repeated No Demand or an Upthrust after a strong run hints the buying is thinning.
- Regime and bias filter. The relationship between the two panel moving averages, and the on-chart candle colour, are compact reads of whether the market is absorbing or travelling, useful for gating a separate entry method.
Indicator Configuration
Shared by both parts:
lookback= 100: the rolling window for the volume and spread percentile ranks.
Effort vs Result panel:
maLength= 14: length of the Effort and Result moving averages.maType= 0: 0 = SMA, 1 = EMA, 2 = WMA, 3 = Wilder (RMA). The original defaults to SMA.
VSA Signals:
bgLookback= 10: how many bars the background score sums over. Larger is steadier.bgThresh= 2.0: how strong the net score must be before the background counts as strong or weak (this gates Upthrust and Shakeout).pivLen= 3: pivot strength of the internal trend proxy that replaces the original’s library ZigZag.colorCandles= 1: set to 0 to keep native candle colours and show only the pattern marks.
Code
Part 1 — Effort vs Result (add in a new panel)
//--------------------------------------------
// PRC_Volume Spread Analysis IQ - Effort vs Result (by TradingIQ)
// version = 0
// 07.07.2026
// Iván González @ www.prorealcode.com
// Sharing ProRealTime knowledge
//--------------------------------------------
// --- Inputs ---
lookback = 100   // Percentile window (bars)
maLength = 14    // MA length for Effort / Result
maType   = 0     // 0=SMA, 1=EMA, 2=WMA, ...
//--------------------------------------------
// --- Effort (volume) and Result (spread) percentile rank over lookback ---
myLb = min(lookback - 1, barindex)
denom = myLb + 1
barSpread = high - low
volCount = 0
sprCount = 0
FOR i = 0 TO myLb DO
   IF volume[i] <= volume THEN
      volCount = volCount + 1
   ENDIF
   IF (high[i] - low[i]) <= barSpread THEN
      sprCount = sprCount + 1
   ENDIF
NEXT
volRank = volCount * 100 / denom
spreadRank = sprCount * 100 / denom
//--------------------------------------------
// --- Map percentile 0..100 to 1..10 deciles ---
IF volRank >= 100 THEN
   effortRankEasy = 10
ELSIF volRank > 90 THEN
   effortRankEasy = 9
ELSIF volRank > 80 THEN
   effortRankEasy = 8
ELSIF volRank > 70 THEN
   effortRankEasy = 7
ELSIF volRank > 60 THEN
   effortRankEasy = 6
ELSIF volRank > 50 THEN
   effortRankEasy = 5
ELSIF volRank > 40 THEN
   effortRankEasy = 4
ELSIF volRank > 30 THEN
   effortRankEasy = 3
ELSIF volRank > 20 THEN
   effortRankEasy = 2
ELSE
   effortRankEasy = 1
ENDIF


IF spreadRank >= 100 THEN
   spreadRankEasy = 10
ELSIF spreadRank > 90 THEN
   spreadRankEasy = 9
ELSIF spreadRank > 80 THEN
   spreadRankEasy = 8
ELSIF spreadRank > 70 THEN
   spreadRankEasy = 7
ELSIF spreadRank > 60 THEN
   spreadRankEasy = 6
ELSIF spreadRank > 50 THEN
   spreadRankEasy = 5
ELSIF spreadRank > 40 THEN
   spreadRankEasy = 4
ELSIF spreadRank > 30 THEN
   spreadRankEasy = 3
ELSIF spreadRank > 20 THEN
   spreadRankEasy = 2
ELSE
   spreadRankEasy = 1
ENDIF
//--------------------------------------------
// --- Moving averages of Effort and Result ---
effortMA = average[maLength, maType](effortRankEasy)
resultMA = average[maLength, maType](spreadRankEasy)
//--------------------------------------------
// --- Effort vs Result divergence (gap >= 3 deciles) ---
gap = abs(spreadRankEasy - effortRankEasy)
IF gap >= 3 THEN
   divMark = 0
   IF spreadRankEasy > effortRankEasy THEN
      dR = 250
      dG = 161
      dB = 164
   ELSE
      dR = 91
      dG = 156
      dB = 246
   ENDIF
ELSE
   divMark = undefined
   dR = 0
   dG = 0
   dB = 0
ENDIF
//--------------------------------------------
RETURN effortRankEasy AS "Effort" coloured(255, 158, 249) style(point), spreadRankEasy AS "Result" coloured(233, 226, 255) style(point), effortMA AS "Effort MA" coloured(255, 158, 249) style(line), resultMA AS "Result MA" coloured(233, 226, 255) style(line), divMark AS "Divergence" coloured(dR, dG, dB) style(point)
Part 2 — VSA Signals (add on the price chart)
//--------------------------------------------
// PRC_Volume Spread Analysis IQ - Signals (by TradingIQ)
// version = 0
// 07.07.2026
// Iván González @ www.prorealcode.com
// Sharing ProRealTime knowledge
//--------------------------------------------
// --- Inputs ---
lookback     = 100    // percentile window (bars)
bgLookback   = 10     // VSA background window (Medium)
bgThresh     = 2.0    // background strong/weak threshold
pivLen       = 3      // trend zigzag pivot strength
colorCandles = 1      // 1 = recolor candles by background bias
// --- Percentile thresholds (Standard sense) ---
highVolMin      = 70
lowVolMax       = 30
spreadWideMin   = 70
spreadNormalMin = 30
closeThresh     = 0.60
rejWickThresh   = 0.45
rejBodyMax      = 0.45
//--------------------------------------------
// --- Percentile ranks: volume = effort, spread = result ---
myLb = min(lookback - 1, barindex)
denom = myLb + 1
barSpread = high - low
IF barSpread = 0 THEN
   barSpread = 0.0000001
ENDIF
volCount = 0
sprCount = 0
FOR i = 0 TO myLb DO
   IF volume[i] <= volume THEN
      volCount = volCount + 1
   ENDIF
   IF (high[i] - low[i]) <= barSpread THEN
      sprCount = sprCount + 1
   ENDIF
NEXT
volRank = volCount * 100 / denom
spreadRank = sprCount * 100 / denom
//--------------------------------------------
// --- Effort class: high / normal / low ---
effortHigh = volRank >= highVolMin
effortLow = volRank < lowVolMax
effortNormal = effortHigh = 0 AND effortLow = 0
//--------------------------------------------
// --- Spread class flags ---
spreadWideOrUltra = spreadRank >= spreadWideMin
spreadNormalExact = spreadRank >= spreadNormalMin AND spreadRank < spreadWideMin
narrowSpread = spreadRank < spreadNormalMin
spreadOk = spreadRank >= spreadNormalMin
//--------------------------------------------
// --- Close position: high / mid / low ---
R = ((close - low) - (high - close)) / barSpread
closeHigh = R >= closeThresh
closeLow = R <= (0 - closeThresh)
closeMid = closeHigh = 0 AND closeLow = 0
//--------------------------------------------
// --- Bar direction ---
upBar = close > close[1]
downBar = close < close[1]
//--------------------------------------------
// --- Rejection shapes (for upthrust / shakeout) ---
bodyv = abs(close - open)
upWick = high - max(open, close)
loWick = min(open, close) - low
bodyRatio = bodyv / barSpread
upWickRatio = upWick / barSpread
loWickRatio = loWick / barSpread
upRej = upWickRatio >= rejWickThresh AND upWickRatio > loWickRatio AND bodyRatio <= rejBodyMax
lowRej = loWickRatio >= rejWickThresh AND loWickRatio > upWickRatio AND bodyRatio <= rejBodyMax
//--------------------------------------------
// --- Trend proxy: pivot zigzag direction (replaces IQ.IQZZsimple) ---
pivRange = 2 * pivLen + 1
isPH = 0
isPL = 0
IF barindex >= pivRange THEN
   IF high[pivLen] = highest[pivRange](high) THEN
      isPH = 1
   ENDIF
   IF low[pivLen] = lowest[pivRange](low) THEN
      isPL = 1
   ENDIF
ENDIF
once direction = 0
IF isPL THEN
   direction = 1
ENDIF
IF isPH THEN
   direction = -1
ENDIF
//--------------------------------------------
// --- Result sub-cases feeding the background score (exact reduction) ---
strongUp = upBar AND closeHigh AND spreadWideOrUltra
modUp = upBar AND closeHigh AND spreadNormalExact
strongDn = downBar AND closeLow AND spreadWideOrUltra
modDn = downBar AND closeLow AND spreadNormalExact
//--------------------------------------------
// --- Bull / bear score per bar ---
bullScore = 0
IF effortHigh AND strongUp THEN
   bullScore = 3
ELSIF effortLow AND strongUp THEN
   bullScore = 1
ELSIF effortNormal AND (strongUp OR modUp) THEN
   bullScore = 2
ENDIF
bearScore = 0
IF effortHigh AND strongDn THEN
   bearScore = 3
ELSIF effortLow AND strongDn THEN
   bearScore = 1
ELSIF effortNormal AND (strongDn OR modDn) THEN
   bearScore = 2
ENDIF
//--------------------------------------------
// --- Background net score over bgLookback + trend rule ---
strengthScore = summation[bgLookback](bullScore)
weaknessScore = summation[bgLookback](bearScore)
IF direction = 1 THEN
   strengthScore = strengthScore + 5
ELSE
   weaknessScore = weaknessScore + 5
ENDIF
netScore = strengthScore - weaknessScore
strongBg = netScore > bgThresh
weakBg = netScore < (0 - bgThresh)
//--------------------------------------------
// --- Stopping volume climax timer ---
logret = log(close / close[3])
meanlr = average[20](logret)
stdlr = std[20](logret)
IF stdlr = 0 THEN
   stdlr = 0.0000001
ENDIF
zmove = (logret - meanlr) / stdlr
once svBar = -1000
IF zmove <= -2 THEN
   svBar = barindex
ENDIF
stopVolActive = barindex - svBar <= 5
//--------------------------------------------
// --- VSA pattern signals ---
volLessP2 = volume < volume[1] AND volume < volume[2]
lowVolVsa = effortLow OR volLessP2
noDemand = upBar AND (lowVolVsa OR volLessP2) AND narrowSpread AND closeMid
noSupply = downBar AND (lowVolVsa OR volLessP2) AND narrowSpread AND closeMid
noDemandConfirmed = noDemand[1] AND close < close[1]
noSupplyConfirmed = noSupply[1] AND close > close[1]
upthrust = upRej AND closeMid AND spreadOk AND weakBg
shakeout = lowRej AND (closeMid OR closeHigh) AND spreadOk AND strongBg
upthrustSig = upthrust[1] AND downBar AND close < close[1]
shakeoutSig = shakeout[1] AND upBar AND close > close[1]
stoppingVolume = downBar AND effortHigh AND (narrowSpread OR spreadNormalExact) AND closeMid AND stopVolActive
//--------------------------------------------
// --- Drawing (overlay) ---
atr14 = averagetruerange[14](close)
off = atr14 * 0.5
// Recolor candles by background bias (red -> teal gradient on netScore)
IF colorCandles = 1 THEN
   tcol = (netScore + 10) / 20
   IF tcol > 1 THEN
      tcol = 1
   ENDIF
   IF tcol < 0 THEN
      tcol = 0
   ENDIF
   cr = round(255 + tcol * (85 - 255))
   cg = round(116 + tcol * (255 - 116))
   cb = round(116 + tcol * (218 - 116))
   drawcandle(open, high, low, close) coloured(cr, cg, cb)
ENDIF
// Signal markers (one per event, on the signalling bar)
IF noDemandConfirmed THEN
   drawtext("ND", barindex - 1, high[1] + off) coloured(255, 116, 116)
ENDIF
IF noSupplyConfirmed THEN
   drawtext("NS", barindex - 1, low[1] - off) coloured(85, 255, 218)
ENDIF
IF upthrustSig THEN
   drawtext("UT", barindex - 1, high[1] + off) coloured(255, 116, 116)
ENDIF
IF shakeoutSig THEN
   drawtext("SO", barindex - 1, low[1] - off) coloured(85, 255, 218)
ENDIF
IF stoppingVolume THEN
   IF strongBg THEN
      stvR = 85
      stvG = 255
      stvB = 218
   ELSE
      stvR = 255
      stvG = 116
      stvB = 116
   ENDIF
   drawtext("STV", barindex, low - off) coloured(stvR, stvG, stvB)
ENDIF
//--------------------------------------------
RETURN