Wyckoff Schematic: automatic accumulation and distribution phase
Introduction
Richard Wyckoff described how large operators build and unload positions inside trading ranges. A range of accumulation starts with a climax of selling, tests the lows, shakes out the weak hands with a spring and ends with a sign of strength that launches the markup. Distribution is the mirror image at the top. Reading these schematics by eye takes practice, and two analysts rarely label the same chart the same way.
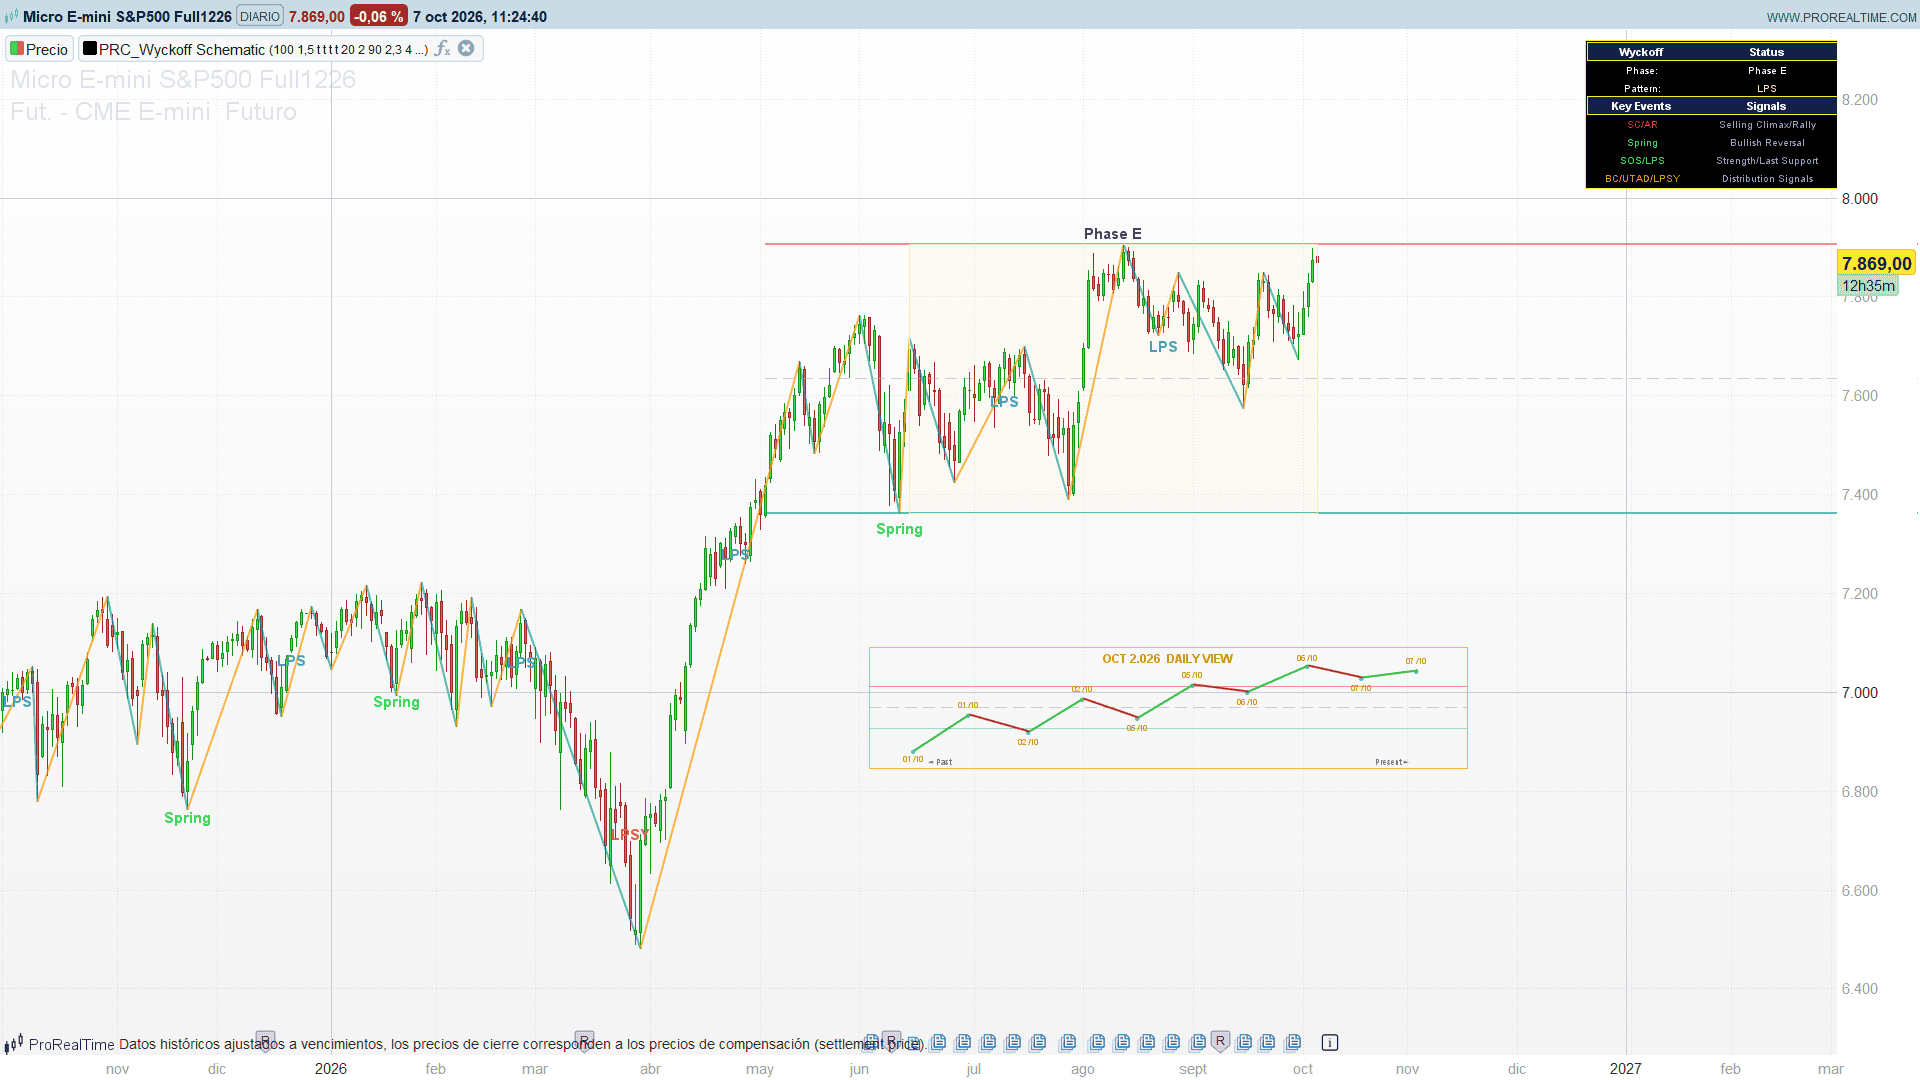
Wyckoff Schematic turns that reading into explicit rules based on volume and range. It flags the key Wyckoff events on the chart, tracks the current phase of the schematic, and adds the structure that helps you judge it: a zigzag of swing highs and lows, the support, resistance and middle of the lookback range, a compact view of the daily swings of the current month and a status table.
Theory Behind the Indicator
Volume and range filters
Everything is measured against the recent past:
- High volume: volume above its average over the lookback times the spike multiplier (1.5 by default). Climax volume uses the multiplier plus 0.5.
- Narrow range: a bar whose high-low range is below 60% of its 20-bar average.
- Lookback range: the highest high and lowest low of the lookback period, and its middle point.
Accumulation events
- PS (Preliminary Support): a bullish bar on high volume that makes the lowest low of 50 bars.
- SC (Selling Climax): a bearish bar on climax volume at the 30-bar low, closing below the previous close.
- AR (Automatic Rally): a bullish bar on above-average volume, right after a 30-bar low, closing more than 1% above the previous close.
- ST (Secondary Test): a bullish bar on below-average volume whose low comes back within 0.5% of the last selling climax low.
- Spring: a bullish bar on above-average volume that breaks the 20-bar low and closes more than 1% above its own low.
- Test: a narrow-range bar on low volume whose low is within 2% of the lookback range from the selling climax low.
- SOS (Sign of Strength): a rising close on volume 30% above average, a body larger than the average range and a close above the middle of the range.
- LPS (Last Point of Support): a bullish bar on below-average volume that holds above the last spring or secondary test low, closing above the middle of the range.
Distribution events
- PSY (Preliminary Supply), BC (Buying Climax), AR (Automatic Reaction) and ST mirror their accumulation counterparts at the highs.
- UTAD (Upthrust After Distribution): a bearish bar on above-average volume that breaks the 20-bar high and closes more than 1% below its own high.
- LPSY (Last Point of Supply): a bearish bar on below-average volume that stays below the last UTAD or secondary test high, closing below the middle of the range.
The phase machine
The phases follow the classic sequence. In accumulation: a PS or SC opens Phase A, an AR moves it to Phase B, a Test to Phase C (a Spring in Phase C is reported as the current pattern), an SOS from Phase B or C to Phase D, and an LPS to Phase E, the markup. In distribution: PSY or BC opens Phase A (Dist), then the automatic reaction, the UTAD and the LPSY lead to Phases B, C and D. A new climax always restarts the schematic.
Key Features at a Glance
- Labels for the eight key events: SC, AR, Spring, SOS, LPS, BC, UTAD and LPSY, with a minimum distance between labels so the chart stays readable.
- Phase box from the start of the current phase to the last bar, spanning the lookback range, with the phase name on top.
- Zigzag of swing highs and lows, teal for rising legs and orange for falling legs.
- Support, resistance and middle of the lookback range, extended to the right.
- Daily wave view: a panel under the price with the low-high zigzag of the last days of the current month, dated swing points and past/present markers.
- Status table in the top right corner with the current phase, the current pattern and a legend of the events.
How to Read the Indicator
- The table first. It tells you where the market stands in the schematic. “Phase C / Spring” in accumulation is the classic moment of interest; “Phase D / SOS” means the range is resolving upwards. In distribution, “Phase C (Dist) / UTAD” and “Phase D (Dist) / LPSY” are the bearish counterparts.
- Event labels. Labels below the bars (SC, Spring, LPS) mark tests of support; labels above (AR, SOS, BC, UTAD, LPSY) mark tests of resistance or strength. A spring followed by an SOS and an LPS is the textbook bullish sequence.
- Support and resistance. The green line is the low of the lookback range, the red line its high and the dotted grey line its middle. Several events use the middle line to tell strength from weakness.
- Zigzag. It shows the swing structure the events sit on: higher lows after a spring, lower highs after an upthrust.
- Wave view. A quick look at how the current month has traded day by day, without changing timeframe.
Practical Applications
- Scanning ranges for a spring. Look for Phase C with a Spring label near the support line, then wait for the SOS to confirm before acting.
- Spotting distribution early. A buying climax followed by a UTAD near the resistance line warns that a range at the highs may be distribution rather than a pause.
- Context for other signals. Use the phase as a filter: favour long setups in Phases D and E of accumulation and short setups in Phases C and D of distribution.
Indicator Configuration
All parameters sit at the top of the code:
- lookback (default: 100): period for the volume average and the support/resistance range (20 to 300).
- volMultiplier (default: 1.5): volume spike multiplier; climax volume uses this value plus 0.5.
- showLabels (default: 1): event labels on/off.
- showPhases (default: 1): phase box and phase name on/off.
- showLines (default: 1): support, resistance and mid-range lines on/off.
- showZigzag (default: 1): zigzag on/off.
- minBarsBetweenLabels (default: 20): minimum bars between two labels (AR, LPS and LPSY use 1.5 times this value for their own repeats).
- labelSize (default: 1): 0 small, 1 normal, 2 large.
- phaseTransparency (default: 90): transparency of the phase box, 80 to 98.
- labelOffsetPct (default: 2.0): distance of the labels from the bars, as a percentage of the lookback range.
- zigzagLength (default: 4): bars on each side to confirm a zigzag high or low.
- showMonthlyWave (default: 1): daily wave view on/off.
- monthlySwingLegs (default: 10): number of swing points in the wave view (3 to 20).
- showSwingPoints (default: 1): dates and trend lines in the wave view.
- showTable (default: 1): status table on/off.
The wave view uses the daily highs and lows rebuilt from the bars of your chart, so it is meant for intraday and daily charts (on weekly and higher charts each bar counts as one “day”).
Code
//---------------------------------------------------------------
// PRC_Wyckoff Schematic
// version = 0
// 07.10.2026
// Iván González @ www.prorealcode.com
// Author: kingshukghosh71 (Kingshuk Ghosh)
// Sharing ProRealTime knowledge
//--------------------------------------------------------------------//
defparam drawonlastbaronly = true
//---------------------------------------------------------------
// SETTINGS
//---------------------------------------------------------------
// Wyckoff detection
lookback = 100 // lookback period (20 to 300)
volMultiplier = 1.5 // volume spike multiplier
// Display
showLabels = 1 // event labels
showPhases = 1 // phase box
showLines = 1 // support / resistance / mid-range lines
showZigzag = 1 // zigzag line
minBarsBetweenLabels = 20 // minimum distance between event labels
labelSize = 1 // 0 = Small, 1 = Normal, 2 = Large
phaseTransparency = 90 // phase box transparency (80 to 98)
labelOffsetPct = 2.0 // label offset, % of the lookback range
// Zigzag
zigzagLength = 4 // zigzag high/low length
// Wave view (daily swings of the current month, drawn under the price)
showMonthlyWave = 1
monthlySwingLegs = 10 // number of swing points (3 to 20)
showSwingPoints = 1 // date stamps and trend lines in the wave view
// Status table
showTable = 1
//---------------------------------------------------------------
// COLOURS
//---------------------------------------------------------------
phA = round((100 - phaseTransparency) * 2.55)
//---------------------------------------------------------------
// VOLUME AND PRICE ANALYSIS
//---------------------------------------------------------------
priceRange = high - low
okLook = barindex >= lookback - 1
IF okLook THEN
avgVolume = average[lookback](volume)
highestHigh = highest[lookback](high)
lowestLow = lowest[lookback](low)
ELSE
avgVolume = 0
highestHigh = high
lowestLow = low
ENDIF
highVolume = okLook AND volume > avgVolume * volMultiplier
climaxVolume = okLook AND volume > avgVolume * (volMultiplier + 0.5)
volAbove = okLook AND volume > avgVolume
volBelow = okLook AND avgVolume > volume
rangeSize = highestHigh - lowestLow
midRange = (highestHigh + lowestLow) / 2
ok20 = barindex >= 19
IF ok20 THEN
avgRange = average[20](priceRange)
ELSE
avgRange = 0
ENDIF
narrowRange = ok20 AND avgRange * 0.6 > priceRange
//---------------------------------------------------------------
// ZIGZAG HIGH LOW DETECTION
//---------------------------------------------------------------
// The leg being extended is kept in scalars (liX1..liUp); a leg is only
// stored in the arrays once a new one starts, so recalculating the live
// bar tick after tick never leaves a stale leg behind.
zzLen = zigzagLength
once dirUp = 0
once zLastLow = high * 100
once zLastHigh = 0
once timeLow = 0
once timeHigh = 0
once liOn = 0
once nZ = 0
isMin = 0
isMax = 0
IF barindex >= 2 * zzLen THEN
zh = highest[2 * zzLen + 1](high)
zl = lowest[2 * zzLen + 1](low)
IF zl = low[zzLen] THEN
isMin = 1
ENDIF
IF zh = high[zzLen] THEN
isMax = 1
ENDIF
ENDIF
IF showZigzag THEN
IF dirUp = 1 THEN
IF isMin = 1 AND zLastLow > low[zzLen] THEN
zLastLow = low[zzLen]
timeLow = barindex
// the current leg is redrawn
liX1 = timeHigh - zzLen
liY1 = zLastHigh
liX2 = timeLow - zzLen
liY2 = zLastLow
liUp = dirUp
liOn = 1
ENDIF
IF isMax = 1 AND high[zzLen] > zLastLow THEN
zLastHigh = high[zzLen]
timeHigh = barindex
dirUp = 0
// new leg: the current one is stored
IF liOn = 1 THEN
nZ = nZ + 1
$zX1[nZ] = liX1
$zY1[nZ] = liY1
$zX2[nZ] = liX2
$zY2[nZ] = liY2
$zUp[nZ] = liUp
ENDIF
liX1 = timeHigh - zzLen
liY1 = zLastHigh
liX2 = timeLow - zzLen
liY2 = zLastLow
liUp = dirUp
liOn = 1
ENDIF
ENDIF
IF dirUp = 0 THEN
IF isMax = 1 AND high[zzLen] > zLastHigh THEN
zLastHigh = high[zzLen]
timeHigh = barindex
liX1 = timeHigh - zzLen
liY1 = zLastHigh
liX2 = timeLow - zzLen
liY2 = zLastLow
liUp = dirUp
liOn = 1
ENDIF
IF isMin = 1 AND zLastHigh > low[zzLen] THEN
zLastLow = low[zzLen]
timeLow = barindex
dirUp = 1
IF liOn = 1 THEN
nZ = nZ + 1
$zX1[nZ] = liX1
$zY1[nZ] = liY1
$zX2[nZ] = liX2
$zY2[nZ] = liY2
$zUp[nZ] = liUp
ENDIF
liX1 = timeHigh - zzLen
liY1 = zLastHigh
liX2 = timeLow - zzLen
liY2 = zLastLow
liUp = dirUp
liOn = 1
IF isMax = 1 AND high[zzLen] > zLastLow THEN
zLastHigh = high[zzLen]
timeHigh = barindex
dirUp = 0
nZ = nZ + 1
$zX1[nZ] = liX1
$zY1[nZ] = liY1
$zX2[nZ] = liX2
$zY2[nZ] = liY2
$zUp[nZ] = liUp
liX1 = timeHigh - zzLen
liY1 = zLastHigh
liX2 = timeLow - zzLen
liY2 = zLastLow
liUp = dirUp
liOn = 1
ENDIF
ENDIF
ENDIF
ENDIF
//---------------------------------------------------------------
// HORIZONTAL SUPPORT / RESISTANCE LINES
//---------------------------------------------------------------
// The lines are redrawn every time the lookback high or low changes,
// starting "lookback" bars before that bar and extended to the right.
once srSet = 0
IF okLook THEN
IF srSet = 0 OR curHH <> highestHigh OR curLL <> lowestLow THEN
curHH = highestHigh
curLL = lowestLow
curMid = (curHH + curLL) / 2
srBar = barindex
srSet = 1
ENDIF
ENDIF
//---------------------------------------------------------------
// WYCKOFF EVENT DETECTION
//---------------------------------------------------------------
bullBar = close > open
bearBar = open > close
ok1 = barindex >= 1
ok30 = barindex >= 29
ok31 = barindex >= 30
ok50 = barindex >= 49
// --- ACCUMULATION EVENTS ---
// Preliminary Support (PS)
psCond = 0
IF ok50 THEN
IF low = lowest[50](low) AND highVolume AND bullBar THEN
psCond = 1
ENDIF
ENDIF
// Selling Climax (SC)
scCond = 0
IF ok30 AND ok1 THEN
IF climaxVolume AND bearBar AND lowest[30](low) >= low AND close[1] > close THEN
scCond = 1
ENDIF
ENDIF
// Automatic Rally (AR)
arCond = 0
IF ok31 THEN
IF bullBar AND volAbove AND low[1] = lowest[30](low[1]) AND close > close[1] * 1.01 THEN
arCond = 1
ENDIF
ENDIF
// low of the last Selling Climax
once hasSc = 0
IF scCond = 1 THEN
scLow = low
hasSc = 1
ENDIF
// Secondary Test (ST)
stCond = 0
IF hasSc = 1 THEN
IF scLow * 1.005 > low AND low > scLow * 0.995 AND volBelow AND bullBar THEN
stCond = 1
ENDIF
ENDIF
// Spring
springCond = 0
IF barindex >= 20 THEN
IF lowest[20](low[1]) > low AND bullBar AND volAbove AND close > low * 1.01 THEN
springCond = 1
ENDIF
ENDIF
// Test
testCond = 0
IF hasSc = 1 AND okLook THEN
IF rangeSize * 0.02 > abs(low - scLow) AND avgVolume * 0.8 > volume AND narrowRange THEN
testCond = 1
ENDIF
ENDIF
// Sign of Strength (SOS)
sosCond = 0
IF okLook AND ok20 AND ok1 THEN
IF close > close[1] AND volume > avgVolume * 1.3 AND close - open > avgRange AND close > midRange THEN
sosCond = 1
ENDIF
ENDIF
// low of the last Spring or Secondary Test
once hasSs = 0
IF springCond = 1 OR stCond = 1 THEN
ssLow = low
hasSs = 1
ENDIF
// Last Point of Support (LPS)
lpsCond = 0
IF hasSs = 1 AND okLook THEN
IF low > ssLow AND bullBar AND volBelow AND close > midRange THEN
lpsCond = 1
ENDIF
ENDIF
// --- DISTRIBUTION EVENTS ---
// Preliminary Supply (PSY)
psyCond = 0
IF ok50 THEN
IF high = highest[50](high) AND highVolume AND bearBar THEN
psyCond = 1
ENDIF
ENDIF
// Buying Climax (BC)
bcCond = 0
IF ok30 THEN
IF climaxVolume AND bullBar AND high >= highest[30](high) THEN
bcCond = 1
ENDIF
ENDIF
// Automatic Reaction (AR in distribution)
arDistCond = 0
IF ok31 THEN
IF bearBar AND volAbove AND high[1] = highest[30](high[1]) AND close[1] * 0.99 > close THEN
arDistCond = 1
ENDIF
ENDIF
// high of the last Buying Climax
once hasBc = 0
IF bcCond = 1 THEN
bcHigh = high
hasBc = 1
ENDIF
// Secondary Test in distribution (ST)
stDistCond = 0
IF hasBc = 1 THEN
IF high > bcHigh * 0.995 AND bcHigh * 1.005 > high AND volBelow THEN
stDistCond = 1
ENDIF
ENDIF
// Upthrust After Distribution (UTAD)
utadCond = 0
IF barindex >= 20 THEN
IF high > highest[20](high[1]) AND bearBar AND volAbove AND high * 0.99 > close THEN
utadCond = 1
ENDIF
ENDIF
// high of the last UTAD or Secondary Test
once hasUt = 0
IF utadCond = 1 OR stDistCond = 1 THEN
utHigh = high
hasUt = 1
ENDIF
// Last Point of Supply (LPSY)
lpsyCond = 0
IF hasUt = 1 AND okLook THEN
IF utHigh > high AND bearBar AND volBelow AND midRange > close THEN
lpsyCond = 1
ENDIF
ENDIF
//---------------------------------------------------------------
// PHASE DETECTION
//---------------------------------------------------------------
// curPhase: 0 None, 1 Phase A, 2 Phase B, 3 Phase C, 4 Phase D, 5 Phase E,
// 11 Phase A (Dist), 12 Phase B (Dist), 13 Phase C (Dist), 14 Phase D (Dist)
// curPat: 0 None, 1 Accumulation, 2 Spring, 3 SOS, 4 LPS,
// 5 Distribution, 6 UTAD, 7 LPSY
once curPhase = 0
once curPat = 0
once phaseOn = 0
once tpR = 255
once tpG = 255
once tpB = 255
// Accumulation
IF psCond = 1 OR scCond = 1 THEN
curPhase = 1
phaseStartBar = barindex
phaseOn = 1
curPat = 1
tpR = 255
tpG = 107
tpB = 107
ELSIF arCond = 1 AND curPhase = 1 THEN
curPhase = 2
phaseStartBar = barindex
curPat = 1
tpR = 78
tpG = 205
tpB = 196
ELSIF testCond = 1 AND curPhase = 2 THEN
curPhase = 3
phaseStartBar = barindex
curPat = 1
tpR = 69
tpG = 183
tpB = 209
ELSIF springCond = 1 AND curPhase = 3 THEN
curPhase = 3
curPat = 2
tpR = 0
tpG = 230
tpB = 118
ELSIF sosCond = 1 AND (curPhase = 3 OR curPhase = 2) THEN
curPhase = 4
phaseStartBar = barindex
curPat = 3
tpR = 0
tpG = 255
tpB = 0
ELSIF lpsCond = 1 AND curPhase = 4 THEN
curPhase = 5
phaseStartBar = barindex
curPat = 4
tpR = 255
tpG = 234
tpB = 167
ENDIF
// Distribution
IF psyCond = 1 OR bcCond = 1 THEN
curPhase = 11
phaseStartBar = barindex
phaseOn = 1
curPat = 5
tpR = 242
tpG = 54
tpB = 69
ELSIF arDistCond = 1 AND curPhase = 11 THEN
curPhase = 12
phaseStartBar = barindex
curPat = 5
tpR = 255
tpG = 152
tpB = 0
ELSIF utadCond = 1 AND curPhase = 12 THEN
curPhase = 13
phaseStartBar = barindex
curPat = 6
tpR = 255
tpG = 152
tpB = 0
ELSIF lpsyCond = 1 AND curPhase = 13 THEN
curPhase = 14
phaseStartBar = barindex
curPat = 7
tpR = 242
tpG = 54
tpB = 69
ENDIF
//---------------------------------------------------------------
// EVENT LABELS (stored, drawn on the last bar)
//---------------------------------------------------------------
// evType: 1 SC, 2 AR, 3 Spring, 4 SOS, 5 LPS, 6 BC, 7 UTAD, 8 LPSY
priceOffset = (highestHigh - lowestLow) * (labelOffsetPct / 100)
once lastLabelBar = 0
once lastScBar = 0
once lastArBar = 0
once lastSpringBar = 0
once lastSosBar = 0
once lastLpsBar = 0
once lastBcBar = 0
once lastUtadBar = 0
once lastLpsyBar = 0
once nEv = 0
IF showLabels THEN
IF scCond = 1 AND barindex - lastScBar > minBarsBetweenLabels AND barindex - lastLabelBar > minBarsBetweenLabels THEN
nEv = nEv + 1
$evX[nEv] = barindex
$evY[nEv] = low - priceOffset
$evT[nEv] = 1
lastScBar = barindex
lastLabelBar = barindex
ENDIF
IF arCond = 1 AND barindex - lastArBar > minBarsBetweenLabels * 1.5 AND barindex - lastLabelBar > minBarsBetweenLabels THEN
nEv = nEv + 1
$evX[nEv] = barindex
$evY[nEv] = high + priceOffset
$evT[nEv] = 2
lastArBar = barindex
lastLabelBar = barindex
ENDIF
IF springCond = 1 AND barindex - lastSpringBar > minBarsBetweenLabels AND barindex - lastLabelBar > minBarsBetweenLabels THEN
nEv = nEv + 1
$evX[nEv] = barindex
$evY[nEv] = low - priceOffset
$evT[nEv] = 3
lastSpringBar = barindex
lastLabelBar = barindex
ENDIF
IF sosCond = 1 AND barindex - lastSosBar > minBarsBetweenLabels AND barindex - lastLabelBar > minBarsBetweenLabels THEN
nEv = nEv + 1
$evX[nEv] = barindex
$evY[nEv] = high + priceOffset
$evT[nEv] = 4
lastSosBar = barindex
lastLabelBar = barindex
ENDIF
IF lpsCond = 1 AND barindex - lastLpsBar > minBarsBetweenLabels * 1.5 AND barindex - lastLabelBar > minBarsBetweenLabels THEN
nEv = nEv + 1
$evX[nEv] = barindex
$evY[nEv] = low - priceOffset
$evT[nEv] = 5
lastLpsBar = barindex
lastLabelBar = barindex
ENDIF
IF bcCond = 1 AND barindex - lastBcBar > minBarsBetweenLabels AND barindex - lastLabelBar > minBarsBetweenLabels THEN
nEv = nEv + 1
$evX[nEv] = barindex
$evY[nEv] = high + priceOffset
$evT[nEv] = 6
lastBcBar = barindex
lastLabelBar = barindex
ENDIF
IF utadCond = 1 AND barindex - lastUtadBar > minBarsBetweenLabels AND barindex - lastLabelBar > minBarsBetweenLabels THEN
nEv = nEv + 1
$evX[nEv] = barindex
$evY[nEv] = high + priceOffset
$evT[nEv] = 7
lastUtadBar = barindex
lastLabelBar = barindex
ENDIF
IF lpsyCond = 1 AND barindex - lastLpsyBar > minBarsBetweenLabels * 1.5 AND barindex - lastLabelBar > minBarsBetweenLabels THEN
nEv = nEv + 1
$evX[nEv] = barindex
$evY[nEv] = high + priceOffset
$evT[nEv] = 8
lastLpsyBar = barindex
lastLabelBar = barindex
ENDIF
ENDIF
//---------------------------------------------------------------
// DAILY HIGHS AND LOWS (for the wave view)
//---------------------------------------------------------------
// One slot per day, written from scalars: safe on the live bar.
once nDay = 0
IF barindex = 0 OR date <> date[1] THEN
nDay = nDay + 1
dHi = high
dLo = low
ELSE
dHi = max(dHi, high)
dLo = min(dLo, low)
ENDIF
$dH[nDay] = dHi
$dL[nDay] = dLo
$dDt[nDay] = date
//---------------------------------------------------------------
// DRAWING
//---------------------------------------------------------------
IF islastbarupdate THEN
// ----- wave view: data and object count -----
chartHeight = highestHigh - lowestLow
containerTop = lowestLow - chartHeight * 0.50
containerBottom = lowestLow - chartHeight * 0.95
containerLeft = barindex - 90
containerRight = barindex + 30
containerHeight = containerTop - containerBottom
containerWidth = containerRight - containerLeft
curMonth = floor(date / 100) - floor(date / 10000) * 100
curYear = floor(date / 10000)
dataCount = 0
IF showMonthlyWave THEN
// the last 10 days that belong to the current month, oldest first
nWd = 0
kFrom = max(1, nDay - 9)
FOR kD = kFrom TO nDay DO
dM = floor($dDt[kD] / 100) - floor($dDt[kD] / 10000) * 100
dY = floor($dDt[kD] / 10000)
IF dM = curMonth AND dY = curYear THEN
nWd = nWd + 1
$wdH[nWd] = $dH[kD]
$wdL[nWd] = $dL[kD]
$wdT[nWd] = $dDt[kD]
ENDIF
NEXT
// zigzag of the days: low, high, low, high...
IF nWd > 0 THEN
pointsToPlot = min(monthlySwingLegs, nWd * 2)
FOR iW = 0 TO pointsToPlot - 1 DO
dayIndex = floor(iW / 2) + 1
IF iW MOD 2 = 0 THEN
$wv[iW] = $wdL[dayIndex]
ELSE
$wv[iW] = $wdH[dayIndex]
ENDIF
$wt[iW] = $wdT[dayIndex]
NEXT
dataCount = pointsToPlot
ENDIF
waveOk = 0
IF dataCount >= 3 THEN
maxVal = $wv[0]
minVal = $wv[0]
FOR iW = 1 TO dataCount - 1 DO
maxVal = max(maxVal, $wv[iW])
minVal = min(minVal, $wv[iW])
NEXT
valRange = maxVal - minVal
IF valRange > 0 THEN
waveOk = 1
ENDIF
ENDIF
ENDIF
// the original keeps at most 500 lines and 500 labels: the oldest go first
waveLines = 0
waveLabels = 0
IF showMonthlyWave THEN
waveLabels = 1
IF waveOk = 1 THEN
waveLines = 3 + (dataCount - 1)
waveLabels = waveLabels + dataCount + 2
IF showSwingPoints THEN
waveLines = waveLines + (dataCount - 1)
waveLabels = waveLabels + dataCount
ENDIF
ENDIF
ENDIF
srLines = 0
IF showLines AND srSet = 1 THEN
srLines = 3
ENDIF
phaseLabels = 0
IF showPhases AND phaseOn = 1 AND curPhase <> 0 THEN
phaseLabels = 1
ENDIF
maxZz = 500 - srLines - waveLines
maxEv = 500 - phaseLabels - waveLabels
// ----- zigzag -----
IF showZigzag THEN
zFrom = max(1, nZ - maxZz + 2)
IF nZ >= zFrom THEN
FOR kZ = zFrom TO nZ DO
// the very first leg starts from the initial placeholder low: not drawn
IF $zX1[kZ] >= 0 AND $zX2[kZ] >= 0 THEN
IF $zUp[kZ] = 1 THEN
DRAWSEGMENT($zX1[kZ], $zY1[kZ], $zX2[kZ], $zY2[kZ]) COLOURED(8, 153, 129, 179) STYLE(line, 2)
ELSE
DRAWSEGMENT($zX1[kZ], $zY1[kZ], $zX2[kZ], $zY2[kZ]) COLOURED(255, 152, 0, 179) STYLE(line, 2)
ENDIF
ENDIF
NEXT
ENDIF
IF liOn = 1 AND liX1 >= 0 AND liX2 >= 0 THEN
IF liUp = 1 THEN
DRAWSEGMENT(liX1, liY1, liX2, liY2) COLOURED(8, 153, 129, 179) STYLE(line, 2)
ELSE
DRAWSEGMENT(liX1, liY1, liX2, liY2) COLOURED(255, 152, 0, 179) STYLE(line, 2)
ENDIF
ENDIF
ENDIF
// ----- support / resistance / mid range -----
IF showLines AND srSet = 1 THEN
srX = max(0, srBar - lookback)
DRAWRAY(srX, curLL, srBar + 50, curLL) COLOURED(38, 166, 154, 179) STYLE(line, 2)
DRAWRAY(srX, curHH, srBar + 50, curHH) COLOURED(239, 83, 80, 179) STYLE(line, 2)
DRAWRAY(srX, curMid, srBar + 50, curMid) COLOURED(158, 158, 158, 128) STYLE(dottedline2, 1)
ENDIF
// ----- event labels -----
IF showLabels AND nEv >= 1 THEN
eFrom = max(1, nEv - maxEv + 1)
FOR kE = eFrom TO nEv DO
eX = $evX[kE]
eY = $evY[kE]
eT = $evT[kE]
IF eT = 1 OR eT = 6 THEN
eR = 242
eG = 54
eB = 69
ELSIF eT = 2 OR eT = 5 THEN
eR = 38
eG = 166
eB = 154
ELSIF eT = 3 THEN
eR = 0
eG = 230
eB = 118
ELSIF eT = 4 THEN
eR = 0
eG = 200
eB = 0
ELSIF eT = 7 THEN
eR = 255
eG = 152
eB = 0
ELSE
eR = 239
eG = 83
eB = 80
ENDIF
IF labelSize = 0 THEN
IF eT = 1 THEN
DRAWTEXT("SC", eX, eY, SansSerif, Bold, 9) COLOURED(eR, eG, eB)
ELSIF eT = 2 THEN
DRAWTEXT("AR", eX, eY, SansSerif, Bold, 9) COLOURED(eR, eG, eB)
ELSIF eT = 3 THEN
DRAWTEXT("Spring", eX, eY, SansSerif, Bold, 9) COLOURED(eR, eG, eB)
ELSIF eT = 4 THEN
DRAWTEXT("SOS", eX, eY, SansSerif, Bold, 9) COLOURED(eR, eG, eB)
ELSIF eT = 5 THEN
DRAWTEXT("LPS", eX, eY, SansSerif, Bold, 9) COLOURED(eR, eG, eB)
ELSIF eT = 6 THEN
DRAWTEXT("BC", eX, eY, SansSerif, Bold, 9) COLOURED(eR, eG, eB)
ELSIF eT = 7 THEN
DRAWTEXT("UTAD", eX, eY, SansSerif, Bold, 9) COLOURED(eR, eG, eB)
ELSE
DRAWTEXT("LPSY", eX, eY, SansSerif, Bold, 9) COLOURED(eR, eG, eB)
ENDIF
ELSIF labelSize = 2 THEN
IF eT = 1 THEN
DRAWTEXT("SC", eX, eY, SansSerif, Bold, 15) COLOURED(eR, eG, eB)
ELSIF eT = 2 THEN
DRAWTEXT("AR", eX, eY, SansSerif, Bold, 15) COLOURED(eR, eG, eB)
ELSIF eT = 3 THEN
DRAWTEXT("Spring", eX, eY, SansSerif, Bold, 15) COLOURED(eR, eG, eB)
ELSIF eT = 4 THEN
DRAWTEXT("SOS", eX, eY, SansSerif, Bold, 15) COLOURED(eR, eG, eB)
ELSIF eT = 5 THEN
DRAWTEXT("LPS", eX, eY, SansSerif, Bold, 15) COLOURED(eR, eG, eB)
ELSIF eT = 6 THEN
DRAWTEXT("BC", eX, eY, SansSerif, Bold, 15) COLOURED(eR, eG, eB)
ELSIF eT = 7 THEN
DRAWTEXT("UTAD", eX, eY, SansSerif, Bold, 15) COLOURED(eR, eG, eB)
ELSE
DRAWTEXT("LPSY", eX, eY, SansSerif, Bold, 15) COLOURED(eR, eG, eB)
ENDIF
ELSE
IF eT = 1 THEN
DRAWTEXT("SC", eX, eY, SansSerif, Bold, 12) COLOURED(eR, eG, eB)
ELSIF eT = 2 THEN
DRAWTEXT("AR", eX, eY, SansSerif, Bold, 12) COLOURED(eR, eG, eB)
ELSIF eT = 3 THEN
DRAWTEXT("Spring", eX, eY, SansSerif, Bold, 12) COLOURED(eR, eG, eB)
ELSIF eT = 4 THEN
DRAWTEXT("SOS", eX, eY, SansSerif, Bold, 12) COLOURED(eR, eG, eB)
ELSIF eT = 5 THEN
DRAWTEXT("LPS", eX, eY, SansSerif, Bold, 12) COLOURED(eR, eG, eB)
ELSIF eT = 6 THEN
DRAWTEXT("BC", eX, eY, SansSerif, Bold, 12) COLOURED(eR, eG, eB)
ELSIF eT = 7 THEN
DRAWTEXT("UTAD", eX, eY, SansSerif, Bold, 12) COLOURED(eR, eG, eB)
ELSE
DRAWTEXT("LPSY", eX, eY, SansSerif, Bold, 12) COLOURED(eR, eG, eB)
ENDIF
ENDIF
NEXT
ENDIF
// ----- phase box -----
IF showPhases AND phaseOn = 1 AND curPhase <> 0 THEN
IF curPhase = 1 OR curPhase = 11 THEN
bxR = 255
bxG = 107
bxB = 107
ELSIF curPhase = 2 OR curPhase = 12 THEN
bxR = 78
bxG = 205
bxB = 196
ELSIF curPhase = 3 OR curPhase = 13 THEN
bxR = 69
bxG = 183
bxB = 209
ELSIF curPhase = 4 OR curPhase = 14 THEN
bxR = 150
bxG = 206
bxB = 180
ELSE
bxR = 255
bxG = 234
bxB = 167
ENDIF
DRAWRECTANGLE(phaseStartBar, highestHigh, barindex, lowestLow) COLOURED(bxR, bxG, bxB, 255) FILLCOLOR(bxR, bxG, bxB, phA)
phX = floor((phaseStartBar + barindex) / 2)
phY = highestHigh + priceOffset * 2
IF curPhase = 1 THEN
DRAWTEXT("Phase A", phX, phY, SansSerif, Bold, 15) COLOURED(60, 60, 60)
ELSIF curPhase = 2 THEN
DRAWTEXT("Phase B", phX, phY, SansSerif, Bold, 15) COLOURED(60, 60, 60)
ELSIF curPhase = 3 THEN
DRAWTEXT("Phase C", phX, phY, SansSerif, Bold, 15) COLOURED(60, 60, 60)
ELSIF curPhase = 4 THEN
DRAWTEXT("Phase D", phX, phY, SansSerif, Bold, 15) COLOURED(60, 60, 60)
ELSIF curPhase = 5 THEN
DRAWTEXT("Phase E", phX, phY, SansSerif, Bold, 15) COLOURED(60, 60, 60)
ELSIF curPhase = 11 THEN
DRAWTEXT("Phase A (Dist)", phX, phY, SansSerif, Bold, 15) COLOURED(60, 60, 60)
ELSIF curPhase = 12 THEN
DRAWTEXT("Phase B (Dist)", phX, phY, SansSerif, Bold, 15) COLOURED(60, 60, 60)
ELSIF curPhase = 13 THEN
DRAWTEXT("Phase C (Dist)", phX, phY, SansSerif, Bold, 15) COLOURED(60, 60, 60)
ELSE
DRAWTEXT("Phase D (Dist)", phX, phY, SansSerif, Bold, 15) COLOURED(60, 60, 60)
ENDIF
ENDIF
// ----- wave view -----
IF showMonthlyWave THEN
DRAWRECTANGLE(containerLeft, containerTop, containerRight, containerBottom) COLOURED(255, 170, 59, 255)
titleY = containerTop - containerHeight * 0.08
titleX = floor(containerLeft + containerWidth * 0.5)
yrT = curYear
IF curMonth = 1 THEN
DRAWTEXT("JAN #yrT# DAILY VIEW", titleX, titleY, SansSerif, Bold, 12) COLOURED(200, 150, 0)
ELSIF curMonth = 2 THEN
DRAWTEXT("FEB #yrT# DAILY VIEW", titleX, titleY, SansSerif, Bold, 12) COLOURED(200, 150, 0)
ELSIF curMonth = 3 THEN
DRAWTEXT("MAR #yrT# DAILY VIEW", titleX, titleY, SansSerif, Bold, 12) COLOURED(200, 150, 0)
ELSIF curMonth = 4 THEN
DRAWTEXT("APR #yrT# DAILY VIEW", titleX, titleY, SansSerif, Bold, 12) COLOURED(200, 150, 0)
ELSIF curMonth = 5 THEN
DRAWTEXT("MAY #yrT# DAILY VIEW", titleX, titleY, SansSerif, Bold, 12) COLOURED(200, 150, 0)
ELSIF curMonth = 6 THEN
DRAWTEXT("JUN #yrT# DAILY VIEW", titleX, titleY, SansSerif, Bold, 12) COLOURED(200, 150, 0)
ELSIF curMonth = 7 THEN
DRAWTEXT("JUL #yrT# DAILY VIEW", titleX, titleY, SansSerif, Bold, 12) COLOURED(200, 150, 0)
ELSIF curMonth = 8 THEN
DRAWTEXT("AUG #yrT# DAILY VIEW", titleX, titleY, SansSerif, Bold, 12) COLOURED(200, 150, 0)
ELSIF curMonth = 9 THEN
DRAWTEXT("SEP #yrT# DAILY VIEW", titleX, titleY, SansSerif, Bold, 12) COLOURED(200, 150, 0)
ELSIF curMonth = 10 THEN
DRAWTEXT("OCT #yrT# DAILY VIEW", titleX, titleY, SansSerif, Bold, 12) COLOURED(200, 150, 0)
ELSIF curMonth = 11 THEN
DRAWTEXT("NOV #yrT# DAILY VIEW", titleX, titleY, SansSerif, Bold, 12) COLOURED(200, 150, 0)
ELSE
DRAWTEXT("DEC #yrT# DAILY VIEW", titleX, titleY, SansSerif, Bold, 12) COLOURED(200, 150, 0)
ENDIF
IF waveOk = 1 THEN
waveTop = containerTop - containerHeight * 0.15
waveBottom = containerBottom + containerHeight * 0.15
waveHeight = waveTop - waveBottom
waveLeft = containerLeft + containerWidth * 0.08
waveRight = containerRight - containerWidth * 0.08
xStep = (waveRight - waveLeft) / (dataCount - 1)
waveMid = (waveTop + waveBottom) / 2
waveResistance = waveTop - waveHeight * 0.25
waveSupport = waveBottom + waveHeight * 0.25
DRAWSEGMENT(containerLeft, waveSupport, containerRight, waveSupport) COLOURED(38, 166, 154, 128)
DRAWSEGMENT(containerLeft, waveResistance, containerRight, waveResistance) COLOURED(239, 83, 80, 128)
DRAWSEGMENT(containerLeft, waveMid, containerRight, waveMid) COLOURED(158, 158, 158, 128) STYLE(dottedline2, 1)
// points of the wave
FOR iW = 0 TO dataCount - 1 DO
$wy[iW] = waveBottom + (($wv[iW] - minVal) / valRange) * waveHeight
$wx[iW] = waveLeft + iW * xStep
NEXT
FOR iW = 0 TO dataCount - 1 DO
wX = floor($wx[iW])
wY = $wy[iW]
DRAWTEXT("•", wX, wY, SansSerif, Bold, 16) COLOURED(0, 200, 220)
IF iW >= 1 THEN
pX = floor($wx[iW - 1])
pY = $wy[iW - 1]
IF wY > pY THEN
DRAWSEGMENT(pX, pY, wX, wY) COLOURED(76, 175, 80) STYLE(line, 2)
ELSE
DRAWSEGMENT(pX, pY, wX, wY) COLOURED(242, 54, 69) STYLE(line, 2)
ENDIF
ENDIF
NEXT
// swing points with date stamps
IF showSwingPoints THEN
labelYOffset = waveHeight * 0.12
topSafeZone = containerTop - containerHeight * 0.08
bottomSafeZone = containerBottom + containerHeight * 0.08
FOR iW = 0 TO dataCount - 1 DO
wX = floor($wx[iW])
IF iW MOD 2 = 1 THEN
lblY = $wy[iW] + labelYOffset
ELSE
lblY = $wy[iW] - labelYOffset
ENDIF
lblY = max(bottomSafeZone, min(topSafeZone, lblY))
dd = $wt[iW] - floor($wt[iW] / 100) * 100
mm = floor($wt[iW] / 100) - floor($wt[iW] / 10000) * 100
IF dd >= 10 AND mm >= 10 THEN
DRAWTEXT("#dd#/#mm#", wX, lblY, SansSerif, Standard, 8) COLOURED(200, 150, 0)
ELSIF dd >= 10 THEN
DRAWTEXT("#dd#/0#mm#", wX, lblY, SansSerif, Standard, 8) COLOURED(200, 150, 0)
ELSIF mm >= 10 THEN
DRAWTEXT("0#dd#/#mm#", wX, lblY, SansSerif, Standard, 8) COLOURED(200, 150, 0)
ELSE
DRAWTEXT("0#dd#/0#mm#", wX, lblY, SansSerif, Standard, 8) COLOURED(200, 150, 0)
ENDIF
NEXT
// trend lines connecting the swing points
FOR iW = 0 TO dataCount - 2 DO
x1W = floor($wx[iW])
y1W = $wy[iW]
x2W = floor($wx[iW + 1])
y2W = $wy[iW + 1]
IF y2W > y1W THEN
DRAWSEGMENT(x1W, y1W, x2W, y2W) COLOURED(0, 255, 0, 51) STYLE(line, 2)
ELSE
DRAWSEGMENT(x1W, y1W, x2W, y2W) COLOURED(255, 0, 0, 51) STYLE(line, 2)
ENDIF
NEXT
ENDIF
// timeline markers
timelineY = containerBottom + containerHeight * 0.06
pastX = floor(containerLeft + containerWidth * 0.12)
presentX = floor(containerRight - containerWidth * 0.12)
DRAWTEXT("◄ Past", pastX, timelineY, SansSerif, Standard, 8) COLOURED(120, 123, 134)
DRAWTEXT("Present ►", presentX, timelineY, SansSerif, Standard, 8) COLOURED(120, 123, 134)
ENDIF
ENDIF
// ----- status table (top right corner) -----
IF showTable THEN
tabL = -330
tabR = -70
tTop = -12
rowH = 18
c0X = -275
c1X = -150
DRAWRECTANGLE(tabL - 2, tTop + 2, tabR + 2, tTop - 8 * rowH - 2) ANCHOR(TOPRIGHT, XSHIFT, YSHIFT) COLOURED(255, 235, 59, 255) FILLCOLOR(0, 0, 0, 255)
DRAWRECTANGLE(tabL, tTop, tabR, tTop - rowH) ANCHOR(TOPRIGHT, XSHIFT, YSHIFT) COLOURED(255, 235, 59, 255) FILLCOLOR(41, 98, 255, 77)
DRAWRECTANGLE(tabL, tTop - 3 * rowH, tabR, tTop - 4 * rowH) ANCHOR(TOPRIGHT, XSHIFT, YSHIFT) COLOURED(255, 235, 59, 255) FILLCOLOR(41, 98, 255, 77)
y0 = tTop - rowH / 2
DRAWTEXT("Wyckoff", c0X, y0, SansSerif, Bold, 11) ANCHOR(TOPRIGHT, XSHIFT, YSHIFT) COLOURED(255, 255, 255)
DRAWTEXT("Status", c1X, y0, SansSerif, Bold, 11) ANCHOR(TOPRIGHT, XSHIFT, YSHIFT) COLOURED(255, 255, 255)
y1 = y0 - rowH
DRAWTEXT("Phase:", c0X, y1, SansSerif, Standard, 10) ANCHOR(TOPRIGHT, XSHIFT, YSHIFT) COLOURED(255, 255, 255)
IF curPhase = 1 THEN
DRAWTEXT("Phase A", c1X, y1, SansSerif, Standard, 10) ANCHOR(TOPRIGHT, XSHIFT, YSHIFT) COLOURED(255, 255, 255)
ELSIF curPhase = 2 THEN
DRAWTEXT("Phase B", c1X, y1, SansSerif, Standard, 10) ANCHOR(TOPRIGHT, XSHIFT, YSHIFT) COLOURED(255, 255, 255)
ELSIF curPhase = 3 THEN
DRAWTEXT("Phase C", c1X, y1, SansSerif, Standard, 10) ANCHOR(TOPRIGHT, XSHIFT, YSHIFT) COLOURED(255, 255, 255)
ELSIF curPhase = 4 THEN
DRAWTEXT("Phase D", c1X, y1, SansSerif, Standard, 10) ANCHOR(TOPRIGHT, XSHIFT, YSHIFT) COLOURED(255, 255, 255)
ELSIF curPhase = 5 THEN
DRAWTEXT("Phase E", c1X, y1, SansSerif, Standard, 10) ANCHOR(TOPRIGHT, XSHIFT, YSHIFT) COLOURED(255, 255, 255)
ELSIF curPhase = 11 THEN
DRAWTEXT("Phase A (Dist)", c1X, y1, SansSerif, Standard, 10) ANCHOR(TOPRIGHT, XSHIFT, YSHIFT) COLOURED(255, 255, 255)
ELSIF curPhase = 12 THEN
DRAWTEXT("Phase B (Dist)", c1X, y1, SansSerif, Standard, 10) ANCHOR(TOPRIGHT, XSHIFT, YSHIFT) COLOURED(255, 255, 255)
ELSIF curPhase = 13 THEN
DRAWTEXT("Phase C (Dist)", c1X, y1, SansSerif, Standard, 10) ANCHOR(TOPRIGHT, XSHIFT, YSHIFT) COLOURED(255, 255, 255)
ELSIF curPhase = 14 THEN
DRAWTEXT("Phase D (Dist)", c1X, y1, SansSerif, Standard, 10) ANCHOR(TOPRIGHT, XSHIFT, YSHIFT) COLOURED(255, 255, 255)
ELSE
DRAWTEXT("None", c1X, y1, SansSerif, Standard, 10) ANCHOR(TOPRIGHT, XSHIFT, YSHIFT) COLOURED(255, 255, 255)
ENDIF
y2 = y1 - rowH
DRAWTEXT("Pattern:", c0X, y2, SansSerif, Standard, 10) ANCHOR(TOPRIGHT, XSHIFT, YSHIFT) COLOURED(255, 255, 255)
IF curPat = 1 THEN
DRAWTEXT("Accumulation", c1X, y2, SansSerif, Standard, 10) ANCHOR(TOPRIGHT, XSHIFT, YSHIFT) COLOURED(tpR, tpG, tpB)
ELSIF curPat = 2 THEN
DRAWTEXT("Spring", c1X, y2, SansSerif, Standard, 10) ANCHOR(TOPRIGHT, XSHIFT, YSHIFT) COLOURED(tpR, tpG, tpB)
ELSIF curPat = 3 THEN
DRAWTEXT("SOS", c1X, y2, SansSerif, Standard, 10) ANCHOR(TOPRIGHT, XSHIFT, YSHIFT) COLOURED(tpR, tpG, tpB)
ELSIF curPat = 4 THEN
DRAWTEXT("LPS", c1X, y2, SansSerif, Standard, 10) ANCHOR(TOPRIGHT, XSHIFT, YSHIFT) COLOURED(tpR, tpG, tpB)
ELSIF curPat = 5 THEN
DRAWTEXT("Distribution", c1X, y2, SansSerif, Standard, 10) ANCHOR(TOPRIGHT, XSHIFT, YSHIFT) COLOURED(tpR, tpG, tpB)
ELSIF curPat = 6 THEN
DRAWTEXT("UTAD", c1X, y2, SansSerif, Standard, 10) ANCHOR(TOPRIGHT, XSHIFT, YSHIFT) COLOURED(tpR, tpG, tpB)
ELSIF curPat = 7 THEN
DRAWTEXT("LPSY", c1X, y2, SansSerif, Standard, 10) ANCHOR(TOPRIGHT, XSHIFT, YSHIFT) COLOURED(tpR, tpG, tpB)
ELSE
DRAWTEXT("None", c1X, y2, SansSerif, Standard, 10) ANCHOR(TOPRIGHT, XSHIFT, YSHIFT) COLOURED(tpR, tpG, tpB)
ENDIF
y3 = y2 - rowH
DRAWTEXT("Key Events", c0X, y3, SansSerif, Bold, 11) ANCHOR(TOPRIGHT, XSHIFT, YSHIFT) COLOURED(255, 255, 255)
DRAWTEXT("Signals", c1X, y3, SansSerif, Bold, 11) ANCHOR(TOPRIGHT, XSHIFT, YSHIFT) COLOURED(255, 255, 255)
y4 = y3 - rowH
DRAWTEXT("SC/AR", c0X, y4, SansSerif, Standard, 10) ANCHOR(TOPRIGHT, XSHIFT, YSHIFT) COLOURED(242, 54, 69)
DRAWTEXT("Selling Climax/Rally", c1X, y4, SansSerif, Standard, 10) ANCHOR(TOPRIGHT, XSHIFT, YSHIFT) COLOURED(160, 163, 174)
y5 = y4 - rowH
DRAWTEXT("Spring", c0X, y5, SansSerif, Standard, 10) ANCHOR(TOPRIGHT, XSHIFT, YSHIFT) COLOURED(0, 230, 118)
DRAWTEXT("Bullish Reversal", c1X, y5, SansSerif, Standard, 10) ANCHOR(TOPRIGHT, XSHIFT, YSHIFT) COLOURED(160, 163, 174)
y6 = y5 - rowH
DRAWTEXT("SOS/LPS", c0X, y6, SansSerif, Standard, 10) ANCHOR(TOPRIGHT, XSHIFT, YSHIFT) COLOURED(0, 255, 0)
DRAWTEXT("Strength/Last Support", c1X, y6, SansSerif, Standard, 10) ANCHOR(TOPRIGHT, XSHIFT, YSHIFT) COLOURED(160, 163, 174)
y7 = y6 - rowH
DRAWTEXT("BC/UTAD/LPSY", c0X, y7, SansSerif, Standard, 10) ANCHOR(TOPRIGHT, XSHIFT, YSHIFT) COLOURED(255, 152, 0)
DRAWTEXT("Distribution Signals", c1X, y7, SansSerif, Standard, 10) ANCHOR(TOPRIGHT, XSHIFT, YSHIFT) COLOURED(160, 163, 174)
ENDIF
ENDIF
RETURN