

Wyckoff Event Detection
The Wyckoff method, developed by Richard D. Wyckoff in the early 20th century, describes how large operators accumulate positions before a markup and distribute them before a markdown. Traders who follow it spend a lot of time hunting for a specific vocabulary of events on the chart: a Selling Climax, a Spring, a Sign of Strength, an Upthrust. Spotting them by eye is slow and subjective.
This indicator, originally published by AlphaExtract, automates that work. Using only price action and volume, it classifies the market into an accumulation, distribution or neutral phase and labels sixteen canonical Wyckoff events directly on the chart. It also draws the active trading range and a compact status panel summarising phase, strength, price position and supply/demand balance.
Theory Behind the Indicator
The Wyckoff cycle in brief
Wyckoff frames the market as a repeating cycle of four phases: accumulation (smart money buys inside a range), markup (price trends up), distribution (smart money sells into strength) and markdown (price trends down). Each range-bound phase produces a recognisable sequence of events driven by the interaction between effort (volume) and result (price movement).
The indicator does not try to draw the whole schematic. Instead it detects the individual events and infers the dominant phase from their balance.
Phase engine
Every event is tagged bullish (accumulation family) or bearish (distribution family). The indicator keeps two running counters and compares them: when bearish events outnumber bullish ones by a factor of phaseMult, the phase is set to DISTRIBUTION; when the reverse is true, it is ACCUMULATION; otherwise NEUTRAL. The counters reset every phaseWindow bars so the read stays local to recent activity rather than the whole history.
Importantly, the phase is read before the counters are updated on the current bar, so four context-dependent events (UT-D, ST-D, AR-A, ST-A) can require the market to already be in a given phase without creating a circular dependency.
Event detection
Each event is a boolean built from a small set of primitives:
- a break of the rolling high or low (
highest/lowestoverpriceLookback), - volume relative to its moving average (
volMA), with several thresholds, - the close position inside the candle range,
- a strict directional streak of closes (the ProBuilder equivalent of Pine
ta.rising/ta.falling).
For example, a Selling Climax (SC) is a new low on very high volume that closes well off the low; a Spring is a break below support that closes back above it on elevated volume; an Upthrust in Distribution (UT-D) is a failed breakout above resistance closing red while the market is already in distribution.
The Sixteen Events
| Code | Phase | Meaning |
|------|-------|---------|
| PSY | Distribution | Preliminary Supply: first heavy selling hinting distribution is starting |
| UT-D | Distribution | Upthrust: failed breakout above resistance, weak demand |
| LPSY | Distribution | Last Point of Supply: final rally before markdown |
| SOW | Distribution | Sign of Weakness: breakdown on expanding volume |
| BC | Distribution | Buying Climax: climactic up spike that often ends the trend |
| ST-D | Distribution | Secondary Test: retest of the top on lighter volume |
| BUEC | Distribution | Backup after Upthrust: weak rally back toward resistance |
| PS | Accumulation | Preliminary Support: first notable buying that slows the decline |
| SC | Accumulation | Selling Climax: capitulation on very high volume, potential bottom |
| AR-A | Accumulation | Automatic Rally: reflex bounce after the selling climax |
| SOS | Accumulation | Sign of Strength: strong rally through resistance on rising demand |
| LPS | Accumulation | Last Point of Support: final pullback before markup |
| SPRING | Accumulation | Brief break under support that snaps back, trapping shorts |
| ST-A | Accumulation | Secondary Test: retest of lows on reduced volume |
| JAC | Accumulation | Jump Across the Creek: decisive breakout above range resistance |
| TSO | Accumulation | Terminal Shakeout: final washout before a sustained rally |
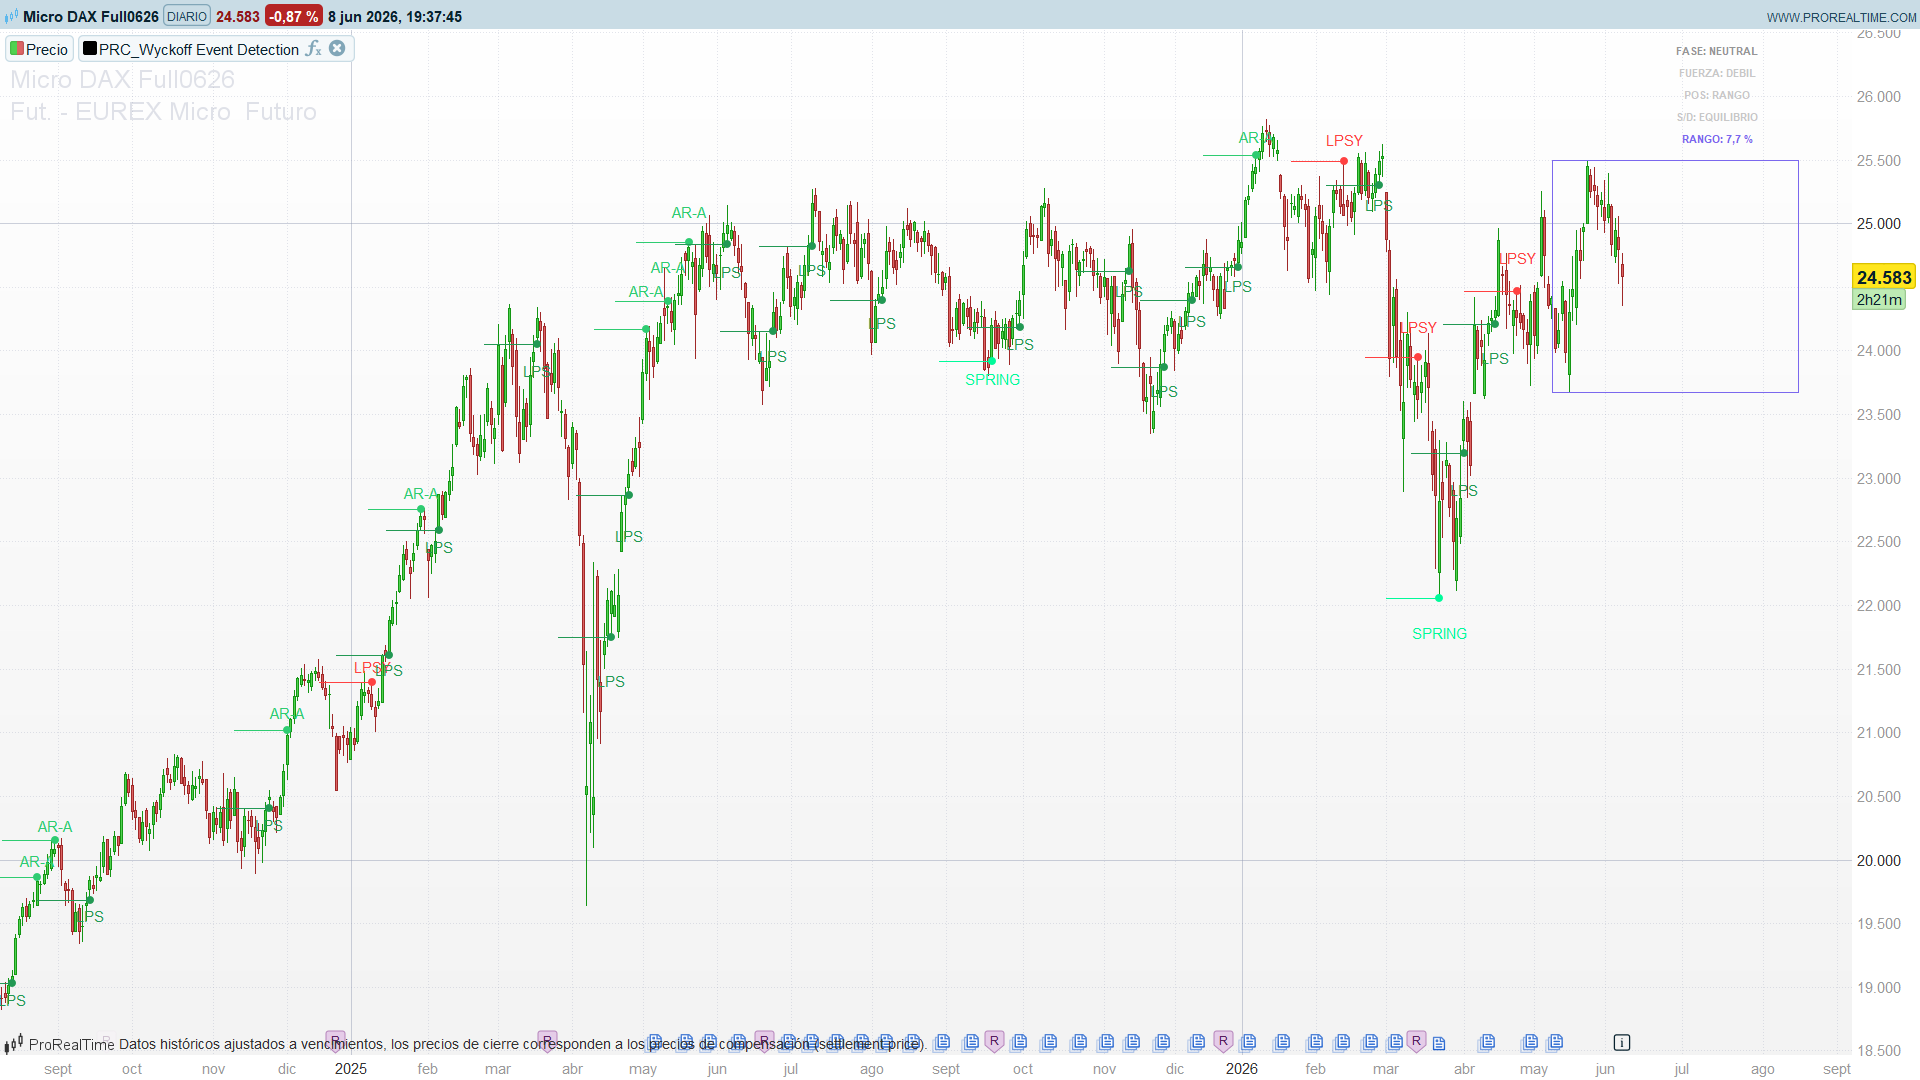
How to Read the Indicator
- Event labels sit at the high (distribution and breakout events) or the low (support and shakeout events) of the bar that triggered them. Distribution labels use red and orange tones, accumulation labels use green tones.
- Marks (optional,
showMarks): a coloured point of width 2 plus a short backward line at the event level, replicating the visual cue of the original. Turn them off withshowMarks = 0. - Trading range box: the violet rectangle marks the active range. Three styles are available (dynamic, fixed, pivot-based).
- Status panel (top-right corner): current PHASE, STRENGTH of that phase, price POSITION (at support, at resistance, in a spring/upthrust zone, or trading range), supply/demand state, and the range width as a percentage.
The most actionable read is the combination of a clear phase with a matching event: a SPRING or SC appearing while the panel shows ACCUMULATION is a far stronger long signal than the same label printed in a neutral context.
Practical Applications
- Market-phase filter. Read the panel before taking any trade. Trend-following longs make more sense in confirmed accumulation moving to markup; shorts in confirmed distribution.
- Reversal timing in ranges. SPRING, SC and SOS cluster near accumulation bottoms; BC, UT-D and SOW cluster near distribution tops. They give a structured alternative to guessing where a range will break.
- Support and resistance. The trading-range box gives an objective frame for stops and targets while a range persists.
- Confluence. The events pair naturally with order-flow or higher-timeframe bias tools: a Spring at a higher-timeframe demand zone is a classic high-probability setup.
Indicator Configuration
| Parameter | Default | Description |
|-----------|---------|-------------|
| `volLen` | 20 | Volume moving-average period |
| `priceLookback` | 20 | Window for rolling highs/lows and ATR |
| `volThreshMult` | 2.0 | Volume multiplier (higher = fewer events) |
| `priceThreshMult` | 0.3 | Price-move threshold inside the candle |
| `trendStrength` | 3 | Bars of strict streak to confirm a trend |
| `minBars` | 5 | Minimum spacing in bars between labels |
| `volumeFilter` | 1.5 | Volume filter for secondary (low-volume) events |
| `phaseMult` | 2.0 | How strongly one side must beat the other to set a phase |
| `phaseWindow` | 20 | Reset window for the phase counters |
| `showRange` | 1 | Draw the trading-range box |
| `rangeStyle` | 2 | 0 = dynamic, 1 = fixed, 2 = pivot-based |
| `showMarks` | 1 | Draw point + backward line on each event |
| `lineLength` | 15 | Length in bars of the backward line |
| `fixedRangeBars` | 50 | Lookback for the fixed range style |
| `pivotStrength` | 3 | Bars on each side to validate a pivot |
| `pivotLookback` | 100 | Bars to scan for pivots |
| `rangeExtend` | 50 | Bars to extend the range to the right |
Code
//----------------------------------------------
//PRC_Wyckoff Event Detection
//version = 0
//08.06.26
//Iván González @ www.prorealcode.com
//Autor original: AlphaExtract
//Sharing ProRealTime knowledge
//----------------------------------------------
// === Parametros ===
//----------------------------------------------
volLen = 20            // periodo media de volumen
priceLookback = 20     // ventana de maximos/minimos y ATR
volThreshMult = 2.0    // multiplicador de volumen (mayor = menos eventos)
priceThreshMult = 0.3  // umbral de movimiento de precio
trendStrength = 3      // barras de racha para confirmar tendencia
minBars = 5            // separacion minima (barras) por tipo de evento
volumeFilter = 1.5     // filtro de volumen para eventos secundarios
phaseMult = 2.0        // veces que un bando supera al otro para fijar fase
phaseWindow = 20       // ventana de reseteo de contadores de fase
showRange = 1          // 1 = dibuja rango de trading
rangeStyle = 2         // 0 = dinamico, 1 = fijo, 2 = por pivotes
showMarks = 1          // 1 = dibuja punto + linea hacia atras en cada evento
lineLength = 15        // longitud (barras) de la linea hacia atras de la muesca
fixedRangeBars = 50    // lookback del rango fijo
pivotStrength = 3      // barras a cada lado para validar pivote
pivotLookback = 100    // barras a escanear buscando pivotes
rangeExtend = 50       // barras de extension del rango hacia la derecha
//----------------------------------------------
// === Indicadores base ===
//----------------------------------------------
volMA = average[volLen](volume)
hh = highest[priceLookback](high)
ll = lowest[priceLookback](low)
avgTR = averagetruerange[priceLookback]
rng = high - low
labelOffset = avgTR * 0.5
//----------------------------------------------
// === Rachas direccionales ===
//----------------------------------------------
fallN = 1
for k = 1 to trendStrength do
   if close[k-1] >= close[k] then
      fallN = 0
   endif
next

riseN = 1
for k = 1 to trendStrength do
   if close[k-1] <= close[k] then
      riseN = 0
   endif
next

riseN1 = 1
for k = 1 to trendStrength + 1 do
   if close[k-1] <= close[k] then
      riseN1 = 0
   endif
next

riseN2 = 1
for k = 1 to trendStrength + 2 do
   if close[k-1] <= close[k] then
      riseN2 = 0
   endif
next
//----------------------------------------------
// === Contadores de fase ===
//----------------------------------------------
once bearishCount = 0
once bullishCount = 0

if bearishCount > bullishCount * phaseMult then
   currentPhase = 1   // DISTRIBUCION
elsif bullishCount > bearishCount * phaseMult then
   currentPhase = 2   // ACUMULACION
else
   currentPhase = 0   // NEUTRAL
endif
//----------------------------------------------
// === Condiciones de DISTRIBUCION (bajistas) ===
//----------------------------------------------
psyCond = 0
if high > hh[1] and volume > volMA * volThreshMult and close < high - rng * priceThreshMult and fallN = 1 then
   psyCond = 1
endif

utdCond = 0
if currentPhase = 1 and high > hh[1] and close < open and volume > volMA * volumeFilter and high - close > avgTR * priceThreshMult then
   utdCond = 1
endif

lpsyCond = 0
if high > high[1] and close < open and volume < volMA * volumeFilter and fallN = 1 then
   lpsyCond = 1
endif

sowCond = 0
if close < open and low < ll[1] and volume > volMA * volThreshMult and fallN = 1 then
   sowCond = 1
endif

bcCond = 0
if rng > 0 then
   if high > hh[2] and volume > volMA * (volThreshMult * 1.5) and close > open and (close - open) / rng > 0.6 then
      bcCond = 1
   endif
endif

stdCond = 0
if currentPhase = 1 and high > high[1] and high >= hh[5] * 0.98 and high <= hh[5] * 1.02 and volume < volMA and volume < volume[1] * 0.8 then
   stdCond = 1
endif

// BUEC: primer Upthrust en las ultimas 5 barras seguido de rally debil
buecCond = 0
for i = 1 to 5 do
   if utdCond[i] = 1 then
      if close < open and high < high[i] and close > low + rng * 0.3 and volume < volume[i] then
         buecCond = 1
      endif
      break
   endif
next
//----------------------------------------------
// === Condiciones de ACUMULACION (alcistas) ===
//----------------------------------------------
psCond = 0
if low < ll[1] and volume > volMA * volThreshMult and close > low + rng * priceThreshMult and fallN = 1 then
   psCond = 1
endif

scCond = 0
if low < ll[1] and volume > volMA * (volThreshMult * 1.2) and close > low + rng * (priceThreshMult * 1.5) then
   scCond = 1
endif

araCond = 0
if currentPhase = 2 and close > open and high > hh[trendStrength] and volume < volMA * volumeFilter and riseN = 1 then
   araCond = 1
endif

sosCond = 0
if close > open and high > hh[1] and volume > volMA * volThreshMult and riseN = 1 then
   sosCond = 1
endif

lpsCond = 0
if low > low[1] and close > open and volume < volMA * volumeFilter and riseN = 1 then
   lpsCond = 1
endif

springCond = 0
if low < ll[3] and close > open and close > low + rng * 0.6 and volume > volMA * volumeFilter then
   springCond = 1
endif

staCond = 0
if currentPhase = 2 and low < low[1] and low >= ll[5] * 0.98 and low <= ll[5] * 1.02 and volume < volMA and volume < volume[1] * 0.8 then
   staCond = 1
endif

jacCond = 0
if close > open and close > hh[3] and volume > volMA * volThreshMult and riseN1 = 1 then
   jacCond = 1
endif

tsoCond = 0
if low < ll[2] and close > open and close > low + rng * 0.7 and volume > volMA * (volThreshMult * 1.2) and riseN2 = 1 then
   tsoCond = 1
endif
//----------------------------------------------
// === Actualizacion de contadores + reseteo periodico ===
//----------------------------------------------
if psyCond = 1 or utdCond = 1 or lpsyCond = 1 or sowCond = 1 or bcCond = 1 or stdCond = 1 or buecCond = 1 then
   bearishCount = bearishCount + 1
endif
if psCond = 1 or scCond = 1 or araCond = 1 or sosCond = 1 or lpsCond = 1 or springCond = 1 or staCond = 1 or jacCond = 1 or tsoCond = 1 then
   bullishCount = bullishCount + 1
endif

if barindex mod phaseWindow = 0 then
   bearishCount = 0
   bullishCount = 0
endif
//----------------------------------------------
// === Dibujo de etiquetas ===
//----------------------------------------------
priceRangeFilter = 0.5
once lastLabelBar = 0 - 1000
once lastLabelPrice = 0
once lastR = 0
once lastG = 0
once lastB = 0

// Distribucion (etiqueta arriba salvo SOW)
if psyCond = 1 and (barindex - lastLabelBar >= minBars or abs(high - lastLabelPrice) / high >= priceRangeFilter) then
   drawtext("PSY", barindex, high + labelOffset) coloured(255, 107, 107)
   lastLabelBar = barindex
   lastLabelPrice = high
   lastR = 255
   lastG = 107
   lastB = 107
endif
if utdCond = 1 and (barindex - lastLabelBar >= minBars or abs(high - lastLabelPrice) / high >= priceRangeFilter) then
   drawtext("UT-D", barindex, high + labelOffset) coloured(255, 165, 0)
   lastLabelBar = barindex
   lastLabelPrice = high
   lastR = 255
   lastG = 165
   lastB = 0
endif
if lpsyCond = 1 and (barindex - lastLabelBar >= minBars or abs(high - lastLabelPrice) / high >= priceRangeFilter) then
   drawtext("LPSY", barindex, high + labelOffset) coloured(255, 65, 65)
   lastLabelBar = barindex
   lastLabelPrice = high
   lastR = 255
   lastG = 65
   lastB = 65
endif
if sowCond = 1 and (barindex - lastLabelBar >= minBars or abs(low - lastLabelPrice) / low >= priceRangeFilter) then
   drawtext("SOW", barindex, low - labelOffset) coloured(255, 0, 0)
   lastLabelBar = barindex
   lastLabelPrice = low
   lastR = 255
   lastG = 0
   lastB = 0
endif
if bcCond = 1 and (barindex - lastLabelBar >= minBars or abs(high - lastLabelPrice) / high >= priceRangeFilter) then
   drawtext("BC", barindex, high + labelOffset) coloured(255, 127, 0)
   lastLabelBar = barindex
   lastLabelPrice = high
   lastR = 255
   lastG = 127
   lastB = 0
endif
if stdCond = 1 and (barindex - lastLabelBar >= minBars or abs(high - lastLabelPrice) / high >= priceRangeFilter) then
   drawtext("ST-D", barindex, high + labelOffset) coloured(255, 160, 122)
   lastLabelBar = barindex
   lastLabelPrice = high
   lastR = 255
   lastG = 160
   lastB = 122
endif
if buecCond = 1 and (barindex - lastLabelBar >= minBars or abs(high - lastLabelPrice) / high >= priceRangeFilter) then
   drawtext("BUEC", barindex, high + labelOffset) coloured(255, 99, 71)
   lastLabelBar = barindex
   lastLabelPrice = high
   lastR = 255
   lastG = 99
   lastB = 71
endif

// Acumulacion (etiqueta abajo salvo AR-A / SOS / JAC)
if psCond = 1 and (barindex - lastLabelBar >= minBars or abs(low - lastLabelPrice) / low >= priceRangeFilter) then
   drawtext("PS", barindex, low - labelOffset) coloured(76, 175, 80)
   lastLabelBar = barindex
   lastLabelPrice = low
   lastR = 76
   lastG = 175
   lastB = 80
endif
if scCond = 1 and (barindex - lastLabelBar >= minBars or abs(low - lastLabelPrice) / low >= priceRangeFilter) then
   drawtext("SC", barindex, low - labelOffset) coloured(69, 179, 157)
   lastLabelBar = barindex
   lastLabelPrice = low
   lastR = 69
   lastG = 179
   lastB = 157
endif
if araCond = 1 and (barindex - lastLabelBar >= minBars or abs(high - lastLabelPrice) / high >= priceRangeFilter) then
   drawtext("AR-A", barindex, high + labelOffset) coloured(46, 204, 113)
   lastLabelBar = barindex
   lastLabelPrice = high
   lastR = 46
   lastG = 204
   lastB = 113
endif
if sosCond = 1 and (barindex - lastLabelBar >= minBars or abs(high - lastLabelPrice) / high >= priceRangeFilter) then
   drawtext("[SOS]", barindex, high + labelOffset) coloured(39, 174, 96)
   lastLabelBar = barindex
   lastLabelPrice = high
   lastR = 39
   lastG = 174
   lastB = 96
endif
if lpsCond = 1 and (barindex - lastLabelBar >= minBars or abs(low - lastLabelPrice) / low >= priceRangeFilter) then
   drawtext("LPS", barindex, low - labelOffset) coloured(34, 153, 84)
   lastLabelBar = barindex
   lastLabelPrice = low
   lastR = 34
   lastG = 153
   lastB = 84
endif
if springCond = 1 and (barindex - lastLabelBar >= minBars or abs(low - lastLabelPrice) / low >= priceRangeFilter) then
   drawtext("SPRING", barindex, low - labelOffset) coloured(0, 250, 154)
   lastLabelBar = barindex
   lastLabelPrice = low
   lastR = 0
   lastG = 250
   lastB = 154
endif
if staCond = 1 and (barindex - lastLabelBar >= minBars or abs(low - lastLabelPrice) / low >= priceRangeFilter) then
   drawtext("ST-A", barindex, low - labelOffset) coloured(102, 205, 170)
   lastLabelBar = barindex
   lastLabelPrice = low
   lastR = 102
   lastG = 205
   lastB = 170
endif
if jacCond = 1 and (barindex - lastLabelBar >= minBars or abs(high - lastLabelPrice) / high >= priceRangeFilter) then
   drawtext("JAC", barindex, high + labelOffset) coloured(50, 205, 50)
   lastLabelBar = barindex
   lastLabelPrice = high
   lastR = 50
   lastG = 205
   lastB = 50
endif
if tsoCond = 1 and (barindex - lastLabelBar >= minBars or abs(low - lastLabelPrice) / low >= priceRangeFilter) then
   drawtext("TSO", barindex, low - labelOffset) coloured(0, 128, 0)
   lastLabelBar = barindex
   lastLabelPrice = low
   lastR = 0
   lastG = 128
   lastB = 0
endif

// Muesca opcional
if showMarks = 1 and lastLabelBar = barindex then
   drawpoint(barindex, lastLabelPrice, 2) coloured(lastR, lastG, lastB)
   drawsegment(barindex - lineLength, lastLabelPrice, barindex, lastLabelPrice) coloured(lastR, lastG, lastB)
endif
//----------------------------------------------
// === Rango de trading + base del % del panel (solo ultima barra) ===
//----------------------------------------------
if islastbarupdate then
   if rangeStyle = 0 then
      topR = hh
      botR = ll
      x1 = barindex - priceLookback
   elsif rangeStyle = 1 then
      topR = highest[fixedRangeBars](high)
      botR = lowest[fixedRangeBars](low)
      x1 = barindex - fixedRangeBars
   else
      topR = hh
      botR = ll
      x1 = barindex - priceLookback
      foundH = 0
      foundL = 0
      maxLB = min(pivotLookback, barindex - pivotStrength - 1)
      if maxLB > 5 then
         for i = 5 to maxLB do
            if foundH = 0 then
               ph = 1
               for j = 1 to pivotStrength do
                  if high[i] <= high[i+j] or high[i] <= high[i-j] then
                     ph = 0
                  endif
               next
               if ph = 1 then
                  topR = high[i]
                  foundH = 1
               endif
            endif
         next
         for i = 5 to maxLB do
            if foundL = 0 then
               pl = 1
               for j = 1 to pivotStrength do
                  if low[i] >= low[i+j] or low[i] >= low[i-j] then
                     pl = 0
                  endif
               next
               if pl = 1 then
                  botR = low[i]
                  foundL = 1
               endif
            endif
         next
      endif
   endif
   if showRange = 1 then
      drawrectangle(x1, topR, barindex + rangeExtend, botR) coloured(123, 104, 238)
   endif
endif
//----------------------------------------------
// === Panel de estado ===
//----------------------------------------------
if islastbarupdate then
   panelX = -200    // px a la izquierda del borde derecho
   topY = -20       // px hacia abajo del borde superior

   if currentPhase = 2 then
      drawtext("FASE: ACUMULACION", panelX, topY, SansSerif, bold, 11) coloured(76, 175, 80) anchor(topright, xshift, yshift)
   elsif currentPhase = 1 then
      drawtext("FASE: DISTRIBUCION", panelX, topY, SansSerif, bold, 11) coloured(255, 107, 107) anchor(topright, xshift, yshift)
   else
      drawtext("FASE: NEUTRAL", panelX, topY, SansSerif, bold, 11) coloured(150, 150, 150) anchor(topright, xshift, yshift)
   endif

   denom = bullishCount + bearishCount
   if denom < 1 then
      denom = 1
   endif
   sRatio = abs(bullishCount - bearishCount) / denom
   if sRatio > 0.7 then
      drawtext("FUERZA: FUERTE", panelX, topY - 22, SansSerif, bold, 11) coloured(200, 200, 200) anchor(topright, xshift, yshift)
   elsif sRatio > 0.3 then
      drawtext("FUERZA: MODERADA", panelX, topY - 22, SansSerif, bold, 11) coloured(200, 200, 200) anchor(topright, xshift, yshift)
   else
      drawtext("FUERZA: DEBIL", panelX, topY - 22, SansSerif, bold, 11) coloured(200, 200, 200) anchor(topright, xshift, yshift)
   endif

   if high >= hh[3] and close < open then
      drawtext("POS: ZONA UPTHRUST", panelX, topY - 44, SansSerif, bold, 11) coloured(200, 200, 200) anchor(topright, xshift, yshift)
   elsif low <= ll[3] and close > open then
      drawtext("POS: ZONA SPRING", panelX, topY - 44, SansSerif, bold, 11) coloured(200, 200, 200) anchor(topright, xshift, yshift)
   elsif high >= hh[5] then
      drawtext("POS: EN RESISTENCIA", panelX, topY - 44, SansSerif, bold, 11) coloured(200, 200, 200) anchor(topright, xshift, yshift)
   elsif low <= ll[5] then
      drawtext("POS: EN SOPORTE", panelX, topY - 44, SansSerif, bold, 11) coloured(200, 200, 200) anchor(topright, xshift, yshift)
   else
      drawtext("POS: RANGO", panelX, topY - 44, SansSerif, bold, 11) coloured(200, 200, 200) anchor(topright, xshift, yshift)
   endif

   if volume > volMA * 1.5 and close > open then
      drawtext("S/D: DEMANDA", panelX, topY - 66, SansSerif, bold, 11) coloured(200, 200, 200) anchor(topright, xshift, yshift)
   elsif volume > volMA * 1.5 and close < open then
      drawtext("S/D: OFERTA", panelX, topY - 66, SansSerif, bold, 11) coloured(200, 200, 200) anchor(topright, xshift, yshift)
   else
      drawtext("S/D: EQUILIBRIO", panelX, topY - 66, SansSerif, bold, 11) coloured(200, 200, 200) anchor(topright, xshift, yshift)
   endif

   rangePct = round((topR - botR) / botR * 1000) / 10
   drawtext("RANGO: #rangePct#%", panelX, topY - 88, SansSerif, bold, 11) coloured(123, 104, 238) anchor(topright, xshift, yshift)
endif

return
