

Market Cycle Projection Engine
Introduction
Most trend indicators tell you what the market is doing right now — rising, falling, flat. Very few try to answer the harder question: where is the market in its current rotation? The Market Cycle Projection Engine (MCPE), originally published on TradingView by AleksDU, takes that second approach. It classifies every bar into one of five phases inspired by Wyckoff’s cycle model — Accumulation, Markup, Distribution, Markdown, Transition — using three objective measurements, and then projects the next expected move based on the amplitude of recent cycles.
The translation to ProBuilder is delivered as two complementary indicators: the main overlay (phase detection, structural levels, projection arrow and dashboard) and a lightweight companion (PRC_MCPE Bar Color) that reproduces the exact phase logic just to paint the candles — useful when you want the phase read without the full machinery of zones, levels and projection.
Theory Behind the Indicator
The Wyckoff Cycle, Formalised
Richard Wyckoff’s four-phase model of market behaviour (accumulation → markup → distribution → markdown) is usually read subjectively — a trader looks at a chart and decides where they are. MCPE replaces the subjectivity with three numerical tests, applied on every bar:
- Directional momentum — the slope of a linear regression of close over the cycle lookback, normalised by ATR so the reading is comparable across assets and timeframes.
- Volatility regime — the ratio of fast ATR (14) to slow ATR (over the cycle length). Values above 1.1 mean volatility is expanding; below 0.85, contracting.
- Price position within the cycle range — where close sits between the cycle high and cycle low, expressed as a number between 0 (bottom) and 1 (top).
The phase is then assigned by a small decision tree:
| Slope (normalised) | Volatility | Price position | Phase |
|---|---|---|---|
| > +0.1 | Expanding | — | **Markup** (green) |
| < −0.1 | Expanding | — | **Markdown** (red) |
| ≈ 0 (±0.1) | — | < 40 % | **Accumulation** (cyan) |
| ≈ 0 (±0.1) | — | ≥ 40 % | **Distribution** (orange) |
| anything else | — | — | **Transition** (purple) |
The logic is deliberately asymmetric: a trending phase needs both directional slope and expanding volatility, while the two flat phases are separated by position alone. The purple Transition state is a catch-all for bars that don’t fit — a useful “don’t trade this right now” signal.
Projecting the Next Move
MCPE does not predict a price target. What it does is measure the amplitude of the recent cycle and extend that amplitude forward from the current close. Three measurement modes are available:
- Cycle Average — slow_ATR × √cycleLen × 0.4, the statistical expectation of a cycleLen-bar walk at the current volatility.
- Last Cycle — 75 % of the range between the current cycle high and low (the dominant mode in practice).
- ATR Multiple — a fixed ATR(14) × 30 projection, independent of cycle structure.
The direction of the projection follows the current phase: upward in Accumulation and Markdown (the “next expected rotation” is up), downward in Markup and Distribution. This is the indicator’s most counter-intuitive choice — it is anticipating the next phase rather than extrapolating the current one — and it is what makes MCPE a cycle tool rather than a trend tool.
Key Features at a Glance
| Feature | Behaviour |
|---|---|
| Phase classifier | 5 states (4 Wyckoff + Transition), updated every bar, no repainting |
| Cycle zones | Last 6 completed phases drawn as colour-coded rectangles |
| Structural levels | Cycle High / Low / Mid + last 5 pivot highs and 5 pivot lows |
| Projection | Directional arrow + ±3·ATR confidence bands |
| Dashboard | Phase, duration, strength, position %, volatility, projection % |
| Bar colour | Delivered as a separate companion indicator |
How to Read the Indicator
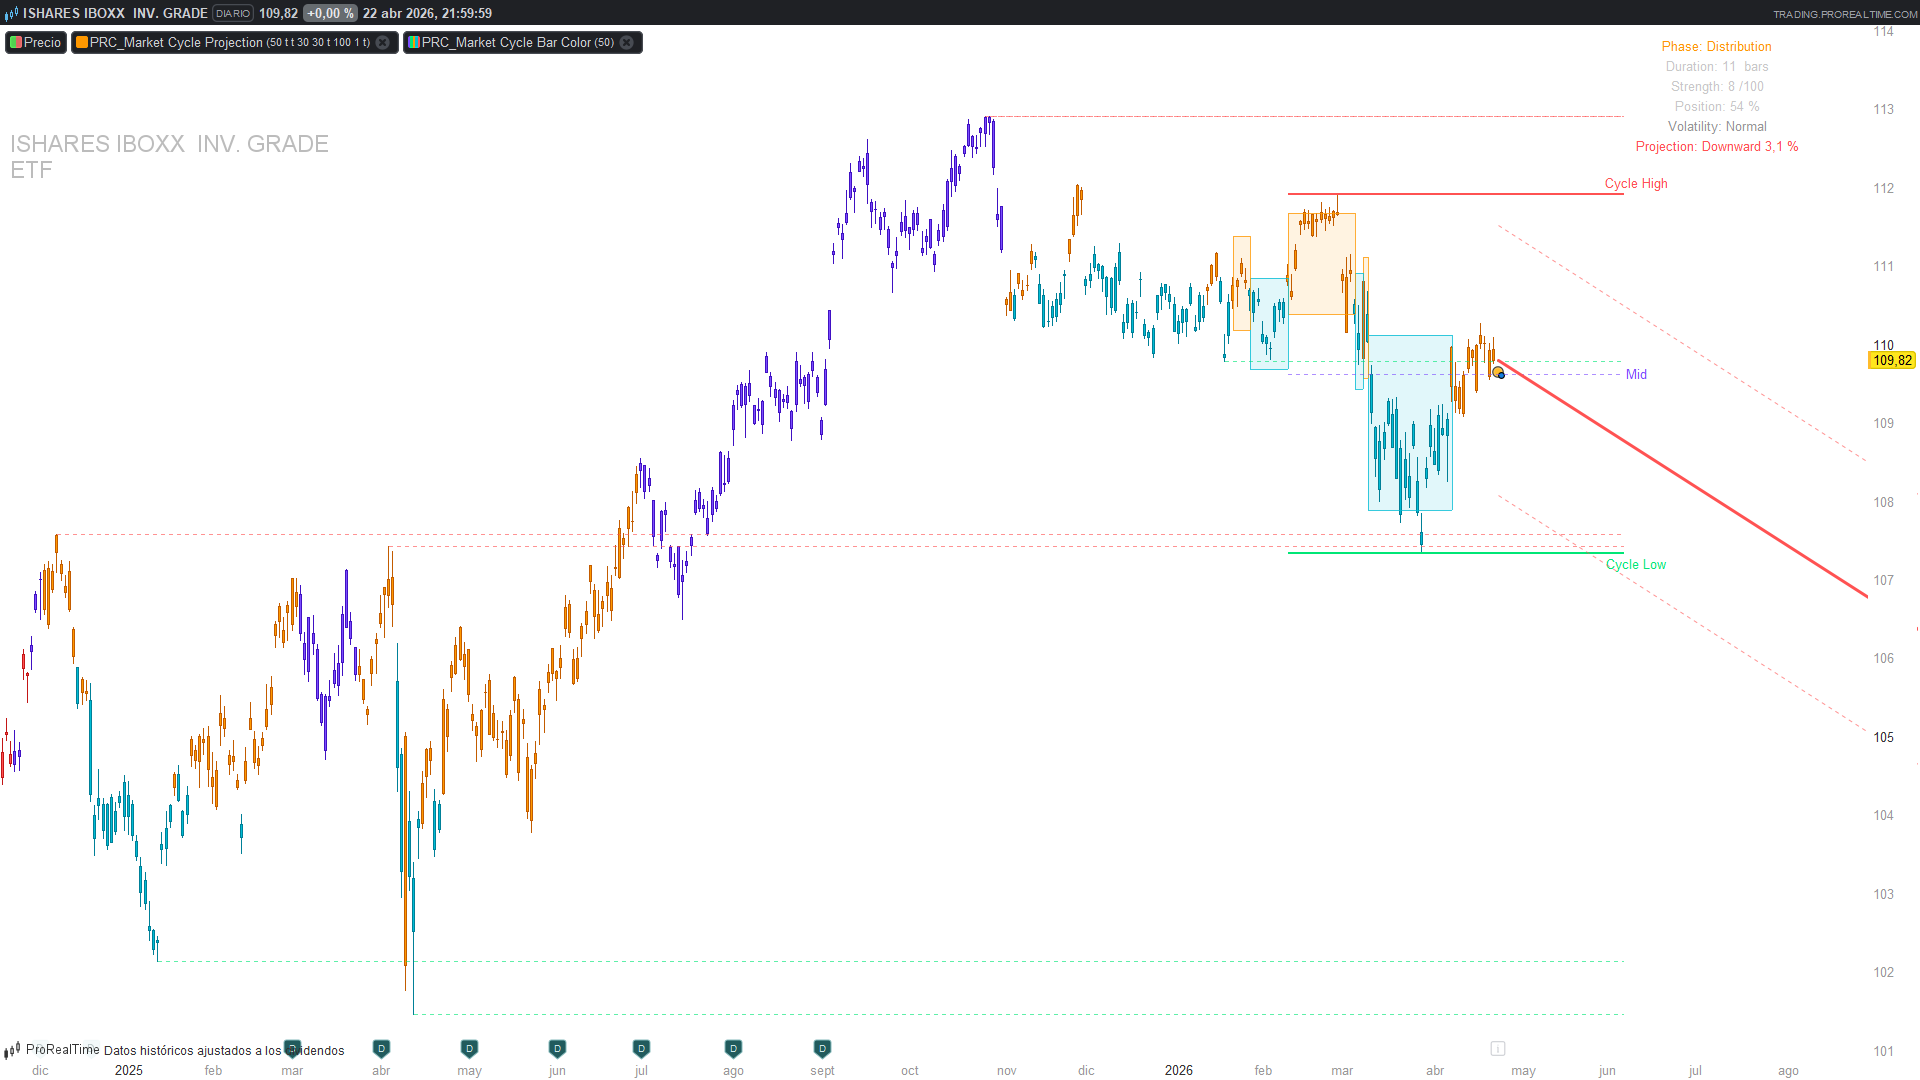
- Current phase colour — the dashboard (top-right) prints the phase name. The chart background zones show the history of phases, so you can see at a glance how many markups and markdowns have occurred.
- Cycle position % — below 30 % flags potential accumulation, above 70 % flags potential distribution. A reversion to the Mid line after an extreme is a textbook mean-reversion setup.
- Pivot levels — green dotted lines are historical pivot lows (support), red dotted lines pivot highs (resistance). They persist until a new pivot of the same type forms.
- Projection arrow — green up or red down, with a percentage label and dotted ±3·ATR confidence bands. Read it as “the typical amplitude of a rotation from here, in the direction the cycle is rotating next” — not as a price target.
- Volatility status on the dashboard — strong phase transitions tend to coincide with the expanding state. A transition into Markup with “Volatility: Expanding” is a higher-quality read than one with “Volatility: Normal”.
Practical Applications
- Entries aligned with the phase — longs from Accumulation into Markup, shorts from Distribution into Markdown. The two transitioning events (flat → trending) are the high-probability moments.
- Risk-off filter — avoid directional trades while phase = Transition (purple). The system is telling you that the three factors disagree.
- Mean reversion at the Mid line — after a clean Markup that parks price near Cycle High, a pullback to the Mid line is often the next rotation’s low. The Mid line is drawn explicitly for this purpose.
- Projection as a sizing sanity check — the projection % tells you the typical amplitude of a cycle in this instrument on this timeframe. If your stop is wider than the projected move, you are probably sized too large.
- Bar colour as a filter in other systems — the companion PRC_MCPE Bar Color is deliberately thin (no zones, no projection, no dashboard). Load it on top of your favourite system to only take signals while the bar is green (Markup) or red (Markdown), and to skip anything purple.
Indicator Configuration
| Parameter | Default | Description |
|---|---|---|
| `cycleLen` | 50 | Cycle lookback in bars. 50 for daily, 30 for 4H, 20 for 1H |
| `srLookback` | 30 | Pivot detection window. Higher = fewer but more significant pivots |
| `levelExt` | 30 | How many bars ahead the structural levels are extended |
| `showZones` | 1 | Draw the last 6 cycle zones as rectangles |
| `showLevels` | 1 | Draw pivot S/R and Cycle High/Low/Mid |
| `showProj` | 1 | Draw the projection arrow |
| `projLen` | 100 | Projection length in bars |
| `projMode` | 1 | 0 = Cycle Average, 1 = Last Cycle, 2 = ATR Multiple |
| `showDash` | 1 | Draw the top-right dashboard |
Every visual module is independently togglable. On a crowded chart, the typical choice is to keep showZones = 1 and showDash = 1, and toggle the rest as needed.
Implementation Notes
Translating MCPE to ProBuilder exposed a handful of subtleties that may be useful to document for anyone adapting Pine cycle indicators.
1. Manual linear-regression slope. Pine’s ta.linreg() returns the fitted value at a chosen offset, which makes linreg[0] – linreg[1] a one-step slope estimate. ProBuilder’s linearregression is the fitted value, not an indexable slope series in the same way. The cleanest solution is a FOR-loop that computes the slope directly from the closed-form least-squares formulas. The indexing is chosen so that i = 0 is the oldest bar and i = cycleLen – 1 the current one:
sumIY = 0
sumCloseN = 0
for i = 0 to cycleLen - 1 do
    sumIY = sumIY + i * close[cycleLen - 1 - i]
    sumCloseN = sumCloseN + close[cycleLen - 1 - i]
next
sumI  = cycleLen * (cycleLen - 1) / 2
sumII = cycleLen * (cycleLen - 1) * (2 * cycleLen - 1) / 6
lrDenom = cycleLen * sumII - sumI * sumI
if lrDenom <> 0 then
    lrSlope = (cycleLen * sumIY - sumI * sumCloseN) / lrDenom
else
    lrSlope = 0
endif
That’s 50 iterations per bar with the default cycleLen. On intraday charts with hundreds of thousands of bars this is noticeable, but the logic is correct and ATR-normalised so the reading is stable across assets.
2. Custom types → FIFO arrays. The Pine original stored each completed cycle as an instance of a CycleZone user-defined type. ProBuilder has no equivalent, so each field (start, end, high, low, phase) becomes its own dynamic array, and a FIFO of 6 entries is maintained manually with a DOWNTO loop on phase changes:
if phaseChanged then
    if zoneCnt < 6 then
        for k = zoneCnt downto 1 do
            $zStart[k] = $zStart[k - 1]
            $zEnd[k]   = $zEnd[k - 1]
            ...
        next
        zoneCnt = zoneCnt + 1
    else
        // FIFO drop oldest
        ...
    endif
endif
The same pattern is reused for the pivot FIFOs (last 5 PH, last 5 PL).
3. Drawing on the last bar only. All zone, level, projection and dashboard drawing is gated on islastbarupdate and the indicator declares defparam drawonlastbaronly = true. This is essential — drawing zones on every historical bar would flood the chart with duplicated overlays and destroy performance.
4. Dashboard via anchored drawtext. ProBuilder has no table.new(). The dashboard is reproduced as six drawtext calls with anchor(topright, xshift, yshift) at fixed negative offsets, which docks the panel to the chart corner regardless of pan/zoom.
5. Companion bar-colour indicator. Painting candles by phase could be done inside the main indicator with drawcandle, but it would force the main indicator onto the price chart (rather than as an overlay on top of standard candles) and complicates phase tuning. Packaging the bar colour as a separate indicator with the same phase logic replicated inline keeps the two concerns independent — the user can load only the colouring, only the main indicator, or both.
6. What was dropped from the original. Three elements of the Pine version do not have a clean ProBuilder equivalent:
- The native table.new() dashboard — replaced by anchored text lines. The information is preserved, the visual density is lower.
- The box.new() / label.new() calls with persistent handles — replaced by drawrectangle / drawtext issued on every last-bar update. Visually equivalent.
- The alertcondition() triggers — alerts in ProRealTime are configured from the UI, on conditions like phase = 2 and phase[1] <> 2 (first bar of Markup).
Code — Indicator 1: Main Engine
//-------------------------------------------------//
// PRC_Market Cycle Projection Engine
// Adapted from PineScript [AleksDU]
// version = 0
// 30.03.2026
// Iván González @ www.prorealcode.com
// Sharing ProRealTime knowledge
//-------------------------------------------------//
defparam drawonlastbaronly = true

// === INPUTS ===
cycleLen = 50       // Cycle lookback (bars)
showZones = 1       // Show cycle zones (1=yes)
showLevels = 1      // Show key S/R levels (1=yes)
srLookback = 30     // S/R pivot lookback
levelExt = 30       // Extend levels (bars)
showProj = 1        // Show projection (1=yes)
projLen = 100       // Projection bars
projMode = 1        // 0=Cycle Average, 1=Last Cycle, 2=ATR Multiple
showDash = 1        // Show Dashboard (1=yes)

// ================================================================
// MODULE A: CYCLE DETECTION
// ================================================================

// --- ATR ---
atr14 = averagetruerange[14]
atrSlow = averagetruerange[cycleLen]

// --- Cycle Range ---
cycleHigh = highest[cycleLen](high)
cycleLow = lowest[cycleLen](low)
cycleRange = cycleHigh - cycleLow
cycleMid = (cycleHigh + cycleLow) / 2

// --- Linear Regression Slope (manual, per bar) ---
sumIY = 0
sumCloseN = 0
for i = 0 to cycleLen - 1 do
    sumIY = sumIY + i * close[cycleLen - 1 - i]
    sumCloseN = sumCloseN + close[cycleLen - 1 - i]
next
sumI = cycleLen * (cycleLen - 1) / 2
sumII = cycleLen * (cycleLen - 1) * (2 * cycleLen - 1) / 6
lrDenom = cycleLen * sumII - sumI * sumI
if lrDenom <> 0 then
    lrSlope = (cycleLen * sumIY - sumI * sumCloseN) / lrDenom
else
    lrSlope = 0
endif

// --- Normalized slope ---
lrSlopeNorm = lrSlope / max(atr14, 0.0001)

// --- Volatility state ---
atrRatio = atr14 / max(atrSlow, 0.0001)
isExpanding = (atrRatio > 1.1)
isContracting = (atrRatio < 0.85)

// --- Volume state ---
volSMA = average[20](volume)
volRising = (volume > volSMA * 1.2)
volFalling = (volume < volSMA * 0.8)

// --- Price position (0=bottom, 1=top) ---
pricePos = (close - cycleLow) / max(cycleRange, 0.0001)

// ================================================================
// PHASE CLASSIFICATION
// 1=Accumulation, 2=Markup, 3=Distribution, 4=Markdown, 5=Transition
// ================================================================
phase = 5
if lrSlopeNorm > 0.1 and isExpanding then
    phase = 2
elsif lrSlopeNorm < -0.1 and isExpanding then
    phase = 4
elsif lrSlopeNorm >= -0.1 and lrSlopeNorm <= 0.1 and pricePos < 0.4 then
    phase = 1
elsif lrSlopeNorm >= -0.1 and lrSlopeNorm <= 0.1 and pricePos >= 0.4 then
    phase = 3
endif

// Phase colors
if phase = 1 then
    rPh = 0
    gPh = 188
    bPh = 212
elsif phase = 2 then
    rPh = 0
    gPh = 230
    bPh = 118
elsif phase = 3 then
    rPh = 255
    gPh = 152
    bPh = 0
elsif phase = 4 then
    rPh = 255
    gPh = 82
    bPh = 82
else
    rPh = 124
    gPh = 77
    bPh = 255
endif

// ================================================================
// PHASE CHANGE DETECTION + ZONE STORAGE
// ================================================================
once prevPhase = 0
once phaseStartBar = 0
once phaseHi = high
once phaseLo = low
once zoneCnt = 0

phaseChanged = (phase <> prevPhase and prevPhase <> 0)

if phaseChanged then
    if zoneCnt < 6 then
        for k = zoneCnt downto 1 do
            $zStart[k] = $zStart[k - 1]
            $zEnd[k] = $zEnd[k - 1]
            $zHi[k] = $zHi[k - 1]
            $zLo[k] = $zLo[k - 1]
            $zPh[k] = $zPh[k - 1]
        next
        zoneCnt = zoneCnt + 1
    else
        for k = 5 downto 1 do
            $zStart[k] = $zStart[k - 1]
            $zEnd[k] = $zEnd[k - 1]
            $zHi[k] = $zHi[k - 1]
            $zLo[k] = $zLo[k - 1]
            $zPh[k] = $zPh[k - 1]
        next
    endif

    zmid = (phaseHi + phaseLo) / 2
    $zStart[0] = phaseStartBar
    $zEnd[0] = barindex
    $zHi[0] = zmid + atr14 * 1.5
    $zLo[0] = zmid - atr14 * 1.5
    $zPh[0] = prevPhase

    prevPhase = phase
    phaseStartBar = barindex
    phaseHi = high
    phaseLo = low
else
    if prevPhase = 0 then
        prevPhase = phase
        phaseStartBar = barindex
    endif
    if high > phaseHi then
        phaseHi = high
    endif
    if low < phaseLo then
        phaseLo = low
    endif
endif

phaseDuration = barindex - phaseStartBar

// ================================================================
// MODULE B: S/R LEVELS (pivot tracking, every bar)
// ================================================================
once phCnt = 0
once plCnt = 0

isPH = 0
if barindex >= 2 * srLookback + 1 then
    if high[srLookback] = highest[2 * srLookback + 1](high) then
        isPH = 1
    endif
endif
isPL = 0
if barindex >= 2 * srLookback + 1 then
    if low[srLookback] = lowest[2 * srLookback + 1](low) then
        isPL = 1
    endif
endif

if isPH then
    if phCnt < 5 then
        for k = phCnt downto 1 do
            $phVal[k] = $phVal[k - 1]
            $phBar[k] = $phBar[k - 1]
        next
        phCnt = phCnt + 1
    else
        for k = 4 downto 1 do
            $phVal[k] = $phVal[k - 1]
            $phBar[k] = $phBar[k - 1]
        next
    endif
    $phVal[0] = high[srLookback]
    $phBar[0] = barindex - srLookback
endif

if isPL then
    if plCnt < 5 then
        for k = plCnt downto 1 do
            $plVal[k] = $plVal[k - 1]
            $plBar[k] = $plBar[k - 1]
        next
        plCnt = plCnt + 1
    else
        for k = 4 downto 1 do
            $plVal[k] = $plVal[k - 1]
            $plBar[k] = $plBar[k - 1]
        next
    endif
    $plVal[0] = low[srLookback]
    $plBar[0] = barindex - srLookback
endif

// ================================================================
// MODULE C: PROJECTION
// ================================================================
projUp = (phase = 1 or phase = 4)

projAmpl = 0
if projMode = 0 then
    projAmpl = atrSlow * sqrt(cycleLen) * 0.4
elsif projMode = 1 then
    projAmpl = cycleRange * 0.75
else
    projAmpl = atr14 * 30
endif

// ================================================================
// DRAWING (last bar only)
// ================================================================
if islastbarupdate then

    // --- Cycle Zones ---
    if showZones and zoneCnt > 0 then
        for z = 0 to zoneCnt - 1 do
            zPh = $zPh[z]
            if zPh = 1 then
                rZ = 0
                gZ = 188
                bZ = 212
            elsif zPh = 2 then
                rZ = 0
                gZ = 230
                bZ = 118
            elsif zPh = 3 then
                rZ = 255
                gZ = 152
                bZ = 0
            elsif zPh = 4 then
                rZ = 255
                gZ = 82
                bZ = 82
            else
                rZ = 124
                gZ = 77
                bZ = 255
            endif
            drawrectangle($zStart[z], $zHi[z], $zEnd[z], $zLo[z]) coloured(rZ, gZ, bZ, 200) fillcolor(rZ, gZ, bZ, 30)
        next
    endif

    // --- S/R Levels ---
    if showLevels then
        if phCnt > 0 then
            for i = 0 to phCnt - 1 do
                drawsegment($phBar[i], $phVal[i], barindex + levelExt, $phVal[i]) coloured(255, 82, 82, 160) style(dottedline, 1)
            next
        endif
        if plCnt > 0 then
            for i = 0 to plCnt - 1 do
                drawsegment($plBar[i], $plVal[i], barindex + levelExt, $plVal[i]) coloured(0, 230, 118, 160) style(dottedline, 1)
            next
        endif
        drawsegment(barindex - cycleLen, cycleHigh, barindex + levelExt, cycleHigh) coloured(255, 82, 82) style(line, 2)
        drawtext("Cycle High", barindex + levelExt + 3, cycleHigh) coloured(255, 82, 82)
        drawsegment(barindex - cycleLen, cycleLow, barindex + levelExt, cycleLow) coloured(0, 230, 118) style(line, 2)
        drawtext("Cycle Low", barindex + levelExt + 3, cycleLow) coloured(0, 230, 118)
        drawsegment(barindex - cycleLen, cycleMid, barindex + levelExt, cycleMid) coloured(124, 77, 255, 160) style(dottedline, 1)
        drawtext("Mid", barindex + levelExt + 3, cycleMid) coloured(124, 77, 255)
    endif

    // --- Projection ---
    if showProj then
        if projUp then
            ep = close + projAmpl
            rA = 0
            gA = 230
            bA = 118
        else
            ep = close - projAmpl
            rA = 255
            gA = 82
            bA = 82
        endif
        drawsegment(barindex, close, barindex + projLen, ep) coloured(rA, gA, bA) style(line, 3)
        drawsegment(barindex, close + atr14 * 3, barindex + projLen, ep + atr14 * 3) coloured(rA, gA, bA, 160) style(dottedline, 1)
        drawsegment(barindex, close - atr14 * 3, barindex + projLen, ep - atr14 * 3) coloured(rA, gA, bA, 160) style(dottedline, 1)
        projPct = round(projAmpl / close * 1000) / 10
        if projUp then
            drawtext("+#projPct#%", barindex + projLen + 3, ep) coloured(rA, gA, bA)
        else
            drawtext("-#projPct#%", barindex + projLen + 3, ep) coloured(rA, gA, bA)
        endif
    endif

    // --- Dashboard ---
    if showDash then
        if phase = 1 then
            drawtext("Phase: Accumulation", -200, -20) anchor(topright, xshift, yshift) coloured(0, 188, 212)
        elsif phase = 2 then
            drawtext("Phase: Markup", -200, -20) anchor(topright, xshift, yshift) coloured(0, 230, 118)
        elsif phase = 3 then
            drawtext("Phase: Distribution", -200, -20) anchor(topright, xshift, yshift) coloured(255, 152, 0)
        elsif phase = 4 then
            drawtext("Phase: Markdown", -200, -20) anchor(topright, xshift, yshift) coloured(255, 82, 82)
        else
            drawtext("Phase: Transition", -200, -20) anchor(topright, xshift, yshift) coloured(124, 77, 255)
        endif
        drawtext("Duration: #phaseDuration# bars", -200, -40) anchor(topright, xshift, yshift) coloured(200, 200, 200)
        cycleStr = round(abs(pricePos - 0.5) * 200)
        drawtext("Strength: #cycleStr#/100", -200, -60) anchor(topright, xshift, yshift) coloured(200, 200, 200)
        posPct = round(pricePos * 100)
        drawtext("Position: #posPct#%", -200, -80) anchor(topright, xshift, yshift) coloured(200, 200, 200)
        if isExpanding then
            drawtext("Volatility: Expanding", -200, -100) anchor(topright, xshift, yshift) coloured(255, 152, 0)
        elsif isContracting then
            drawtext("Volatility: Contracting", -200, -100) anchor(topright, xshift, yshift) coloured(0, 188, 212)
        else
            drawtext("Volatility: Normal", -200, -100) anchor(topright, xshift, yshift) coloured(150, 150, 150)
        endif
        if projUp then
            drawtext("Projection: Upward #projPct#%", -200, -120) anchor(topright, xshift, yshift) coloured(0, 230, 118)
        else
            drawtext("Projection: Downward #projPct#%", -200, -120) anchor(topright, xshift, yshift) coloured(255, 82, 82)
        endif
    endif

endif

return
Code — Indicator 2: Bar Color Companion
This second indicator is optional. It replicates the exact phase-classification logic of the main indicator (same cycleLen, same slope, same volatility test, same thresholds) and its only output is a coloured candle. Loaded on top of the main one — or on its own — it gives the phase read directly on price bars without any extra visuals.
//-------------------------------------------------//
// PRC_MCPE Bar Color
// Companion to PRC_Market Cycle Projection Engine
// version = 0
// 30.03.2026
// Iván González @ www.prorealcode.com
// Sharing ProRealTime knowledge
//-------------------------------------------------//

// === INPUTS (same as main indicator) ===
cycleLen = 50       // Cycle lookback (bars)

// === CYCLE DETECTION (replicated from main) ===
atr14 = averagetruerange[14]
atrSlow = averagetruerange[cycleLen]

cycleHigh = highest[cycleLen](high)
cycleLow = lowest[cycleLen](low)
cycleRange = cycleHigh - cycleLow

// Linear Regression Slope
sumIY = 0
sumCloseN = 0
for i = 0 to cycleLen - 1 do
    sumIY = sumIY + i * close[cycleLen - 1 - i]
    sumCloseN = sumCloseN + close[cycleLen - 1 - i]
next
sumI = cycleLen * (cycleLen - 1) / 2
sumII = cycleLen * (cycleLen - 1) * (2 * cycleLen - 1) / 6
lrDenom = cycleLen * sumII - sumI * sumI
if lrDenom <> 0 then
    lrSlope = (cycleLen * sumIY - sumI * sumCloseN) / lrDenom
else
    lrSlope = 0
endif

lrSlopeNorm = lrSlope / max(atr14, 0.0001)
atrRatio = atr14 / max(atrSlow, 0.0001)
isExpanding = (atrRatio > 1.1)
pricePos = (close - cycleLow) / max(cycleRange, 0.0001)

// Phase classification
if lrSlopeNorm > 0.1 and isExpanding then
    drawcandle(open, high, low, close) coloured(0, 230, 118)
elsif lrSlopeNorm < -0.1 and isExpanding then
    drawcandle(open, high, low, close) coloured(255, 82, 82)
elsif lrSlopeNorm >= -0.1 and lrSlopeNorm <= 0.1 and pricePos < 0.4 then
    drawcandle(open, high, low, close) coloured(0, 188, 212)
elsif lrSlopeNorm >= -0.1 and lrSlopeNorm <= 0.1 and pricePos >= 0.4 then
    drawcandle(open, high, low, close) coloured(255, 152, 0)
else
    drawcandle(open, high, low, close) coloured(124, 77, 255)
endif

return
