

Weinstein Stage Analysis
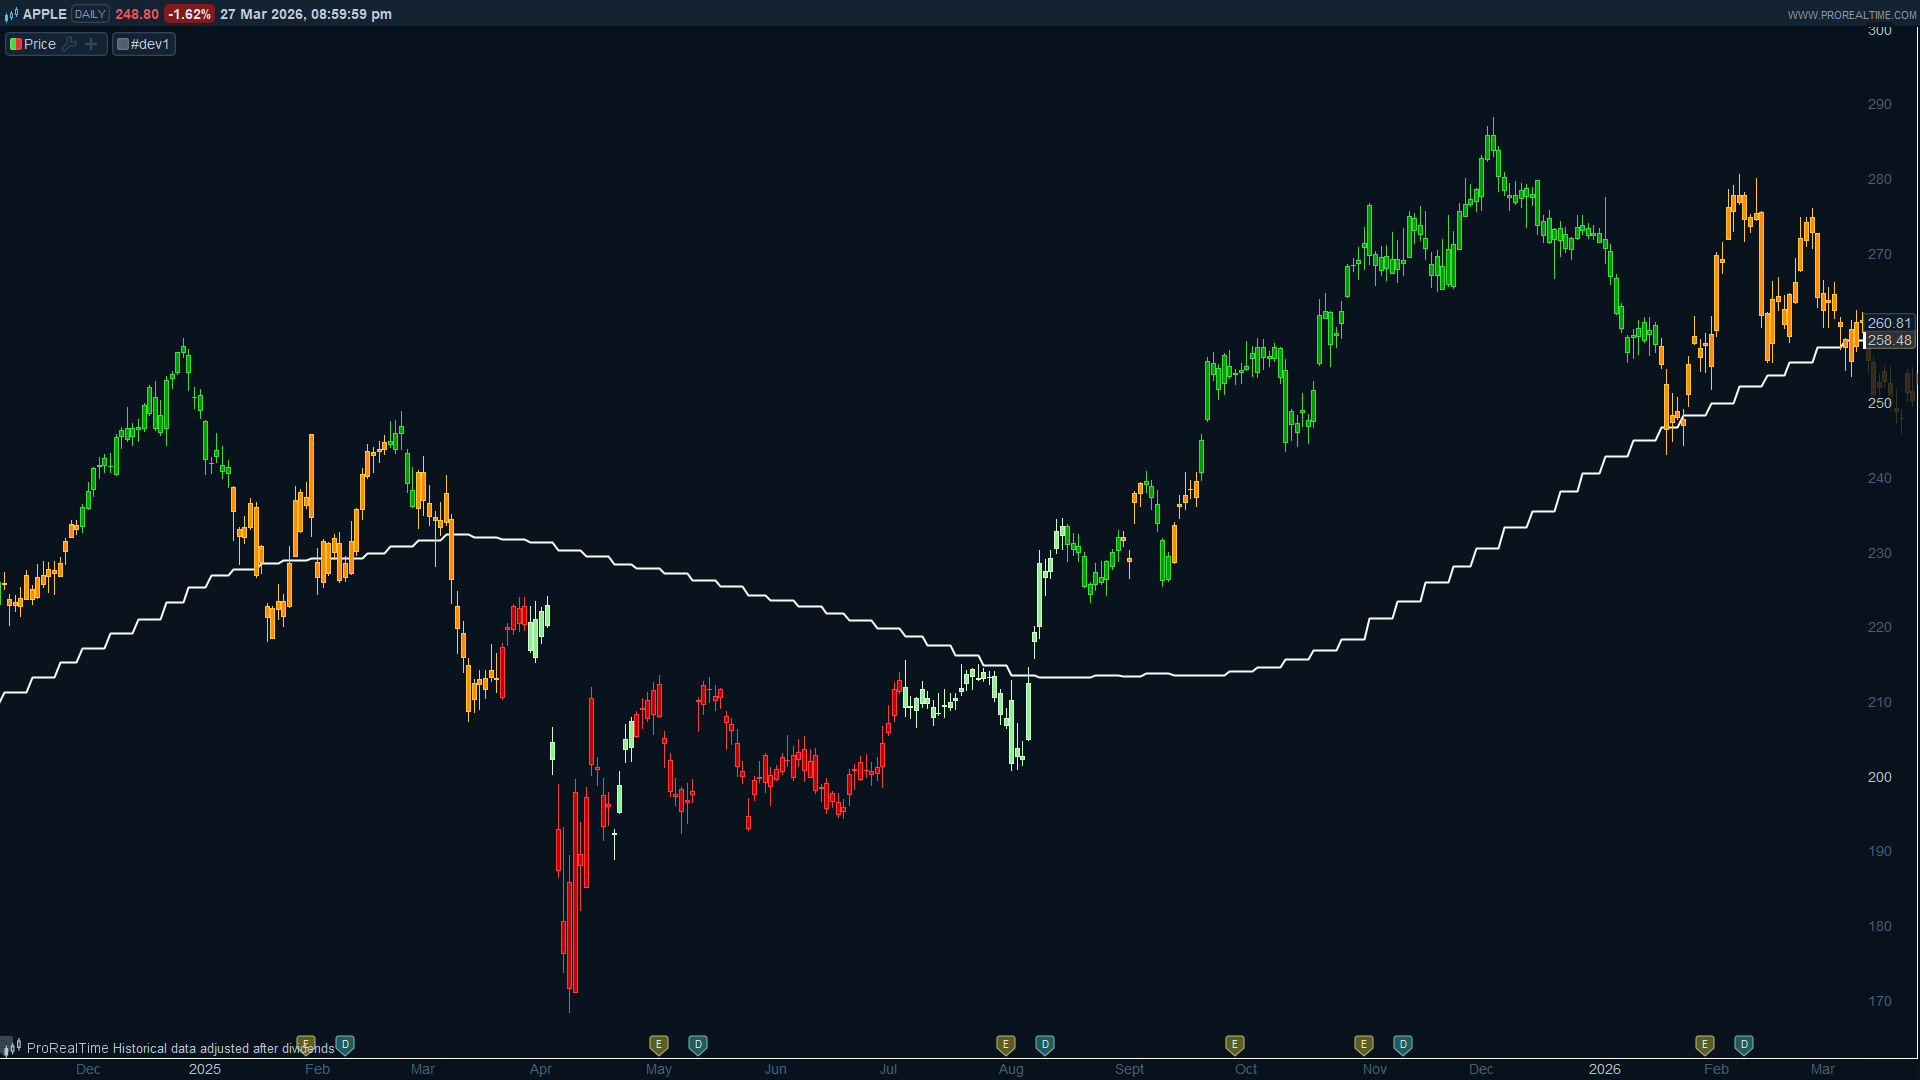
This indicator brings Stan Weinstein’s Stage Analysis methodology into ProRealTime using native ProBuilder code. It colors each candle on your chart according to the current Weinstein stage, calculated from weekly price data and a weekly simple moving average. The result is a quick visual read of where an instrument sits in its long-term market cycle, without having to switch to a weekly chart.
Stan Weinstein’s approach divides the market cycle into four stages. Stage 1 is the basing phase, where price moves sideways under or around the moving average after a downtrend. Stage 2 is the advancing phase, the classic breakout above the rising MA that signals a new uptrend. Stage 3 is the topping phase, where price starts to lose momentum near the MA after a prolonged rise. Stage 4 is the declining phase, where price breaks below the falling MA and enters a downtrend.
The indicator maps these stages to four colors on your candles:
- Light green for Stage 1 (basing)
- Green for Stage 2 (uptrend)
- Orange for Stage 3 (topping)
- Red for Stage 4 (downtrend)
A white line is also plotted directly on the price panel, showing the weekly SMA used for the calculation.
How the stage detection works: a Stage 2 trigger fires when the weekly candle body is entirely above the MA plus a configurable buffer, and the MA slope is rising. A Stage 4 trigger fires when the body is entirely below the MA minus the buffer, and the slope is falling. Between those triggers, the stage holds, meaning it transitions from Stage 2 to Stage 3 once the Stage 2 trigger is no longer active, and from Stage 4 to Stage 1 in the same way. This persistence logic is what gives the indicator its trend-following character.
The multi-timeframe data is handled with TIMEFRAME(Weekly, UpdateOnClose), which means the weekly values only update on completed weekly bars. This avoids repainting and keeps the signal stable throughout the trading week.
The indicator works on any intraday or daily timeframe, though it is most commonly used on a daily chart where the weekly context adds genuine value. On timeframes higher than weekly it will have no practical effect.
Two parameters can be adjusted from the ProRealTime variable editor:
- smaLength (default 30): the period of the weekly simple moving average. Weinstein himself used a 30-week MA, so this is kept as the default.
- withinRangePct (default 5): the percentage buffer around the MA. When the candle body falls within this zone, no stage transition is triggered. This prevents noisy transitions when price is hovering close to the average.
If you want to use a different moving average type, simply replace Average in the TIMEFRAME block with ExponentialAverage, HullMovingAverage, or any other ProBuilder MA function.
// Weinstein Stage Analysis for ProRealTime
// Converted from JavaScript indicator
// Works best on daily charts using weekly MA as reference
// https://www.prorealcode.com
// Nicolas @ ProRealCode

// --- Configurable parameters (editable via ProRealTime variable editor)
smaLength = 30
withinRangePct = 5

// --- Weekly data (computed on completed weekly bars only)
TIMEFRAME(Weekly, UpdateOnClose)
wOpen = open
wClose = close
wMA = Average[smaLength](close)
prevWMA = Average[smaLength](close)[1]

TIMEFRAME(default)
// Buffer zone around the weekly MA
withinRange = wMA * withinRangePct / 100

// Weekly candle body boundaries
wBodyLow = Min(wOpen, wClose)
wBodyHigh = Max(wOpen, wClose)

// Stage entry conditions (body position vs MA + MA slope)
stage2Trigger = wBodyLow > wMA + withinRange AND prevWMA < wMA
stage4Trigger = wBodyHigh < wMA - withinRange AND prevWMA > wMA

// Persistent stage state tracker (uses lookback [1] to keep previous state)
// 0 = undefined, 1 = basing, 2 = uptrend, 3 = topping, 4 = downtrend
IF stage2Trigger THEN
stageState = 2
ELSIF stage4Trigger THEN
stageState = 4
ELSIF stageState[1] = 2 OR stageState[1] = 3 THEN
stageState = 3
ELSIF stageState[1] = 4 OR stageState[1] = 1 THEN
stageState = 1
ELSE
stageState = 0
ENDIF

// Candle color based on Weinstein stage
IF stageState = 2 THEN
r = 0
g = 160
b = 0
ELSIF stageState = 3 THEN
r = 255
g = 140
b = 0
ELSIF stageState = 4 THEN
r = 200
g = 0
b = 0
ELSIF stageState = 1 THEN
r = 144
g = 238
b = 144
ELSE
r = 128
g = 128
b = 128
ENDIF

DRAWCANDLE(open, high, low, close) COLOURED(r, g, b)

// Plot the weekly MA on the price chart for reference
RETURN wMA AS "Weekly SMA" COLOURED(255, 255, 255) STYLE(Line, 2)