

Adaptive RSI with Automatic Divergences
The Adaptive RSI [by BOSWaves] is a high-performance evolution of the classic Relative Strength Index. While the traditional RSI relies on static levels (like 70 and 30) that often fail to account for varying market volatility, this version introduces dynamic, percentile-based thresholds and advanced smoothing techniques to provide a much clearer picture of market momentum.
How it works
This indicator transforms the standard RSI into a complete trend-following and reversal detection system through several key layers:
1. Advanced Smoothing
To eliminate “market noise,” the oscillator can be smoothed using eight different mathematical methods, including Hull Moving Average, DEMA, and TEMA. This ensures that the signals you receive are based on refined price action rather than erratic spikes.
2. Adaptive Thresholds
Instead of fixed overbought and oversold lines, this indicator uses a lookback period to calculate thresholds based on percentiles. This means the levels adjust automatically to the historical range of the RSI, making it effective in both ranging and trending markets.
3. Automatic Divergence Engine
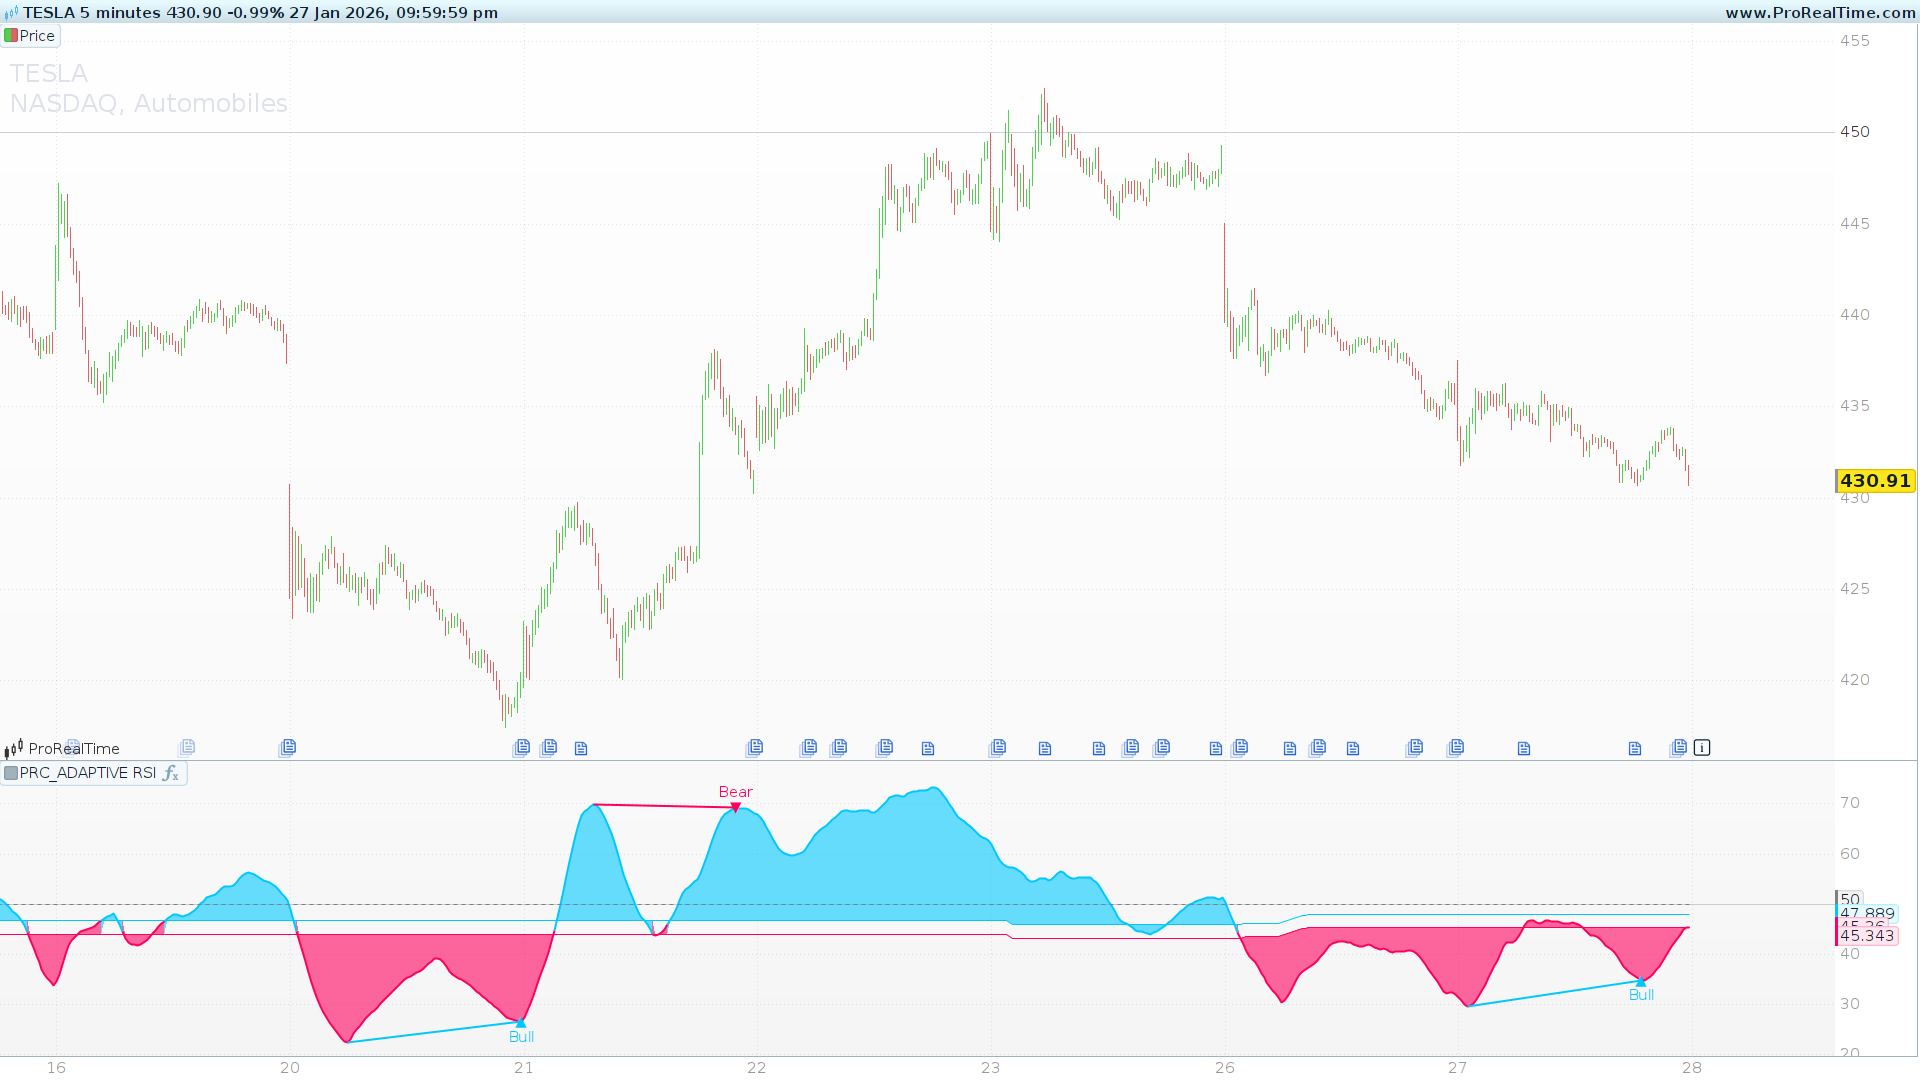
The code features an integrated detection system that identifies Bullish and Bearish divergences. Using pivot logic and arrays, it draws segments directly on the oscillator and labels them “Bull” or “Bear,” signaling potential trend exhaustion or reversals.
4. Market Regime Coloring
The indicator visually distinguishes between bullish and bearish states:
- Cyan/Blue Zone: Indicates a bullish regime where the RSI is holding above the upper adaptive threshold.
- Red/Pink Zone: Indicates a bearish regime where the RSI is falling below the lower adaptive threshold.
Configuration & Parameters
The Adaptive RSI is highly customizable to fit different trading styles (Scalping vs. Swing):
- rsiLength (Default: 18): The number of periods used for the base RSI calculation.
- adaptLookback (Default: 1000): The window used to determine the highest and lowest RSI values for the adaptive levels.
- useSmoothing (0/1): Toggle to enable or disable the smoothing of the RSI line.
- smoothType (0-11): Select the type of average (0=SMA, 1=EMA, 2=WMA,…,7=Hull, 10=DEMA, 11=TEMA).
- upperPercentile / lowerPercentile: Adjust these to tighten or loosen the “Regime” triggers.
- Divergence Settings (divLeft/divRight): Define the number of bars required to confirm a pivot high or low.
Practical Trading Tips
- Regime Changes: A change in the fill color (from Red to Cyan) often precedes a strong trend breakout.
- Divergence Confirmation: Look for a “Bull” divergence appearing when the RSI is in the oversold percentile (below 15, marked with ✦) for a high-probability reversal entry.
- Extreme Levels: The “✦” icons represent extreme historical conditions (>80 or <15), warning that the current move is significantly overextended.
Code
//-----------------------------------------
//PRC_ADAPTIVE RSI [BOSWaves]
//version = 1.0
//27.01.2026
//Iván González @ www.prorealcode.com
//-----------------------------------------
// --- INPUTS ---
//-----------------------------------------
rsiLength = 18
useSmoothing = 1
smoothLength = 20
smoothType = 0
adaptLookback = 1000
upperPercentile = 50
lowerPercentile = 45
divLeft = 15
divRight = 15
divRangeMin = 5
divRangeMax = 60
//-----------------------------------------
// --- OSCILADOR BASE ---
//-----------------------------------------
baseSrc = Average[4, 7](close)
oscRaw = RSI[rsiLength](baseSrc)
//-----------------------------------------
// --- SUAVIZADO ---
//-----------------------------------------
IF useSmoothing = 1 THEN
   IF smoothType = 0 THEN
      osc = Average[smoothLength](oscRaw)
   ELSIF smoothType = 1 THEN
      osc = ExponentialAverage[smoothLength](oscRaw)
   ELSIF smoothType = 2 THEN
      osc = WeightedAverage[smoothLength](oscRaw)
   ELSIF smoothType = 3 THEN
      osc = WilderAverage[smoothLength](oscRaw)
   ELSIF smoothType = 5 THEN
      osc = EndpointAverage[smoothLength](oscRaw)
   ELSIF smoothType = 7 THEN
      osc = HullAverage[smoothLength](oscRaw)
   ELSIF smoothType = 10 THEN
      // DEMA
      ema1DEMA = ExponentialAverage[smoothLength](oscRaw)
      ema2DEMA = ExponentialAverage[smoothLength](ema1DEMA)
      osc = 2 * ema1DEMA - ema2DEMA
   ELSIF smoothType = 11 THEN
      // TEMA
      ema1TEMA = ExponentialAverage[smoothLength](oscRaw)
      ema2TEMA = ExponentialAverage[smoothLength](ema1TEMA)
      ema3TEMA = ExponentialAverage[smoothLength](ema2TEMA)
      osc = 3 * ema1TEMA - 3 * ema2TEMA + ema3TEMA
   ELSE
      osc = Average[smoothLength](oscRaw)
   ENDIF
ELSE
   osc = oscRaw
ENDIF
//-----------------------------------------
// --- UMBRALES ADAPTATIVOS ---
//-----------------------------------------
rsiHighest = Highest[adaptLookback](osc)
rsiLowest = Lowest[adaptLookback](osc)
rsiRange = rsiHighest - rsiLowest
upperThr = rsiLowest + (rsiRange * upperPercentile / 100)
lowerThr = rsiLowest + (rsiRange * lowerPercentile / 100)
//-----------------------------------------
// --- RÉGIMEN ---
//-----------------------------------------
IF osc > upperThr THEN
   regimeState = 1
   osclevel=upperThr
ELSIF osc < lowerThr THEN
   regimeState = -1
   osclevel=lowerThr
ELSE
   regimeState = regimeState[1]
   osclevel = osclevel[1]
ENDIF

IF regimeState = 1 THEN
   rColor = 0
   gColor = 200
   bColor = 255
   acolor = 150
ELSIF regimeState = -1 THEN
   rColor = 255
   gColor = 0
   bColor = 93
   acolor = 150
ELSE
   rColor = 120
   gColor = 123
   bColor = 134
   acolor = 40
ENDIF
//-----------------------------------------
// --- DIVERGENCIAS CON ARRAYS ---
//-----------------------------------------
ONCE lastBearDivBar = 0
ONCE lastBullDivBar = 0
ONCE phCount = 0
ONCE plCount = 0
bullDiv = 0
bearDiv = 0

// Solo calcular si hay suficientes barras
IF BarIndex > (divLeft + divRight) THEN

   // --- PIVOT HIGH ---
   isPivotHigh = (osc[divRight] = Highest[divLeft + divRight + 1](osc))

   IF isPivotHigh THEN
      IF phCount < 20 THEN
         $phBars[phCount] = BarIndex - divRight
         $phVals[phCount] = osc[divRight]
         $phPrices[phCount] = High[divRight]
         phCount = phCount + 1
      ELSE
         // Shift Array
         FOR i = 0 TO 18 DO
            $phBars[i] = $phBars[i + 1]
            $phVals[i] = $phVals[i + 1]
            $phPrices[i] = $phPrices[i + 1]
         NEXT
         $phBars[19] = BarIndex - divRight
         $phVals[19] = osc[divRight]
         $phPrices[19] = High[divRight]
      ENDIF

      // Búsqueda de Divergencia Bearish
      IF phCount >= 2 THEN
         FOR j = (phCount - 2) DOWNTO Max(0, phCount - 6) DO
            barDiff = (BarIndex - divRight) - $phBars[j]
            IF barDiff >= divRangeMin AND barDiff <= divRangeMax THEN
               IF High[divRight] > $phPrices[j] AND osc[divRight] < $phVals[j] THEN
                  IF (BarIndex - divRight) - lastBearDivBar > (divLeft * 2) THEN
                     bearDiv = 1
                     lastBearDivBar = BarIndex - divRight
                     DRAWSEGMENT($phBars[j], $phVals[j], BarIndex - divRight, osc[divRight]) COLOURED(255, 0, 93) STYLE(line, 2)
                     DRAWTEXT("Bear", BarIndex - divRight, osc[divRight] + 3) COLOURED(255, 0, 93)
                     DRAWTEXT("▼", BarIndex - divRight, osc[divRight]) COLOURED(255, 0, 93)
                  ENDIF
               ENDIF
            ENDIF
         NEXT
      ENDIF
   ENDIF

   // --- PIVOT LOW ---
   isPivotLow = (osc[divRight] = Lowest[divLeft + divRight + 1](osc))

   IF isPivotLow THEN
      IF plCount < 20 THEN
         $plBars[plCount] = BarIndex - divRight
         $plVals[plCount] = osc[divRight]
         $plPrices[plCount] = Low[divRight]
         plCount = plCount + 1
      ELSE
         FOR i = 0 TO 18 DO
            $plBars[i] = $plBars[i + 1]
            $plVals[i] = $plVals[i + 1]
            $plPrices[i] = $plPrices[i + 1]
         NEXT
         $plBars[19] = BarIndex - divRight
         $plVals[19] = osc[divRight]
         $plPrices[19] = Low[divRight]
      ENDIF

      IF plCount >= 2 THEN
         FOR j = (plCount - 2) DOWNTO Max(0, plCount - 6) DO
            barDiff = (BarIndex - divRight) - $plBars[j]
            IF barDiff >= divRangeMin AND barDiff <= divRangeMax THEN
               IF Low[divRight] < $plPrices[j] AND osc[divRight] > $plVals[j] THEN
                  IF (BarIndex - divRight) - lastBullDivBar > (divLeft * 2) THEN
                     bullDiv = 1
                     lastBullDivBar = BarIndex - divRight
                     DRAWSEGMENT($plBars[j], $plVals[j], BarIndex - divRight, osc[divRight]) COLOURED(0, 200, 255) STYLE(line, 2)
                     DRAWTEXT("Bull", BarIndex - divRight, osc[divRight] - 3) COLOURED(0, 200, 255)
                     DRAWTEXT("▲", BarIndex - divRight, osc[divRight]) COLOURED(0, 200, 255)
                  ENDIF
               ENDIF
            ENDIF
         NEXT
      ENDIF
   ENDIF
ENDIF
//-----------------------------------------
// --- DECORACIÓN Y EXTREMOS ---
//-----------------------------------------
IF osc > 80 THEN
   DRAWTEXT("✦", BarIndex, osc) COLOURED(255, 0, 93)
ENDIF
IF osc < 15 THEN
   DRAWTEXT("✦", BarIndex, osc) COLOURED(0, 200, 255)
ENDIF
//-----------------------------------------
// --- COLOR ---
//-----------------------------------------
colorbetween(osc,osclevel,rColor,gColor,bColor,acolor)

//-----------------------------------------
RETURN osc COLOURED(rColor, gColor, bColor) STYLE(line, 2) AS "Adaptive RSI", upperThr COLOURED(0, 200, 255) AS "Upper Threshold"STYLE(line, 1), lowerThr COLOURED(255, 0, 93) AS "Lower Threshold"STYLE(line, 1), 50 COLOURED(128, 128, 128) STYLE(dottedline) AS "Midline"
