Chaikin Fisher Transform Divergence & Early Reversal
Introduction
The Chaikin Oscillator has one structural problem that has nothing to do with how good it is: it has no scale.
It is the difference between a fast and a slow moving average of the Accumulation/Distribution line, and the A/D line is a running sum of volume. So the oscillator reads in the tens of thousands on a liquid stock and in the single digits on a thin future. You cannot put an overbought level on it. You cannot compare today’s reading to last year’s. You cannot even say whether a value is large without looking at the chart first.
This indicator fixes that with Ehlers’ Fisher Transform, and then builds three layers of signal on top of the result: the turn, the divergence, and an early warning from the extremes.
Theory Behind the Indicator
1. The Chaikin Oscillator, briefly
Every bar gets a money flow multiplier: where the close landed inside the bar’s range, mapped to the interval from -1 to +1.
mfm = ((close - low) - (high - close)) / (high - low)
A close at the high gives +1, at the low gives -1, in the middle gives 0. Multiply by volume and you get the bar’s contribution; accumulate it from the first bar and you have the Accumulation/Distribution line.
adLine = cumsum(mfm · volume)
The oscillator is then the difference between a fast and a slow exponential average of that line — 3 and 10 by default:
cOsc = EMA(adLine, 3) - EMA(adLine, 10)
It measures whether accumulation is speeding up or slowing down, which is a genuinely different question from what a price oscillator asks. And because it is a difference of two averages of the same series, the arbitrary starting point of the accumulation cancels out exactly: loading more or less history does not change the reading.
What does not cancel out is the magnitude. That is the problem.
2. The Fisher Transform, and what it is actually for
Ehlers’ transform does two things at once, and it is worth separating them because most descriptions blur them together.
First it normalises: the oscillator is placed inside its own range over the last n bars, which makes the output dimensionless.
raw = (cOsc - lowest(cOsc, n)) / (highest(cOsc, n) - lowest(cOsc, n)) - 0.5
That already solves the scale problem. The second step is the interesting one.
fish = 0.5 · ln((1 + value) / (1 - value)) + 0.5 · fish[1]
That logarithm is the inverse hyperbolic tangent. It takes a series confined to the interval from -1 to +1 and stretches it to infinity at both ends, while leaving the middle almost untouched. A reading of 0.1 barely moves. A reading of 0.97 shoots off the top of the panel.
The practical consequence is the whole point of the indicator: a price or volume series has far more small moves than a normal distribution would predict, and far more huge ones. Squash that into a bounded range and the extremes pile up against the ceiling, indistinguishable from each other. The transform un-piles them. What was a rounded top becomes a spike, and a spike has a date on it — you can point at the bar.
Two details in the formula that look like typos and are not:
- The smoothing coefficients are
0.66and0.67. They sum to more than one. That is deliberate: it is what makes the transform lead rather than lag. Replace them with0.5and0.5and you have an ordinary exponential average that has lost the property you came for. - The value is clamped to the range -0.999 to +0.999 before the logarithm. This is not cosmetic. At exactly 1 the denominator
(1 - value)is zero and the logarithm diverges. The clamp is what keeps the indicator from blowing up on the first strong trend.
Because the output is dimensionless, fixed levels finally mean something. The defaults are +1.5 and -1.5, and they mean the same thing on a DAX future and on a small cap.
3. The turn, and an observation about it
The indicator plots the Fisher line against a trigger which is simply the Fisher line delayed by one bar. A crossover of the two therefore means exactly one thing: the Fisher line changed direction.
That is worth saying plainly, because the indicator also has a separate “curl” detector in its early reversal block, and the two look like independent confirmations on the chart. They are not. Expand the crossover:
crossover(fish, fish[1]) = fish[1] <= fish[2] and fish > fish[1]
and expand the curl:
curlUp = fish > fish[1] and fish[1] <= fish[2]
They are the same condition written in a different order. Checked bar by bar over 18,000 bars of simulated data, there is not one bar where they differ.
So a turn marker and an early reversal marker on the same bar are one signal, not two. What the early reversal block genuinely adds is not a second detector — it is the gate and the cooldown, which is section 4.
4. Divergence, anchored on the oscillator only
The divergence engine looks for pivots of the Fisher line — a bar that is lower (or higher) than the pivL bars before it and the pivR bars after it — and then reads the price at that same bar.
Note what it does not do: it does not require price to make a pivot of its own on the same bar. This matters more than it sounds. An oscillator turns before or after price far more often than it turns with it; demanding both extremes on the same bar throws away most of the candidates at each end of the comparison, and the signal count collapses to a handful per decade. Anchoring on the oscillator and simply reading price where the oscillator turned is the right way round, and this indicator gets it right.
Four types come out of comparing each new pivot against the previous one:
- Regular bullish — price makes a lower low, the Fisher makes a higher low. Selling pressure is not confirming the new low. Reversal.
- Regular bearish — price makes a higher high, the Fisher makes a lower high. Reversal.
- Hidden bullish — price makes a higher low, the Fisher makes a lower low. The pullback is exhausted. Continuation.
- Hidden bearish — price makes a lower high, the Fisher makes a higher high. Continuation.
Regular divergences argue against the current move; hidden divergences argue for it. They are not interchangeable and should not be read as “a divergence appeared”.
A distance cap (maxPivBars, 60 by default) refuses to connect two pivots that are too far apart. Two lows separated by four hundred bars are two different regimes, not a divergence, and without the cap the panel fills with lines that cross the whole screen.
5. Early reversal: the same turn, with a gate and a cooldown
earlyBull = turnUp and fish[1] <= oversoldLevel and (bars since last signal) >= cooldown
Two conditions on top of the turn.
The gate reads fish[1], not fish. The bar that turns up has to be coming from the oversold zone — it does not have to still be in it. That is what makes the signal early: it fires on the first bar of the turn, not after the line has climbed back through the level.
The cooldown suppresses a second signal on the same side within cooldownB bars. In practice it removes less than you would expect — the Fisher line is smoothed twice, so two turns inside the extreme zone within five bars are rare. If you want it to actually filter, it needs to be set a good deal higher than the default of 5.
How to Read It
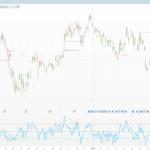
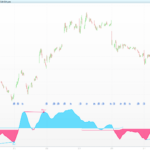
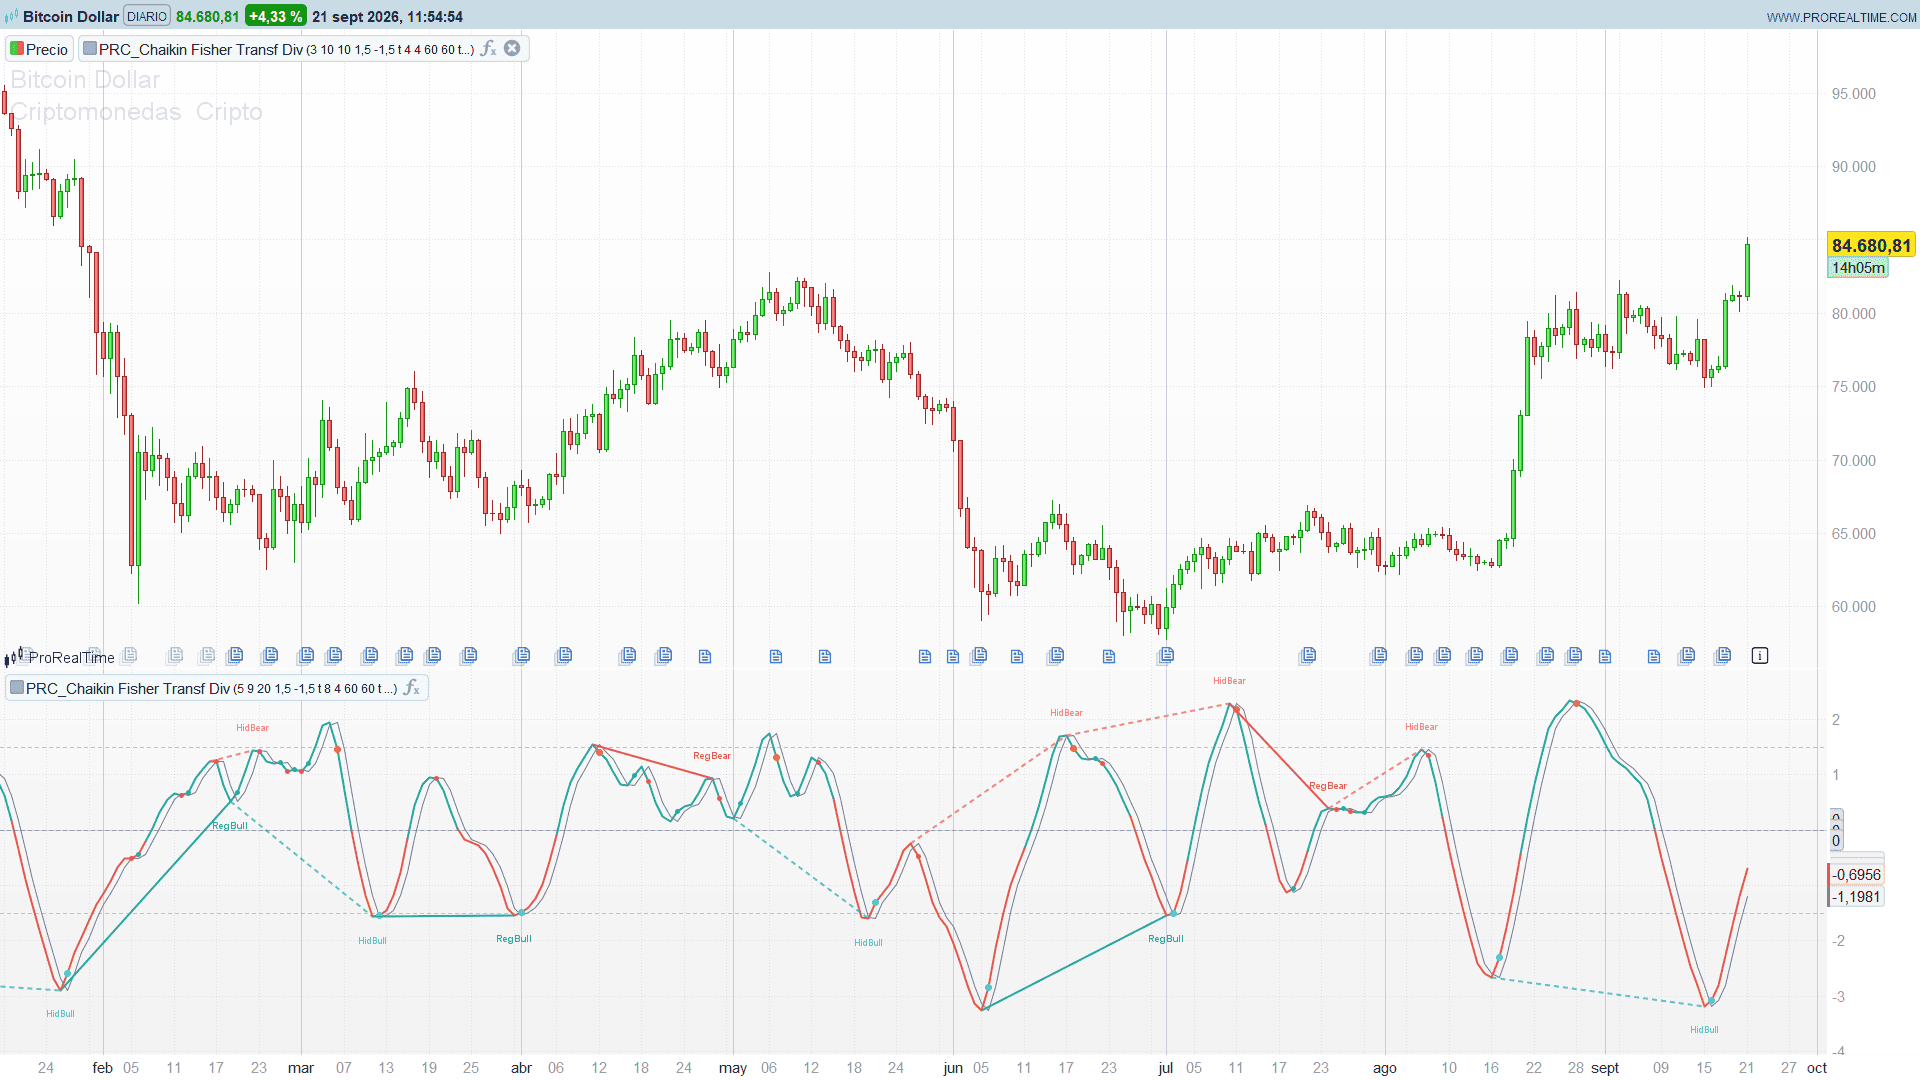
The panel carries the Fisher line coloured by sign, its one-bar trigger in grey, and three levels: zero, overbought and oversold.
The dots on the line mark turns. Green for a turn up, red for a turn down. They are frequent by design — this is a direction-change detector, not a trade signal — and their job is to make the rhythm of the oscillator visible.
The large cyan and orange dots are the early reversals: a turn that came out of the extreme zone. Cyan for bullish, orange for bearish. These are the ones worth looking at.
The solid lines with labels are regular divergences, the dotted ones are hidden divergences. RegBull and HidBull sit under the low they mark; RegBear and HidBear sit above the high.
One thing to be honest about, because it decides whether the defaults work for you. With pivL and pivR at 4, the Fisher line produces a pivot roughly every 9 bars, and about half of all pivots produce a divergence label. That is not an accident of the implementation, it is arithmetic: at each new pivot, price either made a lower low or a higher low, and in each case one of the two divergence tests can fire. Two of the four sign combinations produce a signal.
Measured over 12 independent simulated series of 1,500 bars each, with the default settings:
- a Fisher pivot every 8.6 bars
- a divergence every 17 bars
- a turn every 12.3 bars
- an early reversal every 29 bars after the cooldown
On a daily chart that is around fifteen divergences a year, which is workable. On a 5-minute chart it is a label every hour and a half and the panel saturates. If you take this down to intraday timeframes, raise pivL and pivR. That single setting is what controls the density, and the distance cap should go up with it.
Settings
Fast Length (3) and Slow Length (10) — the two exponential averages of the Accumulation/Distribution line. The classic Chaikin pair. Widening the gap makes the oscillator slower and the Fisher line smoother.
Fisher Normalization Length (10) — the lookback the oscillator is measured against. This is the parameter that sets how local the reading is. At 10 the line is comparing the oscillator to the last two weeks on a daily chart, so it reaches its extremes often. Raise it to 30 or 50 and the extremes become rarer and more meaningful.
Overbought / Oversold (+1.5 / -1.5) — the gate for the early reversal signals. Because the output is dimensionless these values carry across instruments, which is the whole reason for the transform.
Pivot Left Bars / Pivot Right Bars (4 / 4) — the pivot window. pivR is also the delay: a divergence cannot be confirmed until pivR bars have closed after the pivot. This is the density control described above.
Max Bars Between Pivots (60) — the distance cap on a divergence.
Max Divergences On Chart (60) — how many past divergence lines stay drawn.
Show Early Reversal Signals (1) and Signal Cooldown (5) — arm the early warning and set the minimum spacing between two signals on the same side.
A note on volume
The indicator is built on the Accumulation/Distribution line, so it needs a volume feed. On an instrument that does not supply volume the A/D line is flat, the oscillator sits at zero and the Fisher line is a straight line on the zero level. The code prints a warning on the last bar when it detects that case, so that an empty panel does not get read as a broken indicator.
Spot forex is the usual offender. Futures and stocks are fine; on forex, use a futures contract or a broker feed that reports tick volume.
Alerts
ProBuilder alerts read the series returned by the indicator, not what it draws. A divergence line is a drawing, so it cannot be alerted on directly — the signals travel instead in three invisible series (they are in the return with zero opacity, which does not stop the alert builder from listing them).
Sig Regularcrossing over 0.5 — regular bullish divergenceSig Regularcrossing under -0.5 — regular bearish divergenceSig Hiddencrossing over 0.5 — hidden bullish divergenceSig Hiddencrossing under -0.5 — hidden bearish divergenceSig Earlycrossing over 0.5 — early bullish reversalSig Earlycrossing under -0.5 — early bearish reversal
For the turn itself no extra series is needed: Fisher crossing Trigger is exactly that condition, and both curves are on the panel.
A note on timing
The divergence engine runs on closed bars only. A pivot detector with a right-hand window reads the live candle through that window, which means a pivot can appear on one tick and be gone on the next — and with it the divergence line. To avoid that, the whole detection window is shifted one bar back, so nothing the engine reads can still change.
The cost is one extra bar of delay: a divergence appears pivR + 1 bars after the pivot instead of pivR. No signals are lost — they are the same signals, one bar later. In exchange, a line that has been drawn stays drawn.
The turn and early reversal markers are not shifted: those fire on the live bar, as intended.
ProBuilder Code
//----------------------------------------------
//PRC_Chaikin Fisher Transform Divergence
//version = 0
//14.09.2026
//Ivan Gonzalez @ www.prorealcode.com
//Author: mehmetbezgincan
//Sharing ProRealTime knowledge
//----------------------------------------------
DEFPARAM drawonlastbaronly = true
//----------------------------------------------
// --- Chaikin oscillator ---
//----------------------------------------------
shortLen   = 3      // Fast EMA of the A/D line
longLen    = 10     // Slow EMA of the A/D line
//----------------------------------------------
// --- Fisher transform ---
//----------------------------------------------
fishLen    = 10     // Normalisation lookback
obLevel    = 1.5    // Overbought level
osLevel    = 0 - 1.5  // Oversold level
//----------------------------------------------
// --- Divergence ---
//----------------------------------------------
showDiv    = 1      // 1 = draw the divergence lines and their labels
pivL       = 4      // Pivot left bars
pivR       = 4      // Pivot right bars
maxPivBars = 60     // Maximum distance between the two pivots, in bars
maxDivs    = 60     // How many past divergences stay on the chart
//----------------------------------------------
// --- Early reversal ---
//----------------------------------------------
showEarly  = 1      // 1 = arm the early reversal signal
cooldownB  = 5      // Minimum bars between two signals on the same side
//----------------------------------------------
// --- Colours ---
//----------------------------------------------
bullR = 38      // #26A69A teal
bullG = 166
bullB = 154
bearR = 239     // #EF5350 red
bearG = 83
bearB = 80
neutR = 120     // #787B86 grey
neutG = 123
neutB = 134
erlBuR = 0      // #00E5FF cyan, early bullish reversal
erlBuG = 229
erlBuB = 255
erlBeR = 255    // #FF6D00 orange, early bearish reversal
erlBeG = 109
erlBeB = 0
//----------------------------------------------
//=== 1. ACCUMULATION / DISTRIBUTION LINE ===

IF volume <> undefined THEN
   volOk = volume
ELSE
   volOk = 0
ENDIF

IF high > low THEN
   mfv = (2 * close - low - high) / (high - low) * volOk
ELSE
   mfv = 0
ENDIF
adLine = cumsum(mfv)
totVol = cumsum(volOk)
//----------------------------------------------
//=== 2. CHAIKIN OSCILLATOR ===
//----------------------------------------------
cOsc = average[shortLen,1](adLine) - average[longLen,1](adLine)
//----------------------------------------------
//=== 3. FISHER TRANSFORM OF THE OSCILLATOR ===
//----------------------------------------------
oscHi = highest[fishLen](cOsc)
oscLo = lowest[fishLen](cOsc)
rng   = oscHi - oscLo

warmFish = longLen + fishLen

fishOk = 0
IF barindex > warmFish AND cOsc <> undefined AND rng <> undefined THEN
   fishOk = 1
ENDIF

IF fishOk = 1 AND rng > 0 THEN
   rawVal = (cOsc - oscLo) / rng - 0.5
ELSE
   rawVal = 0
ENDIF

IF fishOk = 1 THEN
   v1     = 0.66 * rawVal + 0.67 * value1[1]
   value1 = max(min(v1, 0.999), 0 - 0.999)
   fish   = 0.5 * log((1 + value1) / (1 - value1)) + 0.5 * fish[1]
ELSE
   value1 = 0
   fish   = 0
ENDIF

trigLine = fish[1]
//----------------------------------------------
//=== 4. TURN DETECTION ===
//----------------------------------------------
turnUp = fish > fish[1] AND fish[1] <= fish[2]
turnDn = fish < fish[1] AND fish[1] >= fish[2]
//----------------------------------------------
//=== 5. EARLY REVERSAL WITH COOLDOWN ===
//----------------------------------------------
earlyOn = showEarly = 1

IF barindex = 0 THEN
   lastBuBar = 0 - 100000
   lastBeBar = 0 - 100000
ELSE
   lastBuBar = lastBuBar[1]
   lastBeBar = lastBeBar[1]
ENDIF

earlyBull = 0
earlyBear = 0

IF earlyOn AND fish[1] <= osLevel AND turnUp AND (barindex - lastBuBar) >= cooldownB THEN
   earlyBull = 1
   lastBuBar = barindex
ENDIF

IF earlyOn AND fish[1] >= obLevel AND turnDn AND (barindex - lastBeBar) >= cooldownB THEN
   earlyBear = 1
   lastBeBar = barindex
ENDIF
//----------------------------------------------
//=== 6. FISHER PIVOTS - CLOSED BAR ENGINE ===
//----------------------------------------------
pOff    = pivR + 1
fishPiv = fish[pOff]
pivBar  = barindex - pOff
pxLow   = low[pOff]
pxHigh  = high[pOff]

// The pivR closed bars AFTER the pivot: offsets 1 .. pivR
loRight = lowest[pivR](fish)[1]
hiRight = highest[pivR](fish)[1]
// The pivL bars BEFORE the pivot: offsets pivR+2 .. pivR+pivL+1
loLeft  = lowest[pivL](fish)[pivR + 2]
hiLeft  = highest[pivL](fish)[pivR + 2]

warmBars = warmFish + fishLen + pivL + pivR + 4

isPivLo = 0
isPivHi = 0
IF barindex > warmBars THEN
   IF fishPiv < loRight AND fishPiv < loLeft THEN
      isPivLo = 1
   ENDIF
   IF fishPiv > hiRight AND fishPiv > hiLeft THEN
      isPivHi = 1
   ENDIF
ENDIF
//----------------------------------------------
//=== 7. DIVERGENCE DETECTION ===
// Regular = reversal (price and oscillator disagree on the extreme).
// Hidden  = continuation (they disagree on the retracement).
//----------------------------------------------
divRing = maxDivs + 1

IF barindex = 0 THEN
   prvLoVal = 0
   prvLoBar = 0 - 1
   prvLoPx  = 0
   prvHiVal = 0
   prvHiBar = 0 - 1
   prvHiPx  = 0
   nDiv     = 0
ELSE
   prvLoVal = prvLoVal[1]
   prvLoBar = prvLoBar[1]
   prvLoPx  = prvLoPx[1]
   prvHiVal = prvHiVal[1]
   prvHiBar = prvHiBar[1]
   prvHiPx  = prvHiPx[1]
   nDiv     = nDiv[1]
ENDIF

regBull = 0
hidBull = 0
regBear = 0
hidBear = 0

IF isPivLo = 1 THEN
   IF prvLoBar >= 0 AND (pivBar - prvLoBar) <= maxPivBars THEN
      // Regular bullish: price lower low, Fisher higher low
      IF pxLow < prvLoPx AND fishPiv > prvLoVal THEN
         regBull = 1
      ENDIF
      // Hidden bullish: price higher low, Fisher lower low
      IF pxLow > prvLoPx AND fishPiv < prvLoVal THEN
         hidBull = 1
      ENDIF
   ENDIF

   IF showDiv = 1 AND (regBull = 1 OR hidBull = 1) THEN
      slD = nDiv MOD divRing
      $dvX1[slD] = prvLoBar
      $dvY1[slD] = prvLoVal
      $dvX2[slD] = pivBar
      $dvY2[slD] = fishPiv
      IF regBull = 1 THEN
         $dvTy[slD] = 1
      ELSE
         $dvTy[slD] = 2
      ENDIF
      nDiv = nDiv + 1
   ENDIF

   prvLoVal = fishPiv
   prvLoBar = pivBar
   prvLoPx  = pxLow
ENDIF

IF isPivHi = 1 THEN
   IF prvHiBar >= 0 AND (pivBar - prvHiBar) <= maxPivBars THEN
      // Regular bearish: price higher high, Fisher lower high
      IF pxHigh > prvHiPx AND fishPiv < prvHiVal THEN
         regBear = 1
      ENDIF
      // Hidden bearish: price lower high, Fisher higher high
      IF pxHigh < prvHiPx AND fishPiv > prvHiVal THEN
         hidBear = 1
      ENDIF
   ENDIF

   IF showDiv = 1 AND (regBear = 1 OR hidBear = 1) THEN
      slD = nDiv MOD divRing
      $dvX1[slD] = prvHiBar
      $dvY1[slD] = prvHiVal
      $dvX2[slD] = pivBar
      $dvY2[slD] = fishPiv
      IF regBear = 1 THEN
         $dvTy[slD] = 0 - 1
      ELSE
         $dvTy[slD] = 0 - 2
      ENDIF
      nDiv = nDiv + 1
   ENDIF

   prvHiVal = fishPiv
   prvHiBar = pivBar
   prvHiPx  = pxHigh
ENDIF
//----------------------------------------------
//=== 8. COLOURS FOR THE RETURNED SERIES ===
//----------------------------------------------
IF fish >= 0 THEN
   fisR = bullR
   fisG = bullG
   fisB = bullB
ELSE
   fisR = bearR
   fisG = bearG
   fisB = bearB
ENDIF

turnDot = fish
IF turnUp THEN
   trnR = bullR
   trnG = bullG
   trnB = bullB
   trnA = 255
ELSIF turnDn THEN
   trnR = bearR
   trnG = bearG
   trnB = bearB
   trnA = 255
ELSE
   trnR = neutR
   trnG = neutG
   trnB = neutB
   trnA = 0
ENDIF

erlDot = fish
IF earlyBull = 1 THEN
   erlR = erlBuR
   erlG = erlBuG
   erlB = erlBuB
   erlA = 255
ELSIF earlyBear = 1 THEN
   erlR = erlBeR
   erlG = erlBeG
   erlB = erlBeB
   erlA = 255
ELSE
   erlR = neutR
   erlG = neutG
   erlB = neutB
   erlA = 0
ENDIF

sigRegular = 0
sigHidden  = 0
sigEarly   = 0

IF regBull = 1 THEN
   sigRegular = 1
ELSIF regBear = 1 THEN
   sigRegular = 0 - 1
ENDIF

IF hidBull = 1 THEN
   sigHidden = 1
ELSIF hidBear = 1 THEN
   sigHidden = 0 - 1
ENDIF

IF earlyBull = 1 THEN
   sigEarly = 1
ELSIF earlyBear = 1 THEN
   sigEarly = 0 - 1
ENDIF
//----------------------------------------------
//=== 9. DRAWING ===
//----------------------------------------------
IF islastbarupdate THEN

   DRAWHLINE(0) COLOURED(neutR, neutG, neutB, 160) STYLE(dottedline)
   DRAWHLINE(obLevel) COLOURED(bearR, bearG, bearB, 120) STYLE(dottedline)
   DRAWHLINE(osLevel) COLOURED(bullR, bullG, bullB, 120) STYLE(dottedline)

   IF totVol = 0 THEN
      DRAWTEXT("No volume on this instrument: the Chaikin oscillator cannot be computed", barindex - 40, obLevel, dialog, bold, 11) COLOURED(bearR, bearG, bearB, 255)
   ENDIF

   dCnt = min(nDiv, maxDivs)
   // Labels are centred on their anchor, so they are pushed clear of the pivot
   labOff = (obLevel - osLevel) * 0.14

   IF showDiv = 1 AND dCnt > 0 THEN
      FOR q = 0 TO dCnt - 1 DO
         slD = (nDiv - dCnt + q) MOD divRing
         dTy = $dvTy[slD]
         dX1 = $dvX1[slD]
         dY1 = $dvY1[slD]
         dX2 = $dvX2[slD]
         dY2 = $dvY2[slD]

         IF dTy = 1 THEN
            DRAWSEGMENT(dX1, dY1, dX2, dY2) COLOURED(bullR, bullG, bullB, 255) STYLE(line, 2)
            DRAWTEXT("RegBull", dX2, dY2 - labOff, dialog, bold, 9) COLOURED(bullR, bullG, bullB, 255)
         ELSIF dTy = 2 THEN
            DRAWSEGMENT(dX1, dY1, dX2, dY2) COLOURED(bullR, bullG, bullB, 178) STYLE(dottedline, 2)
            DRAWTEXT("HidBull", dX2, dY2 - labOff, dialog, standard, 9) COLOURED(bullR, bullG, bullB, 178)
         ELSIF dTy = 0 - 1 THEN
            DRAWSEGMENT(dX1, dY1, dX2, dY2) COLOURED(bearR, bearG, bearB, 255) STYLE(line, 2)
            DRAWTEXT("RegBear", dX2, dY2 + labOff, dialog, bold, 9) COLOURED(bearR, bearG, bearB, 255)
         ELSE
            DRAWSEGMENT(dX1, dY1, dX2, dY2) COLOURED(bearR, bearG, bearB, 178) STYLE(dottedline, 2)
            DRAWTEXT("HidBear", dX2, dY2 + labOff, dialog, standard, 9) COLOURED(bearR, bearG, bearB, 178)
         ENDIF
      NEXT
   ENDIF

ENDIF

//----------------------------------------------
RETURN fish COLOURED(fisR, fisG, fisB, 255) STYLE(line, 2) AS "Fisher", trigLine COLOURED(neutR, neutG, neutB, 255) STYLE(line, 1) AS "Trigger", turnDot COLOURED(trnR, trnG, trnB, trnA) STYLE(point, 2) AS "Fisher Turn", erlDot COLOURED(erlR, erlG, erlB, erlA) STYLE(point, 5) AS "Early Reversal", sigRegular COLOURED(0, 0, 0, 0) STYLE(line, 1) AS "Sig Regular", sigHidden COLOURED(0, 0, 0, 0) STYLE(line, 1) AS "Sig Hidden", sigEarly COLOURED(0, 0, 0, 0) STYLE(line, 1) AS "Sig Early"
Closing
The Chaikin Oscillator is a good idea wearing a bad coat: it asks a real question about whether accumulation is accelerating, and then answers it in units nobody can interpret. The Fisher Transform is the right tool for that particular problem — not because it smooths, but because it turns rounded extremes into dated spikes and hands you a scale that travels between instruments.
The divergence engine on top is worth having for one specific reason: it anchors on the oscillator’s pivot and reads price there, rather than demanding both turn on the same bar. That is the difference between an indicator that fires fifteen times a year and one that fires twice a decade.
Be deliberate with the pivot window. At the default of 4 bars a side, roughly half of the oscillator’s pivots produce a divergence label, which is fine on a daily chart and too much intraday. It is one setting, and it is the one that decides whether the panel is readable.