







CCI Divergence Volume Breakout
Introduction
Most divergence indicators stop where the interesting part begins. They find the divergence, draw the line, print an arrow, and leave you to decide what to do with it. The arrow lands on the bar where the oscillator turned, which is rarely the bar where price turns, and the trader is left holding a signal with no level, no invalidation and no timing.
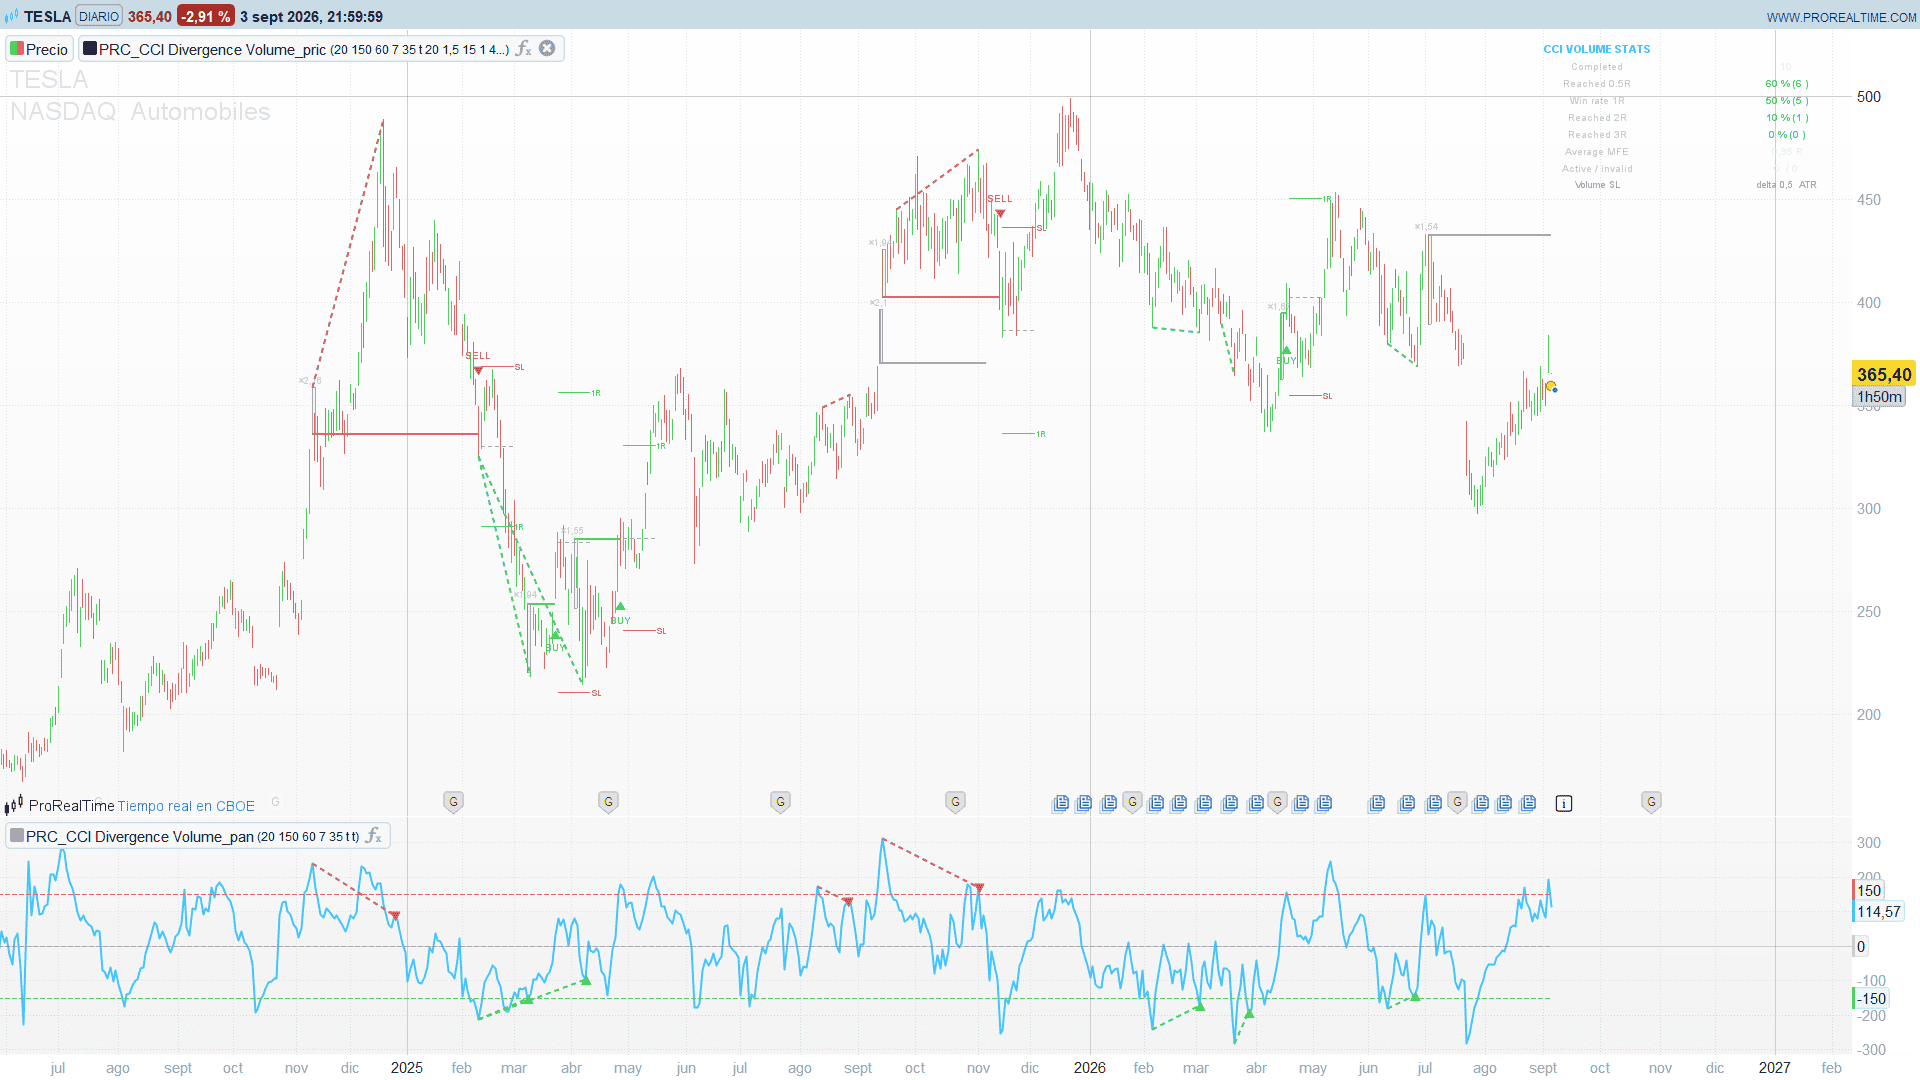
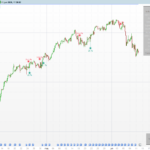
CCI Divergence Volume Breakout by josseliani does something different. The divergence is not the signal — it is the permission to start looking. Once a divergence is confirmed, the indicator opens a finite search for a candle that traded significantly more than its recent average. The extreme of that candle becomes a horizontal level, and the actual BUY or SELL only appears when a candle closes beyond it, inside a window that expires.
That separation is the whole idea, and it is worth stating plainly because it is what makes the indicator usable: finding the candidate, authorising the breakout and extending the line on screen are three different things with three different clocks.
This article covers how the engine works, how it is built, and where its weak points are.
Theory Behind the Indicator
1. The divergence: anchored on the oscillator, matched on price
The CCI is computed on typical price with a period of 20. Pivots are scanned on it at four strengths at once — 3, 5, 7 and 9 bars on each side — so a sharp turn and a broad one are both eligible without the user having to pick a sensitivity.
The rule for arming is asymmetric on purpose:
- The first pivot must be beyond the extreme level (±150 by default). This is the exhaustion leg.
- The second pivot can be anywhere. It only has to be less extreme than the first: a higher low on the CCI for a bullish case, a lower high for a bearish one.
- If the CCI travels into the opposite extreme in between, the armed state is dropped. Crossing the zero area is fine; crossing to the other side means a new momentum cycle started and the old low is no longer the same story.
Then comes the part most divergence tools skip. A CCI pivot is not a price pivot. The oscillator usually turns a few bars before or after the price extreme it is supposed to represent, so comparing the price at the bar of the CCI pivot compares the wrong candle. This indicator searches, within a radius of 7 bars around each CCI pivot, for the price high or low that actually belongs to that swing, and it accepts the pair only if three conditions hold:
- The price side moves in the right direction: a lower low against a higher CCI low, or a higher high against a lower CCI high.
- The two swings measure roughly the same: the distance between the two price pivots and the distance between the two CCI pivots may differ by at most 35 %. This is what stops the indicator from joining a price low with a CCI low that belongs to a completely different move.
- There is no deeper extreme in between. If a lower low exists between the two points, the second point is not the low of the swing and the divergence is not real.
Among all valid combinations it keeps the one with the best score, which rewards being close to the CCI pivot and rewards the two spans matching. A duplicate filter then discards any divergence whose two price pivots are within 5 bars of one already recorded, so a single swing detected at three different pivot strengths produces one line, not three.
2. The volume map: the level comes from a candle, not from a pivot
A confirmed divergence opens a setup. The indicator immediately scans for a candle that traded at least 1.5 times its 20-bar average volume, first between the two CCI pivots, and — only if it found nothing there — in a window of 9 bars around the second pivot. Among the qualifying candles it takes the one with the highest volume, not the first.
If nothing qualifies, the setup stays open for another 15 bars and any candle that spikes in volume during that window becomes the level instead.
Two things are worth noticing here:
- Candle colour is ignored. What matters is that size traded, not who won the bar. A high-volume bar that closes in the middle is exactly the kind of candle where the transfer happens.
- The level is the extreme of that candle: its high for a bullish setup, its low for a bearish one. Not the close, not the midpoint. To trade it you have to take out the whole candle.
3. The signal: a close, inside a window that expires
The level is drawn grey and does nothing until price closes beyond it. A wick through the level is not a signal.
The important design decision is that the level has an expiry. It can fire for 40 bars from the moment it was created, and then it is done. It is not re-armed by a new day, a new session or a new divergence. If “Keep Expired Levels Visible” is on, the line stays on the chart in grey as a visual reference and stops when a newer qualified volume level replaces it — but it cannot produce a late signal.
This is the part I would highlight to anyone who has been burned by level-based tools: an old level that keeps triggering months later is not a level, it is a coincidence generator. The expiry is not a limitation here, it is the point.
4. The optional trade map and what the statistics actually mean
When the markup is enabled, every signal is opened at the open of the following candle, and the stop goes behind the opposite edge of the exact volume candle whose level produced the signal — below its low for a long, above its high for a short — plus an optional ATR cushion. Risk is the distance from that entry to that stop, and 1R is projected from it.
The dashboard then counts, over the visible history, how many of those signals reached 0.5R, 1R, 2R and 3R before either hitting their stop or running out of evaluation window. When a stop and a target both fall inside the same historical candle, the stop wins, because the order inside a candle is unknown.
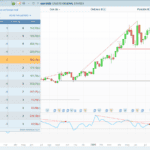
Read the numbers for what they are. This is a reach-rate counter, not a backtest: there is no position sizing, no costs, no partial exits, and “reached 1R” does not mean a trade that made 1R — it means price touched that level at some point before the stop. It is useful to compare instruments and timeframes, and to notice when a setup stops working. It does not predict anything.
The Code
The indicator draws on the price chart and plots an oscillator, and a ProBuilder indicator can only draw inside its own window. So it comes in two parts: apply the first one on the price chart and the second one in a separate window. Both use the same divergence detector, so the two windows always tell the same story.
Two engineering notes that matter if you plan to modify the code:
- The engine advances once per closed candle. Every read is fed from the last closed bar, so nothing flickers inside the live candle and nothing is registered twice when the market is open. The cost is that the map is one bar behind: it updates on the close of each candle, not tick by tick. That is deliberate.
- A drawing cannot be edited once it is on the chart. Every level, box, badge and trade line is stored in a ring buffer and the whole map is repainted on the last bar, so a growing level and a frozen history can coexist without the two fighting each other.
Part 1 — Price map (apply on the price chart)
//----------------------------------------------
//PRC_CCI Divergence Volume Breakout by josseliani
//version = 1
//03.09.2026
//Ivan Gonzalez @ www.prorealcode.com
//Concept and design: josseliani - MPL 2.0
//Sharing ProRealTime knowledge
//----------------------------------------------
// PART 1 of 2 - PRICE MAP. Apply this one ON THE PRICE CHART.
// Part 2 ("CCI panel") plots the oscillator and its divergence lines.
//
// A confirmed CCI divergence opens a finite search for a high relative volume
// candle. The extreme of that candle becomes a level: high for a bullish
// setup, low for a bearish one. The level only fires after a CLOSE beyond it,
// and only inside its own signal window. An expired level may stay on the
// chart as a grey reference, but it can no longer produce a signal.
//
// Engine notes
// - The whole engine is fed with the LAST CLOSED bar, exactly like the
// barstate.isconfirmed block of the original. Nothing flickers intrabar.
// - Persistent state lives in arrays, and the engine is allowed to advance
// only once per bar: arrays are not rewound between ticks, scalars are.
// - A drawing cannot be edited once it is on the chart. Every object is
// stored in a ring buffer and the whole map is repainted on the last bar.
//----------------------------------------------
defparam drawonlastbaronly = true
// === 1. CCI AND DIVERGENCE ===
cciLength = 20 // CCI period
extremeLevel = 150 // only the FIRST pivot must be beyond this level
maxDivBars = 60 // maximum bars between the two CCI pivots
pivotRadius = 7 // bars searched on each side of a CCI pivot for the price pivot
spanTolPct = 35 // maximum price/CCI span difference, in percent
showPriceLines = 1 // 1 = draw the divergence line on the price
// === 2. VOLUME MAP ===
volAvgLength = 20 // volume average period
minVolMult = 1.5 // minimum volume / average ratio
searchBars = 15 // bars after the divergence that may supply a volume candle
maxCandidates = 1 // volume levels created per divergence
maxSetupBars = 40 // bars a level may fire, counted from its creation
extendExpired = 1 // 1 = an unbroken expired level stays as a grey reference
showVolBoxes = 1 // 1 = outline the selected volume candle
// === 3. TRADE MAP AND STATISTICS ===
showTradeMap = 1 // 1 = draw entry / SL / 1R of every sampled signal
stopDeltaAtr = 0.5 // extra room beyond the volume candle, in ATR
evalBars = 60 // maximum evaluation window of a sampled signal
projBars = 12 // length of the trade drawing, in bars
firstPerDiv = 0 // 0 = every signal is sampled, 1 = only the first per divergence
showStats = 1 // 1 = statistics panel
// === 4. STYLE ===
badgeAtr = 1.25 // BUY / SELL badge distance from the candle, in ATR
bullR = 34 // bullish green
bullG = 197
bullB = 94
bearR = 239 // bearish red
bearG = 68
bearB = 68
grayR = 150 // inactive level
grayG = 150
grayB = 150
maxLevels = 60 // volume levels kept on the chart
maxMarks = 60 // BUY / SELL badges kept on the chart
maxDivDraw = 40 // divergence lines kept on the chart
maxTradeDraw = 40 // trade drawings kept on the chart
maxOpen = 40 // signals evaluated at the same time
// === 5. SERIES ===
cciSrc = (high + low + close) / 3
cciV = cci[cciLength](cciSrc)
volAvg = average[volAvgLength](volume)
atrRaw = averagetruerange[14](close)
cl3 = lowest[3](cciV)
cl5 = lowest[5](cciV)
cl7 = lowest[7](cciV)
cl9 = lowest[9](cciV)
ch3 = highest[3](cciV)
ch5 = highest[5](cciV)
ch7 = highest[7](cciV)
ch9 = highest[9](cciV)
// Price pivots. A pivot of strength 5, 7 or 9 is also a pivot of strength 3,
// so the four strength tests of the original collapse into the weakest one.
// isPLo is true on the bar whose offset 3 holds a pivot low. Offsets inside
// the engine count from the CLOSED bar, one behind barindex, so the test
// for "offset o is a price pivot low" reads isPLo[o - 2], not isPLo[o - 3].
plo3 = lowest[3](low)
phi3 = highest[3](high)
isPLo = 0
if low[3] < plo3 and low[3] <= plo3[4] then
isPLo = 1
endif
isPHi = 0
if high[3] > phi3 and high[3] >= phi3[4] then
isPHi = 1
endif
// first bar on which every window the engine needs is complete
wUp = maxDivBars + 20 + volAvgLength + cciLength
// === 6. ENGINE, ONE PASS PER CLOSED BAR ===
// Arrays survive a reload, scalars do not: every persistent counter has to be
// reseeded here or the whole history would be replayed on top of stale state.
if barindex = 0 then
for z = 0 to 24 do
$gv[z] = 0
next
$gv[0] = 0 - 1
for z = 0 to 7 do
$rdyF[z] = 0
$rdyB[z] = 0
$rdyV[z] = 0
next
$stg[0] = 3
$stg[1] = 5
$stg[2] = 7
$stg[3] = 9
endif
// $gv legend
// 0 last bar processed 1 levels pushed 2 divergence lines pushed
// 3 badges pushed 4 trade drawings pushed 5 open evaluations
// 6 divergences seen 7 setup serial 8 active setup id
// 9 active direction 10 setup start bar 11 collection end bar
// 12 candidates of the setup 13 pending direction 14 pending signal bar
// 15 pending stop 16 pending setup id 17 evaluations completed
// 18 reached 0.5R 19 reached 1R 20 reached 2R
// 21 reached 3R 22 invalid signals 23 cumulative MFE in R
// 24 setups already sampled
if barindex > wUp and barindex > $gv[0] then
$gv[0] = barindex
cIdx = barindex - 1
cHigh = high[1]
cLow = low[1]
cClose = close[1]
cOpen = open[1]
cAtr = atrRaw[1]
cVol = volume[1]
cAvgV = volAvg[1]
nLv = $gv[1]
nDv = $gv[2]
nSg = $gv[3]
nMk = $gv[4]
nTr = $gv[5]
nSn = $gv[6]
serial = $gv[7]
actId = $gv[8]
actDir = $gv[9]
setStart = $gv[10]
collEnd = $gv[11]
candCnt = $gv[12]
pendDir = $gv[13]
pendBar = $gv[14]
pendStop = $gv[15]
pendId = $gv[16]
nDone = $gv[17]
nHalf = $gv[18]
nOneR = $gv[19]
nTwoR = $gv[20]
nThreeR = $gv[21]
nInval = $gv[22]
sumMfe = $gv[23]
nSmp = $gv[24]
cMult = 0
if cAvgV > 0 then
cMult = cVol / cAvgV
endif
// --- 6.1 CCI pivots, four strengths ---
// A pivot of strength s sits at offset s + 1 from the current bar, so the
// s bars on its right are already closed and nothing repaints.
$pLoOk[0] = 0
$pHiOk[0] = 0
if cciV[4] < cl3[1] and cciV[4] < cl3[5] then
$pLoOk[0] = 1
endif
if cciV[4] > ch3[1] and cciV[4] > ch3[5] then
$pHiOk[0] = 1
endif
$pLoOk[1] = 0
$pHiOk[1] = 0
if cciV[6] < cl5[1] and cciV[6] < cl5[7] then
$pLoOk[1] = 1
endif
if cciV[6] > ch5[1] and cciV[6] > ch5[7] then
$pHiOk[1] = 1
endif
$pLoOk[2] = 0
$pHiOk[2] = 0
if cciV[8] < cl7[1] and cciV[8] < cl7[9] then
$pLoOk[2] = 1
endif
if cciV[8] > ch7[1] and cciV[8] > ch7[9] then
$pHiOk[2] = 1
endif
$pLoOk[3] = 0
$pHiOk[3] = 0
if cciV[10] < cl9[1] and cciV[10] < cl9[11] then
$pLoOk[3] = 1
endif
if cciV[10] > ch9[1] and cciV[10] > ch9[11] then
$pHiOk[3] = 1
endif
// --- 6.2 a move into the opposite extreme starts a new momentum cycle ---
for z = 0 to 3 do
if $rdyF[z] = 1 and cciV[1] >= extremeLevel then
$rdyF[z] = 0
endif
if $rdyF[z + 4] = 1 and cciV[1] <= 0 - extremeLevel then
$rdyF[z + 4] = 0
endif
next
// --- 6.3 divergence state machine ---
newDiv = 0
newDir = 0
c1Bar = 0
c2Bar = 0
c1Val = 0
c2Val = 0
p1Bar = 0
p2Bar = 0
p1Val = 0
p2Val = 0
for s = 0 to 3 do
sStr = $stg[s]
pOff = sStr + 1
for d = 0 to 1 do
idx = d * 4 + s
pOk = $pLoOk[s]
if d = 1 then
pOk = $pHiOk[s]
endif
if pOk = 1 then
pVal = cciV[pOff]
b2 = cIdx - sStr
atExt = 0
if d = 0 and pVal <= 0 - extremeLevel then
atExt = 1
endif
if d = 1 and pVal >= extremeLevel then
atExt = 1
endif
if $rdyF[idx] = 0 then
// arm on the first pivot beyond the extreme level
if atExt = 1 then
$rdyF[idx] = 1
$rdyB[idx] = b2
$rdyV[idx] = pVal
endif
else
b1 = $rdyB[idx]
v1 = $rdyV[idx]
dist = b2 - b1
oscOk = 0
if d = 0 and pVal > v1 then
oscOk = 1
endif
if d = 1 and pVal < v1 then
oscOk = 1
endif
// The distance test comes first: the price structure search is
// the expensive part and its result is only read when the CCI
// side already qualifies.
psOk = 0
psB1 = 0
psV1 = 0
psB2 = 0
psV2 = 0
if dist > 0 and dist <= maxDivBars and oscOk = 1 then
psBest = 1000000
cSpan = max(dist, 1)
o1c = cIdx - b1
o2c = cIdx - b2
for k1 = 0 to 2 * pivotRadius do
d1 = k1 - pivotRadius
o1 = o1c + d1
ok1 = 0
if o1 >= 3 and o1 + 3 <= cIdx then
if d = 0 then
ok1 = isPLo[o1 - 2]
else
ok1 = isPHi[o1 - 2]
endif
endif
if ok1 = 1 then
for k2 = 0 to 2 * pivotRadius do
d2 = k2 - pivotRadius
o2 = o2c + d2
ok2 = 0
if o2 >= 3 and o2 + 3 <= cIdx then
if d = 0 then
ok2 = isPLo[o2 - 2]
else
ok2 = isPHi[o2 - 2]
endif
endif
if ok2 = 1 then
// Bearish pivots are compared with the sign
// flipped, so one block covers both directions.
// Offsets here count from the CLOSED bar, so
// every series read carries the +1 that turns a
// cIdx offset into a barindex offset.
if d = 0 then
val1 = low[o1 + 1]
val2 = low[o2 + 1]
else
val1 = 0 - high[o1 + 1]
val2 = 0 - high[o2 + 1]
endif
pb1 = cIdx - o1
pb2 = cIdx - o2
pSpan = pb2 - pb1
spanDif = abs(pSpan - cSpan) / cSpan * 100
scr = abs(d1) + abs(d2) + spanDif * 0.1
if pb2 > pb1 and val2 < val1 and spanDif <= spanTolPct and scr < psBest then
intOk = 1
if pb2 - pb1 > 1 then
for ib = pb1 + 1 to pb2 - 1 do
ob = cIdx - ib
obOk = 0
obVal = 0
if ob >= 3 and ob + 3 <= cIdx then
if d = 0 then
obOk = isPLo[ob - 2]
obVal = low[ob + 1]
else
obOk = isPHi[ob - 2]
obVal = 0 - high[ob + 1]
endif
endif
if obOk = 1 and obVal < val2 then
intOk = 0
break
endif
next
endif
if intOk = 1 then
psOk = 1
psBest = scr
psB1 = pb1
psV1 = val1
psB2 = pb2
psV2 = val2
endif
endif
endif
next
endif
next
if psOk = 1 and d = 1 then
psV1 = 0 - psV1
psV2 = 0 - psV2
endif
endif
if psOk = 1 then
if newDiv = 0 then
dirTest = 1
if d = 1 then
dirTest = 0 - 1
endif
dup = 0
nSnDraw = min(nSn, 100)
if nSnDraw > 0 then
snS = (nSn - nSnDraw) mod 100
for k = 0 to nSnDraw - 1 do
j = (snS + k) mod 100
if $snDir[j] = dirTest and abs($snF[j] - psB1) <= 5 and abs($snL[j] - psB2) <= 5 then
dup = 1
break
endif
next
endif
if dup = 0 then
newDiv = 1
newDir = dirTest
c1Bar = b1
c2Bar = b2
c1Val = v1
c2Val = pVal
p1Bar = psB1
p1Val = psV1
p2Bar = psB2
p2Val = psV2
endif
endif
$rdyF[idx] = 0
else
reset = 0
if dist > maxDivBars then
reset = 1
endif
if d = 0 and atExt = 1 and pVal <= v1 then
reset = 1
endif
if d = 1 and atExt = 1 and pVal >= v1 then
reset = 1
endif
if reset = 1 then
$rdyF[idx] = atExt
if atExt = 1 then
$rdyB[idx] = b2
$rdyV[idx] = pVal
endif
endif
endif
endif
endif
next
next
// --- 6.4 a confirmed divergence opens a setup ---
if newDiv = 1 then
snSlot = nSn mod 100
$snDir[snSlot] = newDir
$snF[snSlot] = p1Bar
$snL[snSlot] = p2Bar
nSn = nSn + 1
// the levels of the previous setup lose their signal window
if actId > 0 then
nLvD = min(nLv, maxLevels)
if nLvD > 0 then
lvS = (nLv - nLvD) mod maxLevels
for k = 0 to nLvD - 1 do
i = (lvS + k) mod maxLevels
if $lvSid[i] = actId and $lvSt[i] = 0 then
$lvSt[i] = 3
if extendExpired = 1 then
$lvSt[i] = 2
endif
$lvX2[i] = cIdx
endif
next
endif
endif
serial = serial + 1
actId = serial
actDir = newDir
setStart = cIdx
collEnd = cIdx + searchBars
candCnt = 0
if showPriceLines = 1 then
dvSlot = nDv mod maxDivDraw
$dvX1[dvSlot] = p1Bar
$dvY1[dvSlot] = p1Val
$dvX2[dvSlot] = p2Bar
$dvY2[dvSlot] = p2Val
$dvDir[dvSlot] = newDir
nDv = nDv + 1
endif
// --- automatic search of the first qualifying volume candle ---
vFound = 0
vBar = 0
vHigh = 0
vLow = 0
vMult = 0
vAtr = 0
vBest = 0
for pass = 0 to 1 do
if vFound = 0 then
sStart = c1Bar
sEnd = c2Bar
if pass = 1 then
sStart = c2Bar - 9
sEnd = c2Bar + 9
endif
for o = 0 to maxDivBars + 18 do
aBar = cIdx - o
if aBar >= sStart and aBar <= sEnd then
oAvg = volAvg[o + 1]
oMult = 0
if oAvg > 0 then
oMult = volume[o + 1] / oAvg
endif
if oMult >= minVolMult and (vFound = 0 or volume[o + 1] > vBest) then
vFound = 1
vBar = aBar
vHigh = high[o + 1]
vLow = low[o + 1]
vMult = oMult
vAtr = atrRaw[o + 1]
vBest = volume[o + 1]
endif
endif
next
endif
next
if vFound = 1 then
addOk = 1
nLvD = min(nLv, maxLevels)
if nLvD > 0 then
lvS = (nLv - nLvD) mod maxLevels
for k = 0 to nLvD - 1 do
i = (lvS + k) mod maxLevels
if $lvSid[i] = actId and $lvSrc[i] = vBar then
addOk = 0
break
endif
next
endif
if addOk = 1 then
lvSlot = nLv mod maxLevels
$lvDir[lvSlot] = actDir
$lvPx[lvSlot] = vLow
if actDir = 1 then
$lvPx[lvSlot] = vHigh
endif
$lvCHi[lvSlot] = vHigh
$lvCLo[lvSlot] = vLow
$lvSrc[lvSlot] = vBar
$lvEnd[lvSlot] = cIdx + maxSetupBars
$lvSid[lvSlot] = actId
$lvSt[lvSlot] = 0
$lvX2[lvSlot] = cIdx + 1
$lvMlt[lvSlot] = vMult
$lvAtr[lvSlot] = vAtr
nLv = nLv + 1
candCnt = candCnt + 1
// an older grey reference stops when a new level replaces it
nLvD = min(nLv, maxLevels)
lvS = (nLv - nLvD) mod maxLevels
for k = 0 to nLvD - 1 do
i = (lvS + k) mod maxLevels
if $lvSid[i] <> actId and $lvSt[i] = 2 then
$lvSt[i] = 3
$lvX2[i] = cIdx
endif
next
endif
endif
endif
// --- 6.5 further volume candidates inside the collection window ---
if actId > 0 and cIdx > setStart and cIdx <= collEnd and candCnt < maxCandidates and cMult >= minVolMult then
addOk = 1
nLvD = min(nLv, maxLevels)
if nLvD > 0 then
lvS = (nLv - nLvD) mod maxLevels
for k = 0 to nLvD - 1 do
i = (lvS + k) mod maxLevels
if $lvSid[i] = actId and $lvSrc[i] = cIdx then
addOk = 0
break
endif
next
endif
if addOk = 1 then
lvSlot = nLv mod maxLevels
$lvDir[lvSlot] = actDir
$lvPx[lvSlot] = cLow
if actDir = 1 then
$lvPx[lvSlot] = cHigh
endif
$lvCHi[lvSlot] = cHigh
$lvCLo[lvSlot] = cLow
$lvSrc[lvSlot] = cIdx
$lvEnd[lvSlot] = cIdx + maxSetupBars
$lvSid[lvSlot] = actId
$lvSt[lvSlot] = 0
$lvX2[lvSlot] = cIdx + 1
$lvMlt[lvSlot] = cMult
$lvAtr[lvSlot] = cAtr
nLv = nLv + 1
candCnt = candCnt + 1
nLvD = min(nLv, maxLevels)
lvS = (nLv - nLvD) mod maxLevels
for k = 0 to nLvD - 1 do
i = (lvS + k) mod maxLevels
if $lvSid[i] <> actId and $lvSt[i] = 2 then
$lvSt[i] = 3
$lvX2[i] = cIdx
endif
next
endif
endif
if actId > 0 and cIdx > collEnd then
actDir = 0
endif
// --- 6.6 level lifecycle and breakout authorisation ---
bullSig = 0
bearSig = 0
bullSrc = 0 - 1
bearSrc = 0 - 1
bullSid = 0
bearSid = 0
bullStp = 0
bearStp = 0
nLvD = min(nLv, maxLevels)
if nLvD > 0 then
lvS = (nLv - nLvD) mod maxLevels
for k = 0 to nLvD - 1 do
i = (lvS + k) mod maxLevels
st = $lvSt[i]
// The signal window belongs to this exact level. Once it is over the
// grey line may continue as a reference, but it can never re-arm.
if st = 0 and cIdx > $lvEnd[i] then
st = 3
if extendExpired = 1 then
st = 2
endif
$lvSt[i] = st
$lvX2[i] = $lvEnd[i]
endif
if st = 0 or st = 2 then
$lvX2[i] = cIdx + 1
endif
auth = 0
if st = 0 and cIdx <= $lvEnd[i] and cIdx > $lvSrc[i] then
auth = 1
endif
brk = 0
if auth = 1 and $lvDir[i] = 1 and cClose > $lvPx[i] then
brk = 1
endif
if auth = 1 and $lvDir[i] = 0 - 1 and cClose < $lvPx[i] then
brk = 1
endif
if brk = 1 then
$lvSt[i] = 1
$lvX2[i] = cIdx
if $lvDir[i] = 1 then
bullSig = 1
if $lvSrc[i] > bullSrc then
bullSrc = $lvSrc[i]
bullSid = $lvSid[i]
bullStp = $lvCLo[i]
endif
else
bearSig = 1
if $lvSrc[i] > bearSrc then
bearSrc = $lvSrc[i]
bearSid = $lvSid[i]
bearStp = $lvCHi[i]
endif
endif
endif
next
endif
// Several levels may break on one candle, one badge is drawn.
// The Y of a mark is frozen on its own bar: reading the ATR again while
// repainting would line every badge up with the volatility of the last one.
if bullSig = 1 then
sgSlot = nSg mod maxMarks
$sgX[sgSlot] = cIdx
$sgY[sgSlot] = cLow - cAtr * badgeAtr
$sgG[sgSlot] = cAtr * 0.35
$sgDir[sgSlot] = 1
nSg = nSg + 1
endif
if bearSig = 1 then
sgSlot = nSg mod maxMarks
$sgX[sgSlot] = cIdx
$sgY[sgSlot] = cHigh + cAtr * badgeAtr
$sgG[sgSlot] = cAtr * 0.35
$sgDir[sgSlot] = 0 - 1
nSg = nSg + 1
endif
// --- 6.7 the pending signal opens at the OPEN of the following candle ---
if pendDir <> 0 and cIdx > pendBar then
tEntry = cOpen
tStop = pendStop
tRisk = tEntry - tStop
if pendDir = 0 - 1 then
tRisk = tStop - tEntry
endif
if tRisk > 0 then
if nTr < maxOpen then
$trDir[nTr] = pendDir
$trExp[nTr] = cIdx + evalBars
$trEnt[nTr] = tEntry
$trStp[nTr] = tStop
$trRsk[nTr] = tRisk
$trMax[nTr] = 0
$trH0[nTr] = 0
$trH1[nTr] = 0
$trH2[nTr] = 0
$trH3[nTr] = 0
nTr = nTr + 1
if showTradeMap = 1 then
mkSlot = nMk mod maxTradeDraw
$mkX[mkSlot] = cIdx
$mkEnt[mkSlot] = tEntry
$mkStp[mkSlot] = tStop
$mkTgt[mkSlot] = tEntry + tRisk
if pendDir = 0 - 1 then
$mkTgt[mkSlot] = tEntry - tRisk
endif
nMk = nMk + 1
endif
endif
else
nInval = nInval + 1
endif
pendDir = 0
pendBar = 0
pendStop = 0
pendId = 0
endif
// --- 6.8 cumulative 0.5R / 1R / 2R / 3R reach rates ---
// If the stop and a target sit inside the same historical candle the stop
// wins, because the order inside the candle is unknown.
if nTr > 0 then
for i = nTr - 1 downto 0 do
tDir = $trDir[i]
tEntry = $trEnt[i]
tStop = $trStp[i]
tRisk = $trRsk[i]
tMax = $trMax[i]
curR = (cHigh - tEntry) / tRisk
stopHit = 0
if tDir = 0 - 1 then
curR = (tEntry - cLow) / tRisk
endif
if tDir = 1 and cLow <= tStop then
stopHit = 1
endif
if tDir = 0 - 1 and cHigh >= tStop then
stopHit = 1
endif
tMax = max(tMax, curR)
$trMax[i] = tMax
if stopHit = 0 then
if tMax >= 0.5 then
$trH0[i] = 1
endif
if tMax >= 1 then
$trH1[i] = 1
endif
if tMax >= 2 then
$trH2[i] = 1
endif
if tMax >= 3 then
$trH3[i] = 1
endif
endif
myover = 0
if stopHit = 1 or $trH3[i] = 1 or cIdx >= $trExp[i] then
myover = 1
endif
if myover = 1 then
nDone = nDone + 1
nHalf = nHalf + $trH0[i]
nOneR = nOneR + $trH1[i]
nTwoR = nTwoR + $trH2[i]
nThreeR = nThreeR + $trH3[i]
sumMfe = sumMfe + max(tMax, 0)
$trDir[i] = $trDir[nTr - 1]
$trExp[i] = $trExp[nTr - 1]
$trEnt[i] = $trEnt[nTr - 1]
$trStp[i] = $trStp[nTr - 1]
$trRsk[i] = $trRsk[nTr - 1]
$trMax[i] = $trMax[nTr - 1]
$trH0[i] = $trH0[nTr - 1]
$trH1[i] = $trH1[nTr - 1]
$trH2[i] = $trH2[nTr - 1]
$trH3[i] = $trH3[nTr - 1]
nTr = nTr - 1
endif
next
endif
// --- 6.9 the stop belongs to the exact volume candle whose level broke ---
for d = 0 to 1 do
sigOn = bullSig
sigSid = bullSid
if d = 1 then
sigOn = bearSig
sigSid = bearSid
endif
if sigOn = 1 then
sampled = 0
if firstPerDiv = 1 then
nSmD = min(nSmp, 100)
if nSmD > 0 then
smS = (nSmp - nSmD) mod 100
for k = 0 to nSmD - 1 do
if $smpId[(smS + k) mod 100] = sigSid then
sampled = 1
break
endif
next
endif
endif
if sampled = 0 then
if firstPerDiv = 1 then
$smpId[nSmp mod 100] = sigSid
nSmp = nSmp + 1
endif
if d = 0 then
pendDir = 1
pendStop = bullStp - cAtr * stopDeltaAtr
else
pendDir = 0 - 1
pendStop = bearStp + cAtr * stopDeltaAtr
endif
pendBar = cIdx
pendId = sigSid
endif
endif
next
$gv[1] = nLv
$gv[2] = nDv
$gv[3] = nSg
$gv[4] = nMk
$gv[5] = nTr
$gv[6] = nSn
$gv[7] = serial
$gv[8] = actId
$gv[9] = actDir
$gv[10] = setStart
$gv[11] = collEnd
$gv[12] = candCnt
$gv[13] = pendDir
$gv[14] = pendBar
$gv[15] = pendStop
$gv[16] = pendId
$gv[17] = nDone
$gv[18] = nHalf
$gv[19] = nOneR
$gv[20] = nTwoR
$gv[21] = nThreeR
$gv[22] = nInval
$gv[23] = sumMfe
$gv[24] = nSmp
endif
// === 7. MAP ===
// Everything painted here comes from the ring buffers, so drawonlastbaronly
// clears the previous pass without losing a single historical mark.
if islastbarupdate then
dLv = min($gv[1], maxLevels)
if dLv > 0 then
sLv = ($gv[1] - dLv) mod maxLevels
for k = 0 to dLv - 1 do
i = (sLv + k) mod maxLevels
lvSt = $lvSt[i]
lR = grayR
lG = grayG
lB = grayB
if lvSt = 1 then
lR = bearR
lG = bearG
lB = bearB
if $lvDir[i] = 1 then
lR = bullR
lG = bullG
lB = bullB
endif
endif
drawsegment($lvSrc[i], $lvPx[i], $lvX2[i], $lvPx[i]) coloured(lR, lG, lB, 210) style(line, 2)
if showVolBoxes = 1 then
drawrectangle($lvSrc[i], $lvCHi[i], $lvSrc[i] + 1, $lvCLo[i]) coloured(grayR, grayG, grayB, 191) fillcolor(grayR, grayG, grayB, 26)
boxAtr = $lvAtr[i]
if boxAtr <= 0 then
boxAtr = atrRaw
endif
mlt = round($lvMlt[i] * 100) / 100
drawtext("×#mlt#", $lvSrc[i], $lvCHi[i] + boxAtr * 0.22, SansSerif, Standard, 9) coloured(190, 190, 190, 230)
endif
next
endif
if showPriceLines = 1 then
dDv = min($gv[2], maxDivDraw)
if dDv > 0 then
sDv = ($gv[2] - dDv) mod maxDivDraw
for k = 0 to dDv - 1 do
i = (sDv + k) mod maxDivDraw
dR = bearR
dG = bearG
dB = bearB
if $dvDir[i] = 1 then
dR = bullR
dG = bullG
dB = bullB
endif
drawsegment($dvX1[i], $dvY1[i], $dvX2[i], $dvY2[i]) coloured(dR, dG, dB, 230) style(dottedline, 2)
next
endif
endif
dSg = min($gv[3], maxMarks)
if dSg > 0 then
sSg = ($gv[3] - dSg) mod maxMarks
for k = 0 to dSg - 1 do
i = (sSg + k) mod maxMarks
// Symbol and word go in two separate calls: DRAWTEXT centres the whole
// string, so mixing them would push the arrow away from its candle.
if $sgDir[i] = 1 then
drawtext("BUY", $sgX[i], $sgY[i], SansSerif, Bold, 10) coloured(bullR, bullG, bullB, 255)
drawtext("▲", $sgX[i], $sgY[i] + $sgG[i], SansSerif, Bold, 12) coloured(bullR, bullG, bullB, 255)
else
drawtext("SELL", $sgX[i], $sgY[i], SansSerif, Bold, 10) coloured(bearR, bearG, bearB, 255)
drawtext("▼", $sgX[i], $sgY[i] - $sgG[i], SansSerif, Bold, 12) coloured(bearR, bearG, bearB, 255)
endif
next
endif
if showTradeMap = 1 then
dMk = min($gv[4], maxTradeDraw)
if dMk > 0 then
sMk = ($gv[4] - dMk) mod maxTradeDraw
for k = 0 to dMk - 1 do
i = (sMk + k) mod maxTradeDraw
mx2 = $mkX[i] + projBars
drawsegment($mkX[i], $mkEnt[i], mx2, $mkEnt[i]) coloured(grayR, grayG, grayB, 179) style(dottedline, 1)
drawsegment($mkX[i], $mkStp[i], mx2, $mkStp[i]) coloured(bearR, bearG, bearB, 217) style(line, 1)
drawsegment($mkX[i], $mkTgt[i], mx2, $mkTgt[i]) coloured(bullR, bullG, bullB, 217) style(line, 1)
drawtext("SL", mx2 + 2, $mkStp[i], SansSerif, Standard, 8) coloured(bearR, bearG, bearB, 230)
drawtext("1R", mx2 + 2, $mkTgt[i], SansSerif, Standard, 8) coloured(bullR, bullG, bullB, 230)
next
endif
endif
// --- statistics panel, anchored to the window in pixels ---
if showStats = 1 then
dashX = 0 - 320
dashCol = 190
dashY = 0 - 18
dashStep = 17
stDone = $gv[17]
pcHalf = 0
pcOneR = 0
pcTwoR = 0
pcThreeR = 0
avgMfe = 0
if stDone > 0 then
pcHalf = round($gv[18] * 1000 / stDone) / 10
pcOneR = round($gv[19] * 1000 / stDone) / 10
pcTwoR = round($gv[20] * 1000 / stDone) / 10
pcThreeR = round($gv[21] * 1000 / stDone) / 10
avgMfe = round($gv[23] * 100 / stDone) / 100
endif
nOpen = $gv[5]
nBad = $gv[22]
nHalfC = $gv[18]
nOneRC = $gv[19]
nTwoRC = $gv[20]
nThreeRC = $gv[21]
deltaTxt = stopDeltaAtr
drawtext("CCI VOLUME STATS", dashX, dashY, SansSerif, Bold, 11) coloured(64, 196, 255, 255) anchor(topright, xshift, yshift)
drawtext("Completed", dashX, dashY - dashStep, SansSerif, Standard, 10) coloured(190, 190, 190, 255) anchor(topright, xshift, yshift)
drawtext("#stDone#", dashX + dashCol, dashY - dashStep, SansSerif, Bold, 10) coloured(235, 235, 235, 255) anchor(topright, xshift, yshift)
drawtext("Reached 0.5R", dashX, dashY - 2 * dashStep, SansSerif, Standard, 10) coloured(190, 190, 190, 255) anchor(topright, xshift, yshift)
drawtext("#pcHalf#% (#nHalfC#)", dashX + dashCol, dashY - 2 * dashStep, SansSerif, Bold, 10) coloured(bullR, bullG, bullB, 255) anchor(topright, xshift, yshift)
drawtext("Win rate 1R", dashX, dashY - 3 * dashStep, SansSerif, Standard, 10) coloured(190, 190, 190, 255) anchor(topright, xshift, yshift)
drawtext("#pcOneR#% (#nOneRC#)", dashX + dashCol, dashY - 3 * dashStep, SansSerif, Bold, 10) coloured(bullR, bullG, bullB, 255) anchor(topright, xshift, yshift)
drawtext("Reached 2R", dashX, dashY - 4 * dashStep, SansSerif, Standard, 10) coloured(190, 190, 190, 255) anchor(topright, xshift, yshift)
drawtext("#pcTwoR#% (#nTwoRC#)", dashX + dashCol, dashY - 4 * dashStep, SansSerif, Bold, 10) coloured(bullR, bullG, bullB, 255) anchor(topright, xshift, yshift)
drawtext("Reached 3R", dashX, dashY - 5 * dashStep, SansSerif, Standard, 10) coloured(190, 190, 190, 255) anchor(topright, xshift, yshift)
drawtext("#pcThreeR#% (#nThreeRC#)", dashX + dashCol, dashY - 5 * dashStep, SansSerif, Bold, 10) coloured(bullR, bullG, bullB, 255) anchor(topright, xshift, yshift)
drawtext("Average MFE", dashX, dashY - 6 * dashStep, SansSerif, Standard, 10) coloured(190, 190, 190, 255) anchor(topright, xshift, yshift)
drawtext("#avgMfe#R", dashX + dashCol, dashY - 6 * dashStep, SansSerif, Bold, 10) coloured(235, 235, 235, 255) anchor(topright, xshift, yshift)
drawtext("Active / invalid", dashX, dashY - 7 * dashStep, SansSerif, Standard, 10) coloured(190, 190, 190, 255) anchor(topright, xshift, yshift)
drawtext("#nOpen# / #nBad#", dashX + dashCol, dashY - 7 * dashStep, SansSerif, Bold, 10) coloured(235, 235, 235, 255) anchor(topright, xshift, yshift)
drawtext("Volume SL", dashX, dashY - 8 * dashStep, SansSerif, Standard, 9) coloured(150, 150, 150, 255) anchor(topright, xshift, yshift)
drawtext("delta #deltaTxt# ATR", dashX + dashCol, dashY - 8 * dashStep, SansSerif, Standard, 9) coloured(150, 150, 150, 255) anchor(topright, xshift, yshift)
endif
endif
return
Part 2 — CCI panel (apply in a separate window)
//----------------------------------------------
//PRC_CCI Divergence Volume Breakout by josseliani
//version = 1
//03.09.2026
//Ivan Gonzalez @ www.prorealcode.com
//Concept and design: josseliani - MPL 2.0
//Sharing ProRealTime knowledge
//----------------------------------------------
// PART 2 of 2 - CCI PANEL. Apply this one in a SEPARATE WINDOW.
// Part 1 ("price map") holds the volume levels, the signals and the statistics.
//
// The oscillator, its two extreme levels, the divergence line joining the two
// CCI pivots, and a marker on the pivot that confirmed the divergence.
//
// The divergence detector has to be identical to the one in part 1, so the two
// windows always tell the same story: ProBuilder has no force_overlay, and an
// indicator can only draw inside its own window.
//----------------------------------------------
defparam drawonlastbaronly = true

// === 1. CCI AND DIVERGENCE ===
cciLength = 20        // CCI period
extremeLevel = 150    // only the FIRST pivot must be beyond this level
maxDivBars = 60       // maximum bars between the two CCI pivots
pivotRadius = 7       // bars searched on each side of a CCI pivot for the price pivot
spanTolPct = 35       // maximum price/CCI span difference, in percent
showCciLines = 1      // 1 = draw the divergence line on the CCI
showPivotMarks = 1    // 1 = mark the CCI pivot that confirmed the divergence

// === 2. STYLE ===
bullR = 34            // bullish green
bullG = 197
bullB = 94
bearR = 239           // bearish red
bearG = 68
bearB = 68
cciR = 64             // CCI line
cciG = 196
cciB = 255
maxDivDraw = 40       // divergence lines kept on the chart

// === 3. SERIES ===
cciSrc = (high + low + close) / 3
cciV = cci[cciLength](cciSrc)

cl3 = lowest[3](cciV)
cl5 = lowest[5](cciV)
cl7 = lowest[7](cciV)
cl9 = lowest[9](cciV)
ch3 = highest[3](cciV)
ch5 = highest[5](cciV)
ch7 = highest[7](cciV)
ch9 = highest[9](cciV)

// Price pivots. A pivot of strength 5, 7 or 9 is also a pivot of strength 3,
// so the four strength tests of the original collapse into the weakest one.
// isPLo is true on the bar whose offset 3 holds a pivot low. Offsets inside
// the engine count from the CLOSED bar, one behind barindex, so the test
// for "offset o is a price pivot low" reads isPLo[o - 2], not isPLo[o - 3].
plo3 = lowest[3](low)
phi3 = highest[3](high)
isPLo = 0
if low[3] < plo3 and low[3] <= plo3[4] then
   isPLo = 1
endif
isPHi = 0
if high[3] > phi3 and high[3] >= phi3[4] then
   isPHi = 1
endif

wUp = maxDivBars + 20 + cciLength

// === 4. ENGINE, ONE PASS PER CLOSED BAR ===
// Same closed bar engine as part 1: the state machine advances exactly once
// per closed candle, and its persistent state lives in arrays because scalars
// are rewound on every tick of the live bar while arrays are not.
if barindex = 0 then
   for z = 0 to 2 do
      $pv[z] = 0
   next
   $pv[0] = 0 - 1
   for z = 0 to 7 do
      $rdyF[z] = 0
      $rdyB[z] = 0
      $rdyV[z] = 0
   next
   $stg[0] = 3
   $stg[1] = 5
   $stg[2] = 7
   $stg[3] = 9
endif

// $pv legend: 0 last bar processed, 1 divergence lines pushed, 2 divergences seen

if barindex > wUp and barindex > $pv[0] then
   $pv[0] = barindex

   cIdx = barindex - 1
   nDv = $pv[1]
   nSn = $pv[2]

   // --- 4.1 CCI pivots, four strengths ---
   // A pivot of strength s sits at offset s + 1 from the current bar, so the
   // s bars on its right are already closed and nothing repaints.
   $pLoOk[0] = 0
   $pHiOk[0] = 0
   if cciV[4] < cl3[1] and cciV[4] < cl3[5] then
      $pLoOk[0] = 1
   endif
   if cciV[4] > ch3[1] and cciV[4] > ch3[5] then
      $pHiOk[0] = 1
   endif
   $pLoOk[1] = 0
   $pHiOk[1] = 0
   if cciV[6] < cl5[1] and cciV[6] < cl5[7] then
      $pLoOk[1] = 1
   endif
   if cciV[6] > ch5[1] and cciV[6] > ch5[7] then
      $pHiOk[1] = 1
   endif
   $pLoOk[2] = 0
   $pHiOk[2] = 0
   if cciV[8] < cl7[1] and cciV[8] < cl7[9] then
      $pLoOk[2] = 1
   endif
   if cciV[8] > ch7[1] and cciV[8] > ch7[9] then
      $pHiOk[2] = 1
   endif
   $pLoOk[3] = 0
   $pHiOk[3] = 0
   if cciV[10] < cl9[1] and cciV[10] < cl9[11] then
      $pLoOk[3] = 1
   endif
   if cciV[10] > ch9[1] and cciV[10] > ch9[11] then
      $pHiOk[3] = 1
   endif

   // --- 4.2 a move into the opposite extreme starts a new momentum cycle ---
   for z = 0 to 3 do
      if $rdyF[z] = 1 and cciV[1] >= extremeLevel then
         $rdyF[z] = 0
      endif
      if $rdyF[z + 4] = 1 and cciV[1] <= 0 - extremeLevel then
         $rdyF[z + 4] = 0
      endif
   next

   // --- 4.3 divergence state machine ---
   newDiv = 0
   newDir = 0
   c1Bar = 0
   c2Bar = 0
   c1Val = 0
   c2Val = 0
   p1Bar = 0
   p2Bar = 0

   for s = 0 to 3 do
      sStr = $stg[s]
      pOff = sStr + 1
      for d = 0 to 1 do

         idx = d * 4 + s
         pOk = $pLoOk[s]
         if d = 1 then
            pOk = $pHiOk[s]
         endif

         if pOk = 1 then
            pVal = cciV[pOff]
            b2 = cIdx - sStr

            atExt = 0
            if d = 0 and pVal <= 0 - extremeLevel then
               atExt = 1
            endif
            if d = 1 and pVal >= extremeLevel then
               atExt = 1
            endif

            if $rdyF[idx] = 0 then
               if atExt = 1 then
                  $rdyF[idx] = 1
                  $rdyB[idx] = b2
                  $rdyV[idx] = pVal
               endif
            else
               b1 = $rdyB[idx]
               v1 = $rdyV[idx]
               dist = b2 - b1

               oscOk = 0
               if d = 0 and pVal > v1 then
                  oscOk = 1
               endif
               if d = 1 and pVal < v1 then
                  oscOk = 1
               endif

               // The distance test comes first: the price structure search is
               // the expensive part and its result is only read when the CCI
               // side already qualifies.
               psOk = 0
               psB1 = 0
               psB2 = 0

               if dist > 0 and dist <= maxDivBars and oscOk = 1 then
                  psBest = 1000000
                  cSpan = max(dist, 1)
                  o1c = cIdx - b1
                  o2c = cIdx - b2

                  for k1 = 0 to 2 * pivotRadius do
                     d1 = k1 - pivotRadius
                     o1 = o1c + d1
                     ok1 = 0
                     if o1 >= 3 and o1 + 3 <= cIdx then
                        if d = 0 then
                           ok1 = isPLo[o1 - 2]
                        else
                           ok1 = isPHi[o1 - 2]
                        endif
                     endif

                     if ok1 = 1 then
                        for k2 = 0 to 2 * pivotRadius do
                           d2 = k2 - pivotRadius
                           o2 = o2c + d2
                           ok2 = 0
                           if o2 >= 3 and o2 + 3 <= cIdx then
                              if d = 0 then
                                 ok2 = isPLo[o2 - 2]
                              else
                                 ok2 = isPHi[o2 - 2]
                              endif
                           endif

                           if ok2 = 1 then
                              // Bearish pivots are compared with the sign
                              // flipped, so one block covers both directions.
                              // Offsets here count from the CLOSED bar, so
                              // every series read carries the +1 that turns a
                              // cIdx offset into a barindex offset.
                              if d = 0 then
                                 val1 = low[o1 + 1]
                                 val2 = low[o2 + 1]
                              else
                                 val1 = 0 - high[o1 + 1]
                                 val2 = 0 - high[o2 + 1]
                              endif
                              pb1 = cIdx - o1
                              pb2 = cIdx - o2
                              pSpan = pb2 - pb1
                              spanDif = abs(pSpan - cSpan) / cSpan * 100
                              scr = abs(d1) + abs(d2) + spanDif * 0.1

                              if pb2 > pb1 and val2 < val1 and spanDif <= spanTolPct and scr < psBest then
                                 intOk = 1
                                 if pb2 - pb1 > 1 then
                                    for ib = pb1 + 1 to pb2 - 1 do
                                       ob = cIdx - ib
                                       obOk = 0
                                       obVal = 0
                                       if ob >= 3 and ob + 3 <= cIdx then
                                          if d = 0 then
                                             obOk = isPLo[ob - 2]
                                             obVal = low[ob + 1]
                                          else
                                             obOk = isPHi[ob - 2]
                                             obVal = 0 - high[ob + 1]
                                          endif
                                       endif
                                       if obOk = 1 and obVal < val2 then
                                          intOk = 0
                                          break
                                       endif
                                    next
                                 endif
                                 if intOk = 1 then
                                    psOk = 1
                                    psBest = scr
                                    psB1 = pb1
                                    psB2 = pb2
                                 endif
                              endif
                           endif
                        next
                     endif
                  next
               endif

               if psOk = 1 then
                  if newDiv = 0 then
                     dirTest = 1
                     if d = 1 then
                        dirTest = 0 - 1
                     endif
                     dup = 0
                     nSnD = min(nSn, 100)
                     if nSnD > 0 then
                        snS = (nSn - nSnD) mod 100
                        for k = 0 to nSnD - 1 do
                           j = (snS + k) mod 100
                           if $snDir[j] = dirTest and abs($snF[j] - psB1) <= 5 and abs($snL[j] - psB2) <= 5 then
                              dup = 1
                              break
                           endif
                        next
                     endif
                     if dup = 0 then
                        newDiv = 1
                        newDir = dirTest
                        c1Bar = b1
                        c2Bar = b2
                        c1Val = v1
                        c2Val = pVal
                        p1Bar = psB1
                        p2Bar = psB2
                     endif
                  endif
                  $rdyF[idx] = 0
               else
                  reset = 0
                  if dist > maxDivBars then
                     reset = 1
                  endif
                  if d = 0 and atExt = 1 and pVal <= v1 then
                     reset = 1
                  endif
                  if d = 1 and atExt = 1 and pVal >= v1 then
                     reset = 1
                  endif
                  if reset = 1 then
                     $rdyF[idx] = atExt
                     if atExt = 1 then
                        $rdyB[idx] = b2
                        $rdyV[idx] = pVal
                     endif
                  endif
               endif
            endif
         endif
      next
   next

   if newDiv = 1 then
      snSlot = nSn mod 100
      $snDir[snSlot] = newDir
      $snF[snSlot] = p1Bar
      $snL[snSlot] = p2Bar
      nSn = nSn + 1

      dvSlot = nDv mod maxDivDraw
      $dvX1[dvSlot] = c1Bar
      $dvY1[dvSlot] = c1Val
      $dvX2[dvSlot] = c2Bar
      $dvY2[dvSlot] = c2Val
      $dvDir[dvSlot] = newDir
      nDv = nDv + 1
   endif

   $pv[1] = nDv
   $pv[2] = nSn
endif

// === 5. MAP ===
if islastbarupdate then
   dDv = min($pv[1], maxDivDraw)
   if dDv > 0 then
      sDv = ($pv[1] - dDv) mod maxDivDraw
      for k = 0 to dDv - 1 do
         i = (sDv + k) mod maxDivDraw
         dR = bearR
         dG = bearG
         dB = bearB
         if $dvDir[i] = 1 then
            dR = bullR
            dG = bullG
            dB = bullB
         endif
         if showCciLines = 1 then
            drawsegment($dvX1[i], $dvY1[i], $dvX2[i], $dvY2[i]) coloured(dR, dG, dB, 230) style(dottedline, 2)
         endif
         if showPivotMarks = 1 then
            if $dvDir[i] = 1 then
               drawtext("▲", $dvX2[i], $dvY2[i], SansSerif, Bold, 13) coloured(dR, dG, dB, 255)
            else
               drawtext("▼", $dvX2[i], $dvY2[i], SansSerif, Bold, 13) coloured(dR, dG, dB, 255)
            endif
         endif
      next
   endif
endif

lowerLvl = 0 - extremeLevel

return cciV coloured(cciR, cciG, cciB) style(line, 2) as "CCI", extremeLevel coloured(bearR, bearG, bearB, 191) style(dottedline, 1) as "Upper extreme", 0 as "Zero" coloured(150, 150, 150, 128) style(dottedline, 1), lowerLvl coloured(bullR, bullG, bullB, 191) style(dottedline, 1) as "Lower extreme"
Settings Worth Touching
Most defaults are fine. These three change the character of the indicator:
- Minimum Volume × Average (1.5). The single most important number. Raise it to 2.0 on liquid instruments and you get far fewer, far cleaner levels. Lower it below 1.3 and almost any candle qualifies, which defeats the purpose.
- Breakout Signal Window (40 bars). How long a level may fire. Shorten it if you trade fast and want the setup to die with the momentum that created it.
- Maximum Candidates per Divergence (1). Raise it to 2 or 3 and one divergence can leave several stacked levels. Useful on higher timeframes where the reaction takes longer to build.
And one that is easy to misread: Search After Divergence only controls how long the indicator keeps looking for a volume candle. It does not control how long the resulting level can trigger — that is the signal window, and it is counted separately from the moment the level is created.
Honest Criticism
Three things I would change, and one to be aware of.
The armed level and the expired one look identical. Both are drawn in the same grey. On the chart there is no way to tell “this level can still fire” from “this one is only a memory”. Lowering the transparency of expired levels would fix it in one line, and it is the first edit I would make.
The four pivot strengths on the price side are one strength. The price-pivot test evaluates strengths 3, 5, 7 and 9 and takes whichever passes. But a pivot that is the extreme of a 9-bar window on each side is, by construction, also the extreme of a 3-bar window, so the four tests always agree with the weakest one. Verified over ten thousand cases: zero disagreements. It changes no signal, but it costs four times more than it needs to inside a double loop, which is why the code here runs the weakest test only.
A tight stop delta produces “invalid” signals. The stop sits behind the volume candle plus an ATR cushion. With the cushion at zero, if the entry open lands beyond that edge the risk is zero or negative and the signal is discarded and counted as Invalid. A high Invalid count is not a bug — it means the cushion is too tight for that instrument.
And the one to be aware of: the divergence itself is a two-pivot construct with a 60-bar cap. On a strongly trending instrument the CCI can hug one extreme for a long time and the first pivot expires before a second one arrives. That is correct behaviour — two lows separated by four hundred bars are two regimes, not a divergence — but it means the indicator goes quiet in exactly the conditions where people most want a reversal signal. Quiet is the right answer there.
Conclusion
What makes this one worth having on the chart is not the divergence — it is the discipline stacked on top of it. A divergence gives permission, a high-volume candle gives a level, a close gives the timing, and an expiry stops the level from haunting the chart forever. Each piece can be switched off or retuned independently, which is rare in tools of this size.
Use the dashboard to compare instruments and timeframes, not to forecast. And if you only change one setting, change the volume multiple.
Comments
You must be logged in to post a comment.
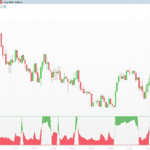
De nada! Respecto a la señal del panel. Ese triángulo marca el segundo pivote del CCI de una divergencia confirmada. Es decir: "aquí ha quedado confirmada una divergencia", que en la lógica del indicador es el permiso para empezar a buscar, no la orden de entrar. La señal de verdad es la chapa BUY / SELL sobre el precio, y esa sólo aparece cuando una vela cierra más allá del nivel de volumen. Respecto a la señal BUY/SELL. Le etiqueta no la verás la semana de rotura sino a la apertura de la semana siguiente. La señal se coloca sobre la vela correcta pero sólo cuando abre la semana siguiente. Lo que sí puedes hacer el fin de semana es manual y funciona: el nivel gris se extiende hasta la última vela. Si el cierre semanal del viernes ha quedado por encima (setup alcista) o por debajo (bajista) de esa línea gris, el lunes te va a salir la etiqueta del buy/sell. Me anoto crear un screener para este indicador.
Buenos días. Lo primero de todo, muchísimas gracias por tu trabajo y por todos los indicadores que pones en esta biblioteca. En relación con este, "Ruptura del volumen de divergencia del CCI", tengo que decir que me parece muy interesante. He modificado un par de parámetros como sugieres en tu descripción del indicador (Volumen mínimo x promedio de 1,5 a 2,0 y Candidatos máximos por divergencia de 1 a 2), lo he testeado en velas semanales y me da unos resultados bastante buenos. Quería hacerte un par de preguntas: 1.-La señal que aparece en el Panel CCI (el que no va en el precio sino aparte), ese triángulo rojo o verde, entiendo que se dibuja al final de la vela. Entonces, si examino los gráficos durante el fin de semana, podré ver el triángulo rojo o verde que se haya podido formar en la última vela semanal? Quiero decir que si el triangulito aparece en el momento en que se forma la vela o aparece algunas velas después? 2.-Existiría la posibilidad de crear un screener para encontrar activos que hayan activado uno de estos triangulitos en la última vela formada? Nada más. Te reitero mi agradecimiento por tu trabajo. Un saludo,