





Rolling Candle Profile: a Buying and Selling Pressure
Introduction
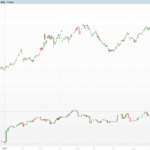
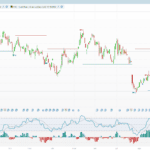
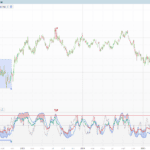
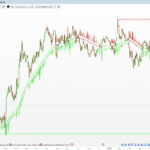
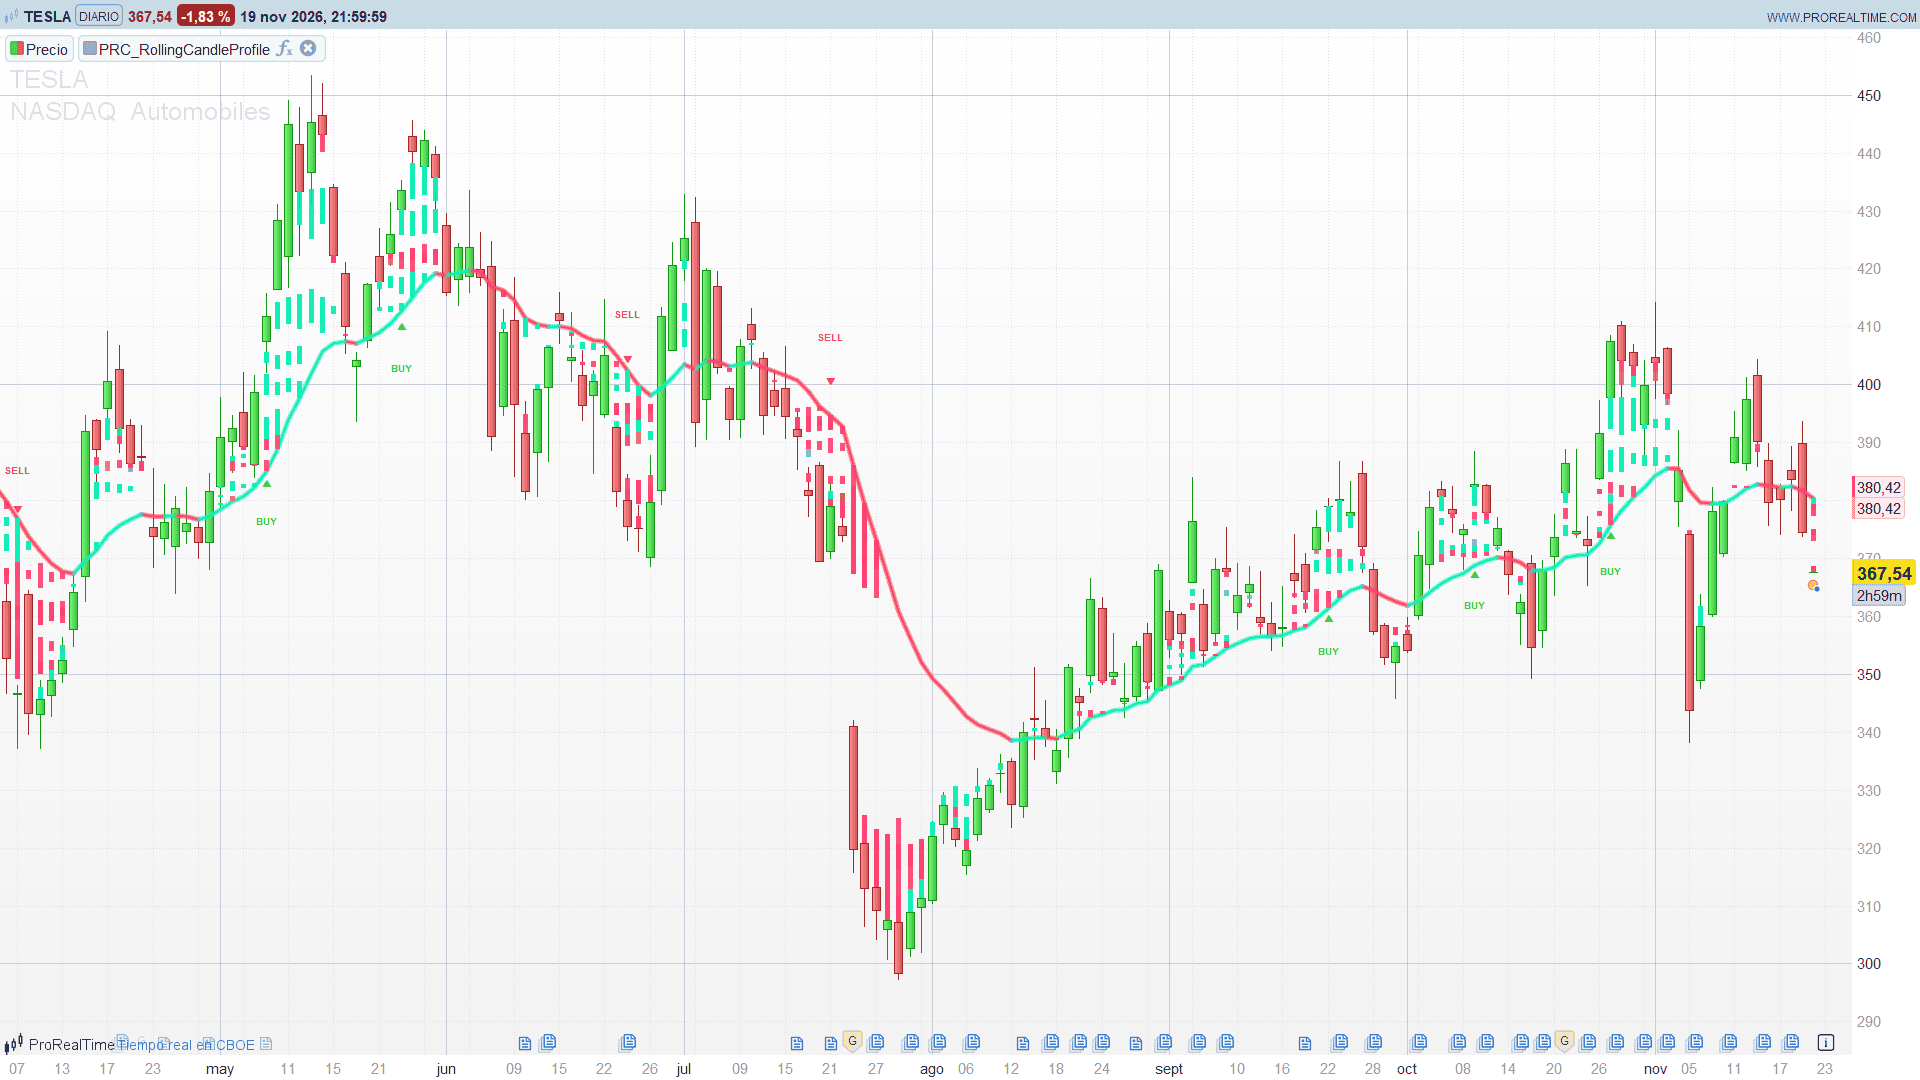
Most pressure tools give you one number per candle: delta, a buying percentage, an oscillator. The Rolling Candle Profile by Zeiierman puts that information back where it happened, on the price axis. Between a moving anchor and the body of each candle it draws a corridor of twelve bands, and each band is coloured by the buying or selling pressure that the last sixty candles left at that price height. Green pockets show where buyers have been in control, red pockets where sellers have, and grey or empty bands show areas with little activity or no clear winner. When the corridor is broad and one-sided and price is on the right side of a rising or falling anchor, the indicator prints a BUY or SELL label.
Theory Behind the Indicator
The anchor. The corridor is built from a reference price, the anchor: an EMA by default, or an SMA, a volume weighted average, a daily VWAP or the midpoint of a Donchian channel, all with the same length (21). The anchor is drawn as a line with a soft glow, green while it rises and red while it falls.
Pressure of each candle. Every candle is split into five loads, each with its own price centre:
- buying pressure, centred near the close and the high;
- selling pressure, centred near the close and the low;
- lower wick rejection (buyers defending a low), centred between the low and the bottom of the body;
- upper wick rejection (sellers defending a high), centred between the high and the top of the body;
- stalled activity, centred on the typical price.
Three engines are available. Price Pressure (default) uses no volume at all: it combines the move from the previous close, the body direction and where the candle closes inside its range, and gives extra weight when the move continues the previous one. Volume Delta splits the candle volume between buyers and sellers according to the body. Hybrid mixes both. The loads are normalised against a 55-bar EMA of total activity, so one huge candle cannot flood the profile.
The bands. The distance between the anchor and the nearest edge of the candle body is divided into twelve bands. At the centre of each band, the indicator adds up the loads of the last 60 candles that sit close to that price, using a smooth bell-shaped kernel around each load centre, and halves the weight of a candle every three bars. The difference between the buying and the selling field gives the colour of the band, from neutral grey to the buying or selling colour; the amount of activity gives its opacity. A band with too little activity or no clear imbalance is left empty. When the anchor is inside the body there is no corridor on that candle.
Signals. A BUY needs four things at once: at least 7 of the 12 bands coloured, a buying share of the visible profile above the dominance threshold (0.25), more buying bands than selling bands, and a close above a rising anchor. The label appears on the first candle where all of this becomes true, and two BUY labels must be at least 6 bars apart. SELL is the mirror case, with its own spacing. Each signal is a triangle with the word next to it: an up triangle with BUY below it under the candle, a down triangle with SELL above it over the candle. The marker sits just beyond the recent high or low and is always pushed outside the anchor (below it for BUY, above it for SELL), so it never falls inside the coloured corridor.
Key Features at a Glance
- Twelve-band pressure corridor between the anchor and each candle body.
- Three pressure engines: price only, volume delta and hybrid.
- Five anchor types: EMA, SMA, VWMA, daily VWAP and Donchian midpoint.
- Colour and opacity driven by imbalance and activity, with a brightness control.
- BUY / SELL labels filtered by profile breadth, dominance, anchor slope and minimum spacing.
- Triangle + label markers placed outside the anchor and the corridor.
How to Read the Indicator
- Wide green corridor below the candles with a green rising anchor: buyers have been absorbing every dip over the last candles. Pullbacks into the corridor tend to find support.
- Wide red corridor above the candles with a red falling anchor: sellers dominate and rallies into the corridor are being sold.
- Grey or thin corridor: mixed or weak pressure. Expect range trading rather than trend continuation.
- Bands changing colour from the anchor outwards: pressure is shifting. A red corridor turning green near the anchor often comes before a change of slope of the anchor.
- BUY / SELL label: the profile, the anchor and price all line up in one direction for the first time.
Practical Applications
- Trend filter. Trade only in the direction of the corridor colour and the anchor slope.
- Pullback entries. In an uptrend, look for longs when price returns towards a green corridor and the bands stay green; the anchor is a natural reference for the stop.
- Signal confirmation. Use the BUY / SELL labels as a trigger only when they agree with your higher timeframe view; raise minBands or sigDom to keep only the strongest ones.
- Instruments without reliable volume. The default Price Pressure engine does not use volume, so it works on forex and CFDs as well as on stocks and futures.
Indicator Configuration
- anchType (default: 1): anchor type. 1 = EMA, 2 = SMA, 3 = VWMA, 4 = daily VWAP, 5 = Donchian midpoint.
- anchorLen (default: 21): anchor length, from 5 to 200.
- pressMode (default: 1): pressure engine. 1 = Price Pressure, 2 = Volume Delta, 3 = Hybrid.
- pxWidth (default: 0.01): price localisation width, from 0.01 to 2. Low values give sharper pressure pockets, high values a smoother gradient.
- wickW (default: 0.85): weight of wick rejection, from 0 to 2.5.
- brightness (default: 3.0): visibility of the gradient, from 0.5 to 3. It does not change the calculation.
- showAnchor (default: 1): draws the anchor and its glow.
- Only the last 500 bars are calculated (
DEFPARAM CALCULATEONLASTBARS = 500at the top of the code); raise it to see the profile further back, at the cost of loading time. - sigOn (default: 1): BUY / SELL labels.
- sigDom (default: 0.25): minimum pressure dominance for a signal, from 0.05 to 0.95.
- minBands (default: 7): minimum number of coloured bands, from 1 to 12. Lower it for earlier signals.
- sigGap (default: 6): minimum bars between two signals of the same side. Opposite signals are independent.
- txtSize (default: 10): label text size in pixels.
- labLookback (default: 10): bars used to place the label beyond the recent high or low.
- labMaxGap (default: 1.0): maximum distance of a label from its candle, in ATR, unless the anchor is further away (the label always stays outside the anchor).
- Colour variables at the top of the code: buying and selling pressure, neutral grey and the two label colours.
Code
//---------------------------------------------------------------
// PRC_RollingCandleProfile
// version = 3
// 20.11.2026
// Iván González @ www.prorealcode.com
// Author: Zeiierman
// Sharing ProRealTime knowledge
//--------------------------------------------------------------------//

// only the last 500 bars are calculated and drawn, to keep loading fast
DEFPARAM CALCULATEONLASTBARS = 500

// ===================== INPUTS
// --- Anchor
anchType = 1           // 1 = EMA, 2 = SMA, 3 = VWMA, 4 = VWAP (daily session), 5 = Donchian Mid
anchorLen = 21         // 5 to 200
// --- Pressure engine
pressMode = 1          // 1 = Price Pressure, 2 = Volume Delta, 3 = Hybrid
pxWidth = 0.01         // price-localization width (0.01 to 2.0)
wickW = 0.85           // wick rejection influence (0 to 2.5)
// --- Gradient
brightness = 3.0       // 0.5 to 3.0
showAnchor = 1         // draw the anchor and its glow
// --- Signals
sigOn = 1              // BUY / SELL signals
sigDom = 0.25          // pressure dominance threshold (0.05 to 0.95)
minBands = 7           // minimum colored bands out of 12
sigGap = 6             // minimum bars between two signals of the same side
txtSize = 10           // label text size in pixels
labLookback = 10       // label extremes lookback (1 to 30)
labMaxGap = 1.0        // max label distance from the candle, in ATR

// ===================== COLORS
buyR = 0
buyG = 239
buyB = 180
sellR = 255
sellG = 61
sellB = 110
neuR = 114
neuG = 128
neuB = 150
buyLabR = 34
buyLabG = 197
buyLabB = 94
sellLabR = 242
sellLabG = 54
sellLabB = 69

// ===================== ANCHOR
isPrice = pressMode = 1
isHybrid = pressMode = 3
tp = typicalprice
emaK = 2 / (anchorLen + 1)

// EMA seeded with the simple average of the first anchorLen closes
IF barindex = anchorLen - 1 THEN
   baseEma = average[anchorLen](close)
ELSIF barindex >= anchorLen THEN
   baseEma = baseEma[1] + emaK * (close - baseEma[1])
ENDIF
smaA = average[anchorLen](close)
vwDen = summation[anchorLen](volume)
vwNum = summation[anchorLen](close * volume)
donHi = highest[anchorLen](high)
donLo = lowest[anchorLen](low)

// session VWAP of the typical price, reset at every new trading day
IF barindex = 0 OR gettimeframe >= 86400 OR intradaybarindex = 0 THEN
   cumPV = tp * volume
   cumVol = volume
ELSE
   cumPV = cumPV[1] + tp * volume
   cumVol = cumVol[1] + volume
ENDIF

IF anchType = 5 THEN
   anchWarm = anchorLen
ELSIF anchType = 4 THEN
   anchWarm = 0
ELSE
   anchWarm = anchorLen - 1
ENDIF

IF barindex < anchWarm THEN
   anch = undefined
ELSIF anchType = 2 THEN
   anch = smaA
ELSIF anchType = 3 THEN
   IF vwDen > 0 THEN
      anch = vwNum / vwDen
   ELSE
      anch = baseEma
   ENDIF
ELSIF anchType = 4 THEN
   IF cumVol > 0 THEN
      anch = cumPV / cumVol
   ELSE
      anch = baseEma
   ENDIF
ELSIF anchType = 5 THEN
   anch = (donHi[1] + donLo[1]) * 0.5
ELSE
   anch = baseEma
ENDIF

// ===================== CANDLE PRESSURE
rg = max(high - low, ticksize)
IF barindex = 0 THEN
   prevC = open
ELSE
   prevC = close[1]
ENDIF
directional = max(-1, min(1, (close - open) / rg))
impulse = abs(directional)
travel = max(-1.5, min(1.5, (close - prevC) / rg))
closeLoc = max(-1, min(1, (2 * close - high - low) / rg))
response = max(-1.5, min(1.5, 0.55 * travel + 0.25 * directional + 0.20 * closeLoc))
force = abs(response)
IF barindex >= 2 THEN
   priorTravel = close[1] - close[2]
ELSE
   priorTravel = 0
ENDIF
IF priorTravel * response > 0 THEN
   contin = 1.45
ELSIF priorTravel * response < 0 THEN
   contin = 0.55
ELSE
   contin = 1.0
ENDIF
IF volume > 0 THEN
   rawV = volume
ELSE
   rawV = 1
ENDIF
IF isHybrid THEN
   vv = rawV * (0.65 + force * 0.70)
   flowDir = max(-1, min(1, 0.45 * directional + 0.55 * response))
ELSE
   vv = rawV
   flowDir = directional
ENDIF
lowW = max(0, min(open, close) - low) / rg
highW = max(0, high - max(open, close)) / rg

IF isPrice THEN
   buyNow = max(response, 0) * (1 + force * 1.25) * contin * 2
   sellNow = max(0 - response, 0) * (1 + force * 1.25) * contin * 2
   lowRej = lowW * (0.35 + 1.20 * max(response, 0))
   highRej = highW * (0.35 + 1.20 * max(0 - response, 0))
   stallNow = (1 - min(force, 1)) * 0.20
   bPx = close * 0.70 + high * 0.30
   sPx = close * 0.70 + low * 0.30
   totalNow = buyNow + sellNow + lowRej + highRej + stallNow
ELSE
   buyNow = vv * (1 + flowDir) * 0.5
   sellNow = vv * (1 - flowDir) * 0.5
   lowRej = vv * lowW
   highRej = vv * highW
   stallNow = vv * (1 - impulse)
   IF isHybrid THEN
      bPx = tp * 0.75 + high * 0.25
      sPx = tp * 0.75 + low * 0.25
   ELSE
      bPx = tp
      sPx = tp
   ENDIF
   totalNow = vv
ENDIF

// ===================== PRESSURE CENTERS
// a weighted center built from a single candle is the price of that candle
IF buyNow > 0 THEN
   buyCtr = bPx
ELSE
   buyCtr = tp
ENDIF
IF sellNow > 0 THEN
   sellCtr = sPx
ELSE
   sellCtr = tp
ENDIF
IF lowRej > 0 THEN
   lowCtr = (low + min(open, close)) * 0.5
ELSE
   lowCtr = low
ENDIF
IF highRej > 0 THEN
   highCtr = (high + max(open, close)) * 0.5
ELSE
   highCtr = high
ENDIF

// 55-bar EMA of the activity, seeded with its simple average
IF barindex = 54 THEN
   emaTot = average[55](totalNow)
ELSIF barindex > 54 THEN
   emaTot = emaTot[1] + (2 / 56) * (totalNow - emaTot[1])
ENDIF
IF barindex >= 54 THEN
   baseLn = emaTot
ELSE
   baseLn = totalNow
ENDIF
IF totalNow > 0 THEN
   flowScale = min(1, max(baseLn, 0.000001) * 20 / totalNow)
ELSE
   flowScale = 1
ENDIF
buyNow = buyNow * flowScale
sellNow = sellNow * flowScale
lowRej = lowRej * flowScale
highRej = highRej * flowScale

// ===================== CORRIDOR GEOMETRY
bodyLo = min(open, close)
bodyHi = max(open, close)
atrV = averagetruerange[14](close)
edgeOk = 0
edgeP = close
IF barindex >= anchWarm THEN
   IF anch < bodyLo THEN
      edgeP = bodyLo
      edgeOk = 1
   ELSIF anch > bodyHi THEN
      edgeP = bodyHi
      edgeOk = 1
   ENDIF
ENDIF
isReady = 0
IF barindex >= max(anchorLen + 2, 62) AND edgeOk = 1 THEN
   IF abs(edgeP - anch) > 2 * ticksize THEN
      isReady = 1
   ENDIF
ENDIF
distB = 0
IF isReady = 1 THEN
   distB = (edgeP - anch) / 12
ENDIF
ageDecay = pow(0.5, 1 / 3)
volBase = max(0.000001, baseLn)
locRng = max(high - low, ticksize)
baseW = locRng * pxWidth
baseWickW = baseW * 0.6

// ===================== BAND PRESSURE
profBuy = 0
profSell = 0
visBands = 0
buyBands = 0
sellBands = 0
FOR b = 0 TO 11 DO
   $bR[b] = neuR
   $bG[b] = neuG
   $bB[b] = neuB
   $bA[b] = 0
   $bF[b] = 0
   $sF[b] = 0
NEXT

IF isReady = 1 THEN
   IF isPrice THEN
      minW = abs(distB) * 1.15
      minWickW = abs(distB) * 1.00
   ELSE
      minW = abs(distB) * 1.8
      minWickW = abs(distB) * 1.3
   ENDIF
   absD = abs(distB)
   // The past candles are the outer loop: each one is read once and only feeds the
   // bands its kernel reaches. Band b sits at anch + distB * (b + 0.5), so a center at
   // position tPos = (center - anch) / distB with half-width rad = width / |distB|
   // touches the bands with |b + 0.5 - tPos| < rad. Same sums as a 12 x 60 double loop.
   age = 1
   FOR k = 0 TO 59 DO
      wK = max(max(baseW[k], minW), ticksize)
      wwK = max(max(baseWickW[k], minWickW), ticksize)
      // buying pressure
      ldV = buyNow[k] * age
      IF ldV > 0 THEN
         tPos = (buyCtr[k] - anch) / distB
         rad = wK / absD
         b1 = max(0, ceil(tPos - rad - 0.5))
         b2 = min(11, floor(tPos + rad - 0.5))
         IF b1 <= b2 THEN
            FOR b = b1 TO b2 DO
               q = 1 - abs(b + 0.5 - tPos) / rad
               IF q > 0 THEN
                  $bF[b] = $bF[b] + ldV * q * q * (3 - 2 * q)
               ENDIF
            NEXT
         ENDIF
      ENDIF
      // selling pressure
      ldV = sellNow[k] * age
      IF ldV > 0 THEN
         tPos = (sellCtr[k] - anch) / distB
         rad = wK / absD
         b1 = max(0, ceil(tPos - rad - 0.5))
         b2 = min(11, floor(tPos + rad - 0.5))
         IF b1 <= b2 THEN
            FOR b = b1 TO b2 DO
               q = 1 - abs(b + 0.5 - tPos) / rad
               IF q > 0 THEN
                  $sF[b] = $sF[b] + ldV * q * q * (3 - 2 * q)
               ENDIF
            NEXT
         ENDIF
      ENDIF
      // lower wick rejection counts as buying
      ldV = wickW * lowRej[k] * age
      IF ldV > 0 THEN
         tPos = (lowCtr[k] - anch) / distB
         rad = wwK / absD
         b1 = max(0, ceil(tPos - rad - 0.5))
         b2 = min(11, floor(tPos + rad - 0.5))
         IF b1 <= b2 THEN
            FOR b = b1 TO b2 DO
               q = 1 - abs(b + 0.5 - tPos) / rad
               IF q > 0 THEN
                  $bF[b] = $bF[b] + ldV * q * q * (3 - 2 * q)
               ENDIF
            NEXT
         ENDIF
      ENDIF
      // upper wick rejection counts as selling
      ldV = wickW * highRej[k] * age
      IF ldV > 0 THEN
         tPos = (highCtr[k] - anch) / distB
         rad = wwK / absD
         b1 = max(0, ceil(tPos - rad - 0.5))
         b2 = min(11, floor(tPos + rad - 0.5))
         IF b1 <= b2 THEN
            FOR b = b1 TO b2 DO
               q = 1 - abs(b + 0.5 - tPos) / rad
               IF q > 0 THEN
                  $sF[b] = $sF[b] + ldV * q * q * (3 - 2 * q)
               ENDIF
            NEXT
         ENDIF
      ENDIF
      age = age * ageDecay
   NEXT
   FOR b = 0 TO 11 DO
      buyF = $bF[b]
      sellF = $sF[b]
      totF = buyF + sellF
      IF totF > 0 THEN
         imb = max(-1, min(1, (buyF - sellF) / totF * 3))
      ELSE
         imb = 0
      ENDIF
      IF isPrice THEN
         activity = max(0, min(1, totF / (volBase * 0.80)))
         tintMix = max(0, min(1, 0.40 + 0.60 * abs(imb)))
      ELSE
         activity = max(0, min(1, totF / (volBase * 2.0)))
         tintMix = max(0, min(1, (0.18 + 0.82 * abs(imb)) * (0.75 + 0.25 * activity)))
      ENDIF
      // hue: neutral grey blended toward the buying or selling color
      IF imb > 0.03 THEN
         hR = round(neuR * (1 - tintMix) + buyR * tintMix)
         hG = round(neuG * (1 - tintMix) + buyG * tintMix)
         hB = round(neuB * (1 - tintMix) + buyB * tintMix)
      ELSIF imb < -0.03 THEN
         hR = round(neuR * (1 - tintMix) + sellR * tintMix)
         hG = round(neuG * (1 - tintMix) + sellG * tintMix)
         hB = round(neuB * (1 - tintMix) + sellB * tintMix)
      ELSE
         hR = neuR
         hG = neuG
         hB = neuB
      ENDIF
      IF activity < 0.08 THEN
         fadeT = activity / 0.08
         hR = round(neuR * (1 - fadeT) + hR * fadeT)
         hG = round(neuG * (1 - fadeT) + hG * fadeT)
         hB = round(neuB * (1 - fadeT) + hB * fadeT)
      ENDIF
      // transparency on the 0-100 scale, then turned into an opacity 0-255
      bandOn = 0
      IF isPrice THEN
         transpT = round(max(3, min(88, 69 - brightness * 12 - 35 * activity - 17 * abs(imb))))
         IF activity >= 0.08 AND abs(imb) >= 0.14 THEN
            bandOn = 1
         ENDIF
      ELSE
         transpT = round(max(4, min(76, 60 - brightness * 21 - 22 * activity - 12 * abs(imb))))
         IF activity < 0.08 THEN
            transpT = 76
         ENDIF
         IF transpT < 8 THEN
            bandOn = 1
         ENDIF
      ENDIF
      IF bandOn = 1 THEN
         $bR[b] = hR
         $bG[b] = hG
         $bB[b] = hB
         $bA[b] = round((100 - transpT) * 2.55)
         profBuy = profBuy + buyF
         profSell = profSell + sellF
         visBands = visBands + 1
         IF imb > 0.03 THEN
            buyBands = buyBands + 1
         ELSIF imb < -0.03 THEN
            sellBands = sellBands + 1
         ENDIF
      ENDIF
   NEXT
ENDIF

// ===================== SIGNALS
profTotal = profBuy + profSell
IF profTotal > 0 THEN
   profBias = (profBuy - profSell) / profTotal
ELSE
   profBias = 0
ENDIF
currBuy = buyNow + wickW * lowRej
currSell = sellNow + wickW * highRej
currTotal = currBuy + currSell
IF currTotal > 0 THEN
   currBias = (currBuy - currSell) / currTotal
ELSE
   currBias = 0
ENDIF
hasProfile = 0
IF visBands >= minBands AND profTotal > 0 THEN
   hasProfile = 1
ENDIF
IF hasProfile = 1 THEN
   actBias = profBias
ELSE
   actBias = currBias
ENDIF
anchRising = 0
anchFalling = 0
IF barindex > anchWarm THEN
   IF anch > anch[1] THEN
      anchRising = 1
   ELSIF anch < anch[1] THEN
      anchFalling = 1
   ENDIF
ENDIF

buyPress = 0
sellPress = 0
IF actBias >= sigDom THEN
   IF hasProfile = 1 THEN
      IF buyBands > sellBands THEN
         buyPress = 1
      ENDIF
   ELSIF profTotal <= 0 OR profBias > 0 - sigDom THEN
      buyPress = 1
   ENDIF
ENDIF
IF actBias <= 0 - sigDom THEN
   IF hasProfile = 1 THEN
      IF sellBands > buyBands THEN
         sellPress = 1
      ENDIF
   ELSIF profTotal <= 0 OR profBias < sigDom THEN
      sellPress = 1
   ENDIF
ENDIF

buyAlign = 0
sellAlign = 0
IF hasProfile = 1 AND barindex >= anchWarm THEN
   IF close > anch AND anchRising = 1 AND buyPress = 1 THEN
      buyAlign = 1
   ENDIF
   IF close < anch AND anchFalling = 1 AND sellPress = 1 THEN
      sellAlign = 1
   ENDIF
ENDIF
IF barindex > 0 THEN
   prevBuyAlign = buyAlign[1]
   prevSellAlign = sellAlign[1]
ELSE
   prevBuyAlign = 0
   prevSellAlign = 0
ENDIF

ONCE lastBuy = -1
ONCE lastSell = -1
buySig = 0
sellSig = 0
IF sigOn = 1 AND buyAlign = 1 AND prevBuyAlign = 0 THEN
   IF lastBuy < 0 OR barindex - lastBuy >= sigGap THEN
      buySig = 1
   ENDIF
ENDIF
IF sigOn = 1 AND sellAlign = 1 AND prevSellAlign = 0 THEN
   IF lastSell < 0 OR barindex - lastSell >= sigGap THEN
      sellSig = 1
   ENDIF
ENDIF

// ===================== SIGNAL LABEL PLACEMENT
recentLo = lowest[labLookback](low)
recentHi = highest[labLookback](high)
IF barindex >= 13 THEN
   safeAtr = max(atrV, ticksize)
ELSE
   safeAtr = max(high - low, ticksize)
ENDIF
labPad = max(safeAtr * 0.12, ticksize * 2)
gapMax = max(safeAtr * labMaxGap, labPad)
buyLabY = max(recentLo - labPad, low - gapMax)
sellLabY = min(recentHi + labPad, high + gapMax)
// keep the marker clear of the anchor and of the corridor drawn between anchor and candle:
// BUY goes below the anchor, SELL above it
IF barindex >= anchWarm THEN
   buyLabY = min(buyLabY, anch - labPad)
   sellLabY = max(sellLabY, anch + labPad)
ENDIF
// triangle next to the candle, the word one text line further away
txtGap = safeAtr * 0.45
IF buySig = 1 THEN
   lastBuy = barindex
   DRAWTEXT("▲", barindex, buyLabY, SansSerif, Bold, txtSize) COLOURED(buyLabR, buyLabG, buyLabB, 255)
   DRAWTEXT("BUY", barindex, buyLabY - txtGap, SansSerif, Bold, txtSize) COLOURED(buyLabR, buyLabG, buyLabB, 255)
ENDIF
IF sellSig = 1 THEN
   lastSell = barindex
   DRAWTEXT("▼", barindex, sellLabY, SansSerif, Bold, txtSize) COLOURED(sellLabR, sellLabG, sellLabB, 255)
   DRAWTEXT("SELL", barindex, sellLabY + txtGap, SansSerif, Bold, txtSize) COLOURED(sellLabR, sellLabG, sellLabB, 255)
ENDIF

// ===================== GRADIENT RENDERING
// one vertical block per colored band on each candle, stacked from the anchor to the body edge
IF isReady = 1 THEN
   FOR b = 0 TO 11 DO
      IF $bA[b] > 0 THEN
         segLo = anch + distB * b
         segHi = anch + distB * (b + 1)
         sR = $bR[b]
         sG = $bG[b]
         sB = $bB[b]
         sA = $bA[b]
         DRAWSEGMENT(barindex, segLo, barindex, segHi) COLOURED(sR, sG, sB, sA) STYLE(line, 5)
      ENDIF
   NEXT
ENDIF

// ===================== ANCHOR RENDERING
IF barindex > anchWarm THEN
   IF anch >= anch[1] THEN
      aR = buyR
      aG = buyG
      aB = buyB
   ELSE
      aR = sellR
      aG = sellG
      aB = sellB
   ENDIF
ELSE
   aR = buyR
   aG = buyG
   aB = buyB
ENDIF
IF showAnchor = 1 THEN
   glowA = 127
   lineA = 255
ELSE
   glowA = 0
   lineA = 0
ENDIF

RETURN anch COLOURED(aR, aG, aB, glowA) STYLE(line, 5) AS "Anchor Glow", anch COLOURED(aR, aG, aB, lineA) STYLE(line, 2) AS "Anchor"
Original author: Zeiierman, published open source under the Creative Commons Attribution-NonCommercial-ShareAlike 4.0 International licence (CC BY-NC-SA 4.0).